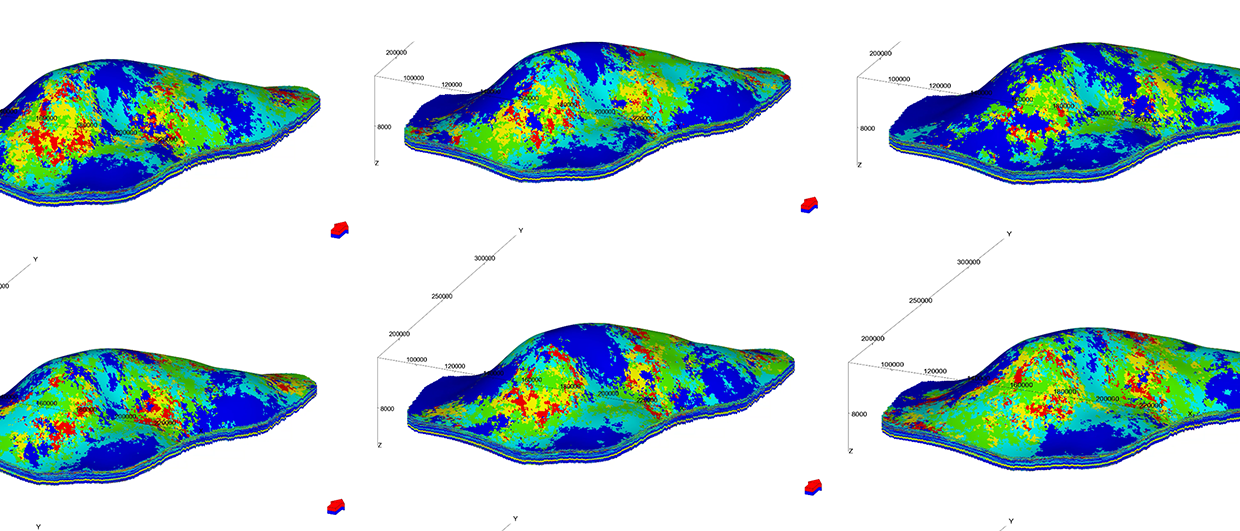
Reservoir lithology and fluid properties can be characterized using seismic, CSEM and rock physics.
Surface measurements such as seismic and controlled source electromagnetic (CSEM) data are commonly used to estimate reservoir properties. Seismic data provide an excellent image of structure and stratigraphy, and can be inverted to provide a quantitative interpretation of porosity, lithology and litho-fluid facies. The CSEM method provides a surface measurement of electrical resistivity, which is an integral part of a petrophysical interpretation; however, the structural resolution is limited. CSEM data must be tightly integrated with available well and seismic data in order to provide a robust interpretation.
An Integrated Analysis
A dataset consisting of nine lines of 2D GeoStreamer® seismic and towed streamer CSEM data (695 km total) was acquired concurrently in 2015 by PGS in an area in the Hoop Fault Complex on the Bjarmeland Platform in the Barents Sea. This dataset covers the Wisting discovery in the south-west of the survey area, and extends to the area east of the Atlantis well in the north. Two public domain wells in the area provide calibration for the integrated analysis. Oil-bearing sands were encountered in the Realgrunnen interval at well 7324/8-1 (Wisting Central). Nearby well 7324/7- 1S (Wisting Alternative) targeted the deeper Kobbe and Snadd intervals, where oil shows were encountered; however, water-bearing rocks were found in the Realgrunnen interval. Two additional wells have been drilled in the immediate vicinity; 7324/7-2 (Hanssen) yielded a small oil discovery, and 7324/8-2 (Bjaaland) was dry.
A significant response to the Wisting Central accumulation can be clearly seen in the CSEM data in a wide range of frequencies. The CSEM data for six frequencies were inverted using an Occam approach to derive anisotropic resistivity models. Appropriate seismic structural constraints were applied to help enhance the resolution of the CSEM results and allow the interpretation to be focused in the zone of interest. Fast track processed pre-stack seismic data were conditioned carefully to be optimal for inversion, and then inverted using a simultaneous elastic impedance inversion to derive P- and S- impedance values.
Rock property estimation from seismic data was carried out using the multi-attribute rotation scheme (MARS) described by Alvarez et al. (2015). This method is a hybrid rock physics/ statistical approach designed to yield the optimum seismic inversion attribute correlation to target reservoir properties. MARS estimates a new attribute τ in the direction of maximum change of a target property in an n-dimensional Euclidean space formed by n-number of attributes. We search for the maximum correlation between the target property and all of the possible attributes that can be estimated via an axis rotation of the basis that forms the aforementioned space. This methodology uses well log data to evaluate the relationship between all possible elastic attribute spaces and a target petrophysical property using a similar correlation approach to the one used by Whitcombe et al. (2002) in the Extended Elastic Impedance methodology. For this case study, MARS was used to estimate total porosity, clay content and litho-fluid facies volumes from seismically derived volumes of P- and S-wave impedance. A cross-section of the resultant volume of litho-fluid facies along the Wisting Central and Alternative wells, with their Vclay (left) and Sw (right) curves, are shown in the Figure 1a below. The green-colored areas may be related to clean oil or fizz gas sand – the seismic data alone cannot distinguish between commercial and non-commercial hydrocarbon saturation.
The final stage in the analysis is therefore to invert the seismic and CSEM derived properties within a rock physics framework. The inclusion of the CSEM resistivity information within the inversion approach allows for the separation of these two possible scenarios.
1a: A cross-section of the resultant volume of litho-fluid facies obtained from seismic and well log data along a 2D line covering wells 7324/7-1S and 7324/8-1, with Vclay (left) and Sw (right) curves overlaid.
1b: A cross-section of the resultant volume of Sw obtained from a joint interpretation of CSEM, seismic and well log data, with Sw curves from wells 7324/7-1S and 7324/8-1.
Successful Predictions
Excellent correlation with known well results was achieved. The integration of seismic, CSEM, and well data predicts very high hydrocarbon saturations at Wisting Central, consistent with the findings of the well. The slightly lower saturation at Hanssen is related to 3D effects in the CSEM data, but the outcome of the well is predicted correctly. There is no significant saturation at Wisting Alternative, again consistent with the findings of the well. At Bjaaland, although the seismic indications are good (Figure 1a), the integrated interpretation result again predicts correctly that this well was unsuccessful.
Acknowledgements
RSI would like to thank PGS for providing the towed streamer CSEM and GeoStreamer™ seismic data used in this study.
References
Alvarez, P., Bolivar, F., Di Luca, M. & Salinas, T., 2015, Multi-attribute rotation scheme: A tool for reservoir property prediction from seismic inversion attributes, Interpretation, 3, SAE9- SAAE18.
Whitcombe, D. N., Connolly, P. A., Reagan R. L.,and Redshaw, T. C., 2002, Extended elastic impedance for fluid and lithology prediction: Geophysics, 67, 63–67.


