The south-east Barents Sea was unexplored for many years prior to the territorial settlement between Norway and Russia in 2011. Since then, the region has been the focus of intense activity. The drive to apply new technology comes from the remoteness and cost of operating in the Arctic, and from the inherent geological complexity of this frontier area (Doré et al. 1999, Pease 2011).
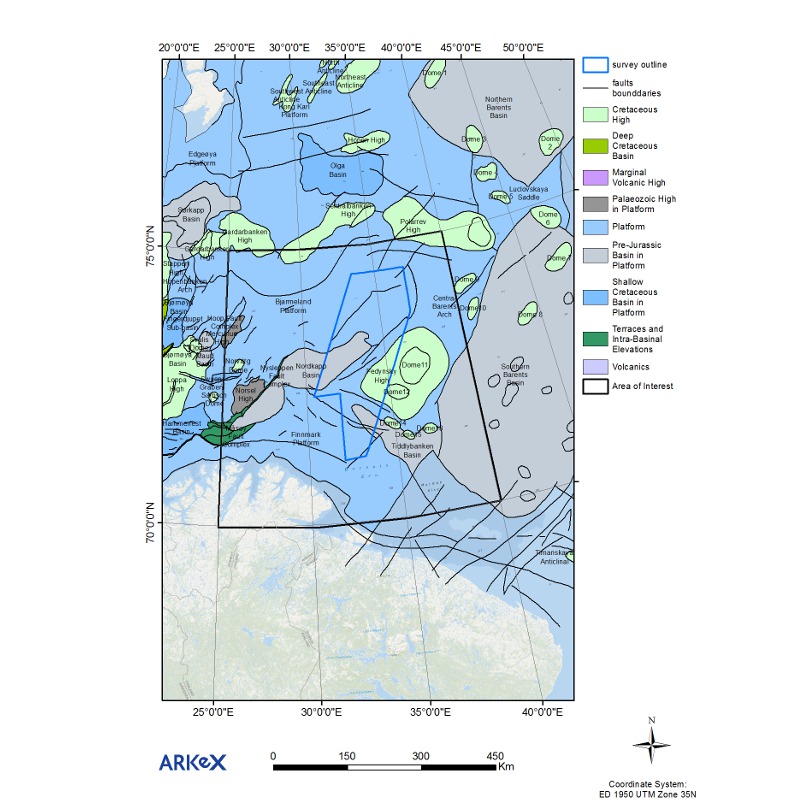 Location of the FTG survey and the expanded area of interest for the ARKeX multiclient study of the south-east Barents Sea. The base map shows the tectonic elements of the Barents Shelf (Source: Norwegian Petroleum Directorate).Under Norwegian administration the area was included in the 23rd Concession Round. During 2013 and 2014, ARKeX Ltd acquired a Multi-Client Full Tensor Gravity Gradiometry (FTG) survey over a 42,000 km2 area of the south-east Barents Sea which was designed to complement an extensive 2D seismic program offered by the Norwegian Petroleum Directorate (NPD) and four newly acquired 3D seismic surveys in the region.
The interpretation of the FTG survey addresses some of the key issues presented by the complexity of the geology on a regional scale. It helps identify and map structural trends associated with three major orogenic episodes; the north-west-trending Precambrian Timanian Orogen, the north and north-east-trending middle Paleozoic Caledonian Orogen, and the north-trending Permo-Triassic Uralian Orogen (Pease 2011). Mapping the basement structures in the south-east Barents Sea is an important step to a better understanding of the structural and kinematic development of overlying, potentially hydrocarbonbearing, basins. This is particularly important in basins like the Nordkapp Basin where salt is present, as the timing of salt mobilisation and the geometry of the resulting salt diapirs may be tectonically controlled.
Of additional interest are the opportunities and risks associated with inversion, uplift and erosion in the Cenozoic. Erosion removed between 1,400 and 1,600 m of Cretaceous and Paleogene strata from the south-east Barents Shelf, resulting in a major change of pressure, volume, and temperature conditions in potential reservoir and seal rocks at the Triassic-Jurassic level (Henriksen et al. 2011). FTG technology allows the measurement and mapping of small variations in the bulk density of sections of the Triassic and Jurassic succession, providing a new tool for investigating the effects of Cenozoic inversion, uplift and erosion in this region.
In this article we present a preliminary insight into broadband gravity measurements afforded by the FTG method and its integration with seismic data. The main focus is on structural interpretation and salt morphology, which when considered as a whole provide additional information regarding the tectonic evolution of the area.
Applying Gravity Gradiometry
The ability to directly measure the gravity gradient tensor effectively isolates the signal coming from the varying density of the Earth’s subsurface from the accelerations experienced by the measurement platform (vessel or aircraft). The fact that the full tensor is measured further enhances the signal to noise ratio and reduces smearing of ‘out of plane’ signal. The Lockheed Martin Full Tensor Gravity Gradiometer is also fitted with an additional set of instruments (the Gravity Measurement Assembly or GMA) to measure gravity, as well as the gravity gradient, so that longer wavelength information is not compromised. A good way to think of the FTG measurement compared to that of a conventional gravity meter is to regard the data available from FTG surveys as ‘broadband gravity’. The noise isolation increases the higher frequency response resulting in much better lateral resolution, and the GMA takes care of the low frequency end. These data capture both the long wavelength components of the gravity field that are driven by deep structure and the shorter wavelengths which result from midcrustal and near surface structure.
To provide a regional context to the FTG data and to capture the longer wavelength features provided by a wider survey area, the area of interest for this study was expanded to include the region between 24º E and 39º E and 70º N and 75º N. The FTG data are interpreted in conjunction with satellite gravity and EMAG2 magnetic data (Sandwell and Smith 2009, Maus et al. 2009) and published seismic data and maps to deduce the structure of the expanded study area in a GIS-based map.
The maps that are readily obtained both for the vertical gravity gradient (Gzz) and also for acceleration due to gravity (Gz) show a striking array of geological features with improved definition, positional accuracy and resolution over and above that which could be achieved with a conventional gravity meter. Whilst it is possible to build a geological model based solely on the interpretation of these data, there is a significant opportunity to extract greater value from an integrated interpretation where 2D or 3D seismic sections are available. Simultaneous interpretation of the seismic and gravity data has been used to identify major basement-involved faults on the seismic data; these faults were then interpolated along-strike, away from the seismic lines using the gravity data. This is a relatively simple way to ensure a more robust interpretation of how faults link along-strike.
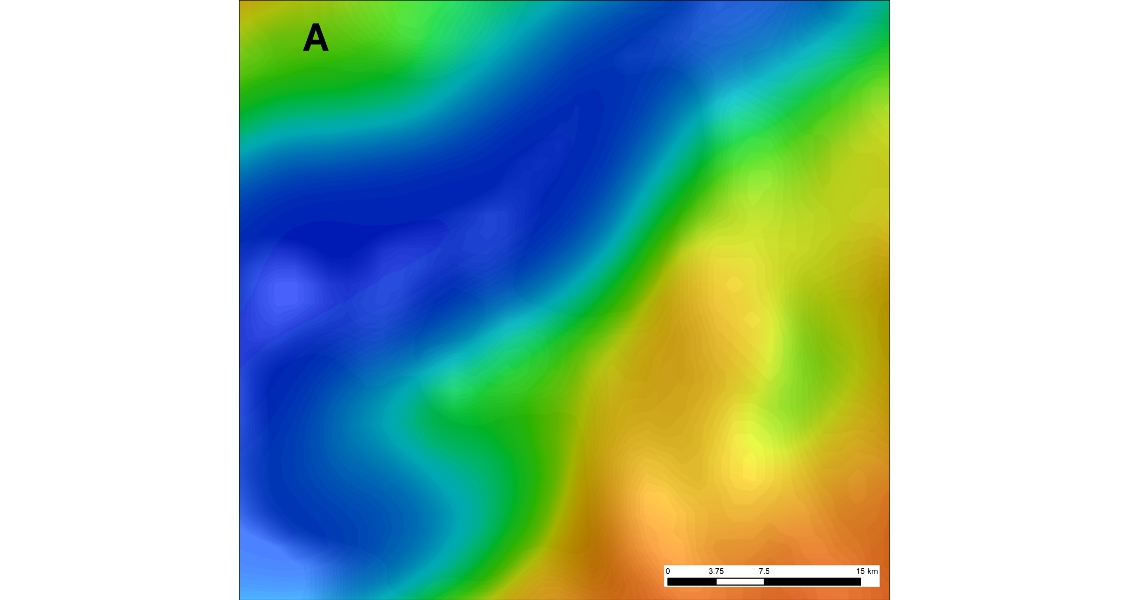
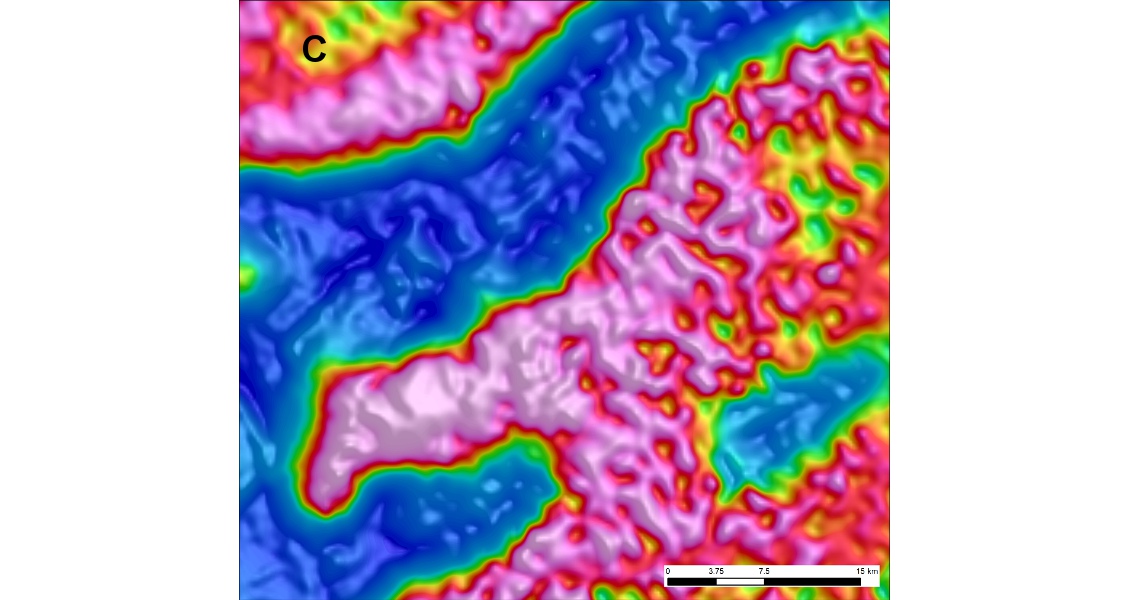
Gravity datasets over part of the Nordkapp Basin. A. Satellite gravity data (Sandwell et al. 2014). B. Gravity data derived from the ARKeX FTG survey. C. Gravity gradiometry data from the ARKeX FTG survey.
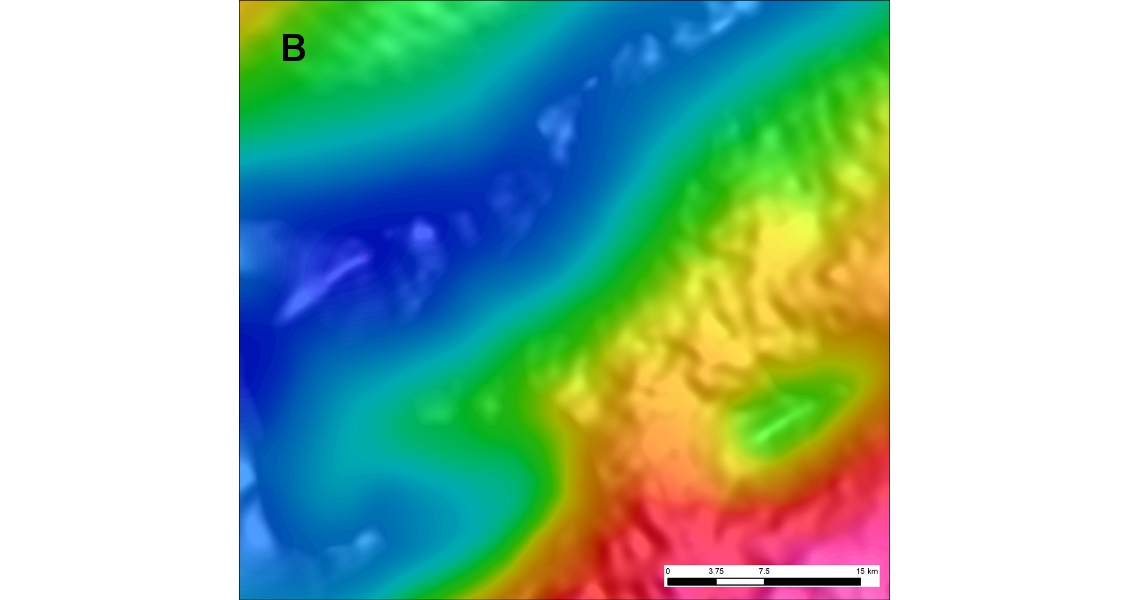
Gravity datasets over part of the Nordkapp Basin. A. Satellite gravity data (Sandwell et al. 2014). B. Gravity data derived from the ARKeX FTG survey. C. Gravity gradiometry data from the ARKeX FTG survey.
Gravity datasets over part of the Nordkapp Basin. A. Satellite gravity data (Sandwell et al. 2014). B. Gravity data derived from the ARKeX FTG survey. C. Gravity gradiometry data from the ARKeX FTG survey.
Density Contrasts
The gravity gradiometry data is particularly sensitive to large, shallow density contrasts, like those formed by shallow salt diapirs in contact with denser host rocks. Top salt and maximum salt distribution were interpreted from the seismic and gravity gradiometry data and used to make a new salt map of the region. In addition to mapping salt diapirs, the gravity gradiometry data have proven sensitive enough to map grounded salt pillows trapped in the Permian succession at 4-6 km depth on the flanks of the Nordkapp Basin. To further investigate the geometry of the flanks of the salt diapirs, and the structure of the basins in which they reside, 2D/2.5D density models were produced to satisfy the gravity, gravity gradiometry and seismic data (see figure below). The FTG data also show that the Nordkapp Basin contains several significant salt diapirs. The anomaly amplitude profile across the diapirs requires that the Nordkapp Basin contains thick columns of salt (in excess of 6 km thick), which can be mapped along strike over tens of kilometres.
There are two clearly evident structural trends exhibiting north-west and north-east directional alignment respectively. This may reflect the varying influence of Caledonian and Timanian structures and their influence on the architecture of overlying basins.
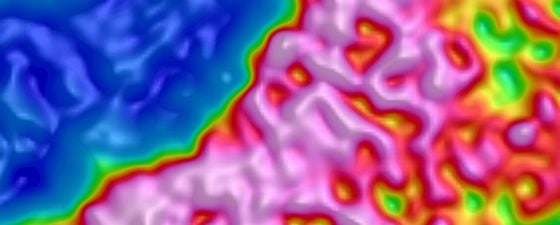
Short wavelength (1-5 km) gravity gradient anomalies may be related to the variable geology of the seabed, and to subtle changes in the bulk density of the Triassic and Jurassic succession. These density changes correspond to faults that bound mildly deformed domains in which either compressional strain (increased density) or tensile strain (decreased density) is dominant. This deformation occurred through multiple phases of Mesozoic halokinesis and Cenozoic inversion, uplift and erosion.
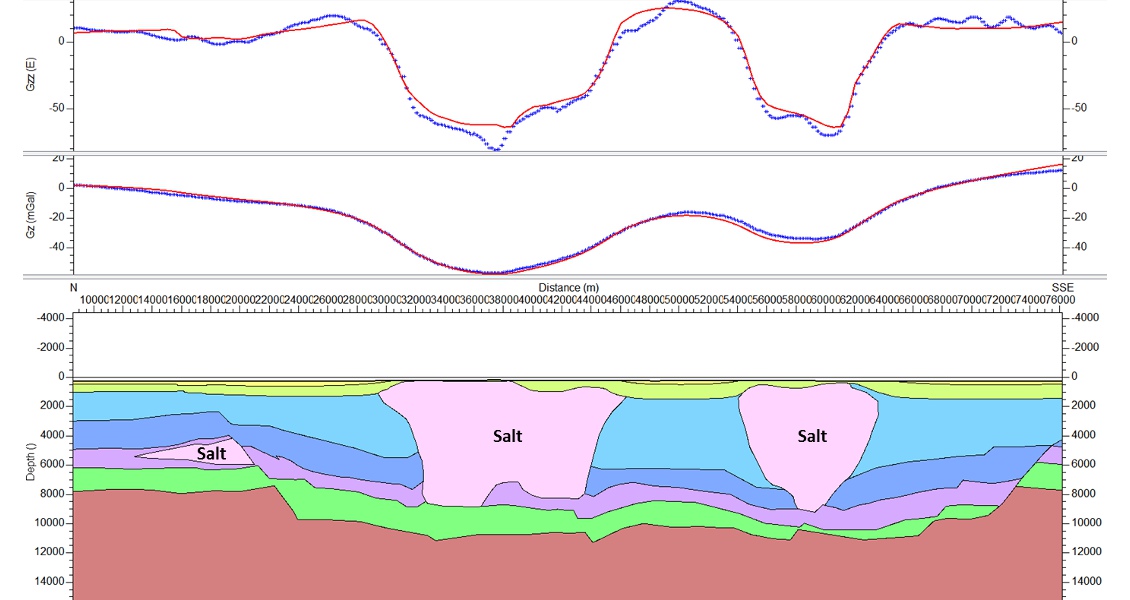
An example of a 2D/2.5D density model across the Nordkapp Basin. The model satisfies seismic, gravity and gradiometry data. The amplitude of the gradiometry anomalies requires a significant volume of salt in the diapirs. The gradient of the anomaly profile, in conjunction with a top salt interpretation from seismic, helps to define likely salt flank geometries.
Integrated Regional Interpretation
Broadband gravity data from a new FTG survey are used to produce a regional structural interpretation of the south-east Barents Sea which can be integrated with other geophysical and geological datasets to produce robust interpretations from the regional to prospect scale. The long wavelength component of the gravimetry and gravity gradiometry data are used to map out basement-involved fault zones, by interpolation between seismic lines. Variations in the orientation of the principal basins in the region are attributed to variations in the basement structural grain that they have inherited. Short wavelength anomalies in the gravity gradiometry data are attributed to a combination of seabed density variations and deformation zones at the Triassic- Jurassic level, caused by a combination of halokinesis and tectonic inversion, uplift and erosion (unburdening). Using 2D/2.5 D modelling of the gravity gradiometry data in conjunction with seismic interpretation to investigate the distribution and morphology of salt bodies shows that diapirs in the Nordkapp Basin comprise thick, laterally extensive columns of salt.
The south-east Barents FTG survey is a multi-client dataset, and as such has presented ARKeX with the opportunity to provide a qualitative interpretation package for delivery with the data. The interpretation has suggested a number of key features and events that improve understanding of the structural evolution of this complex region.
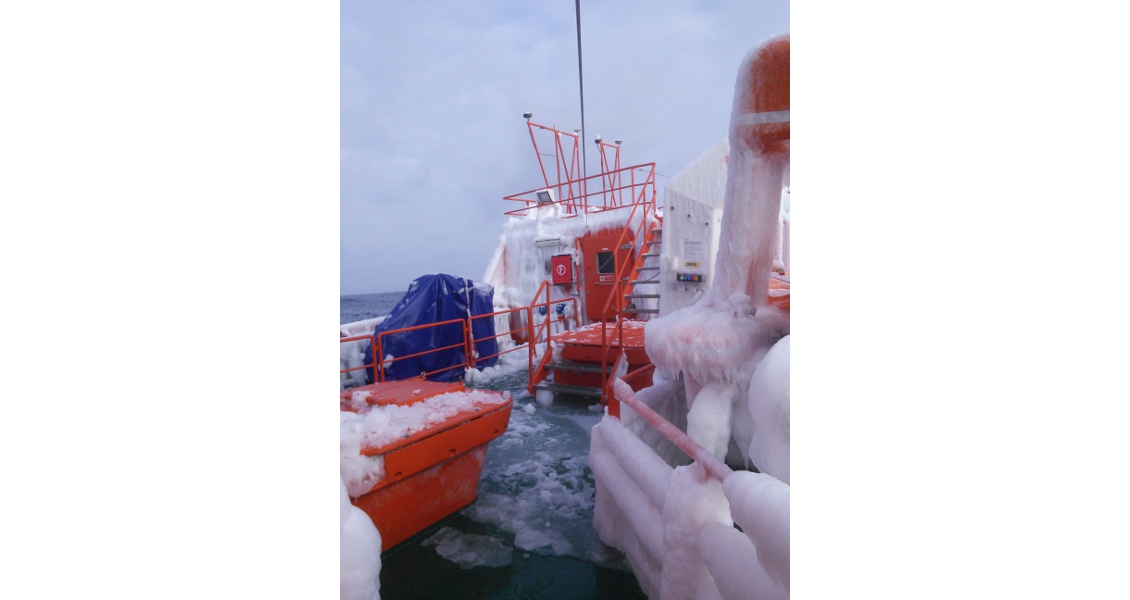
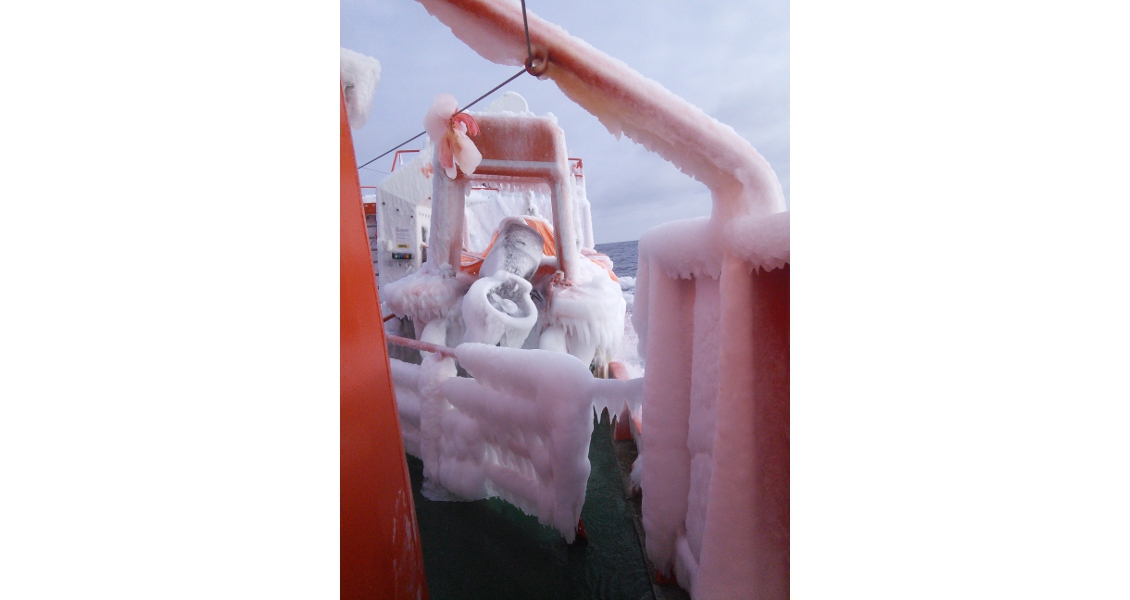
The Barents Sea – a challenging location for exploration. (Source: Arkex)
The Barents Sea – a challenging location for exploration. (Source: Arkex)