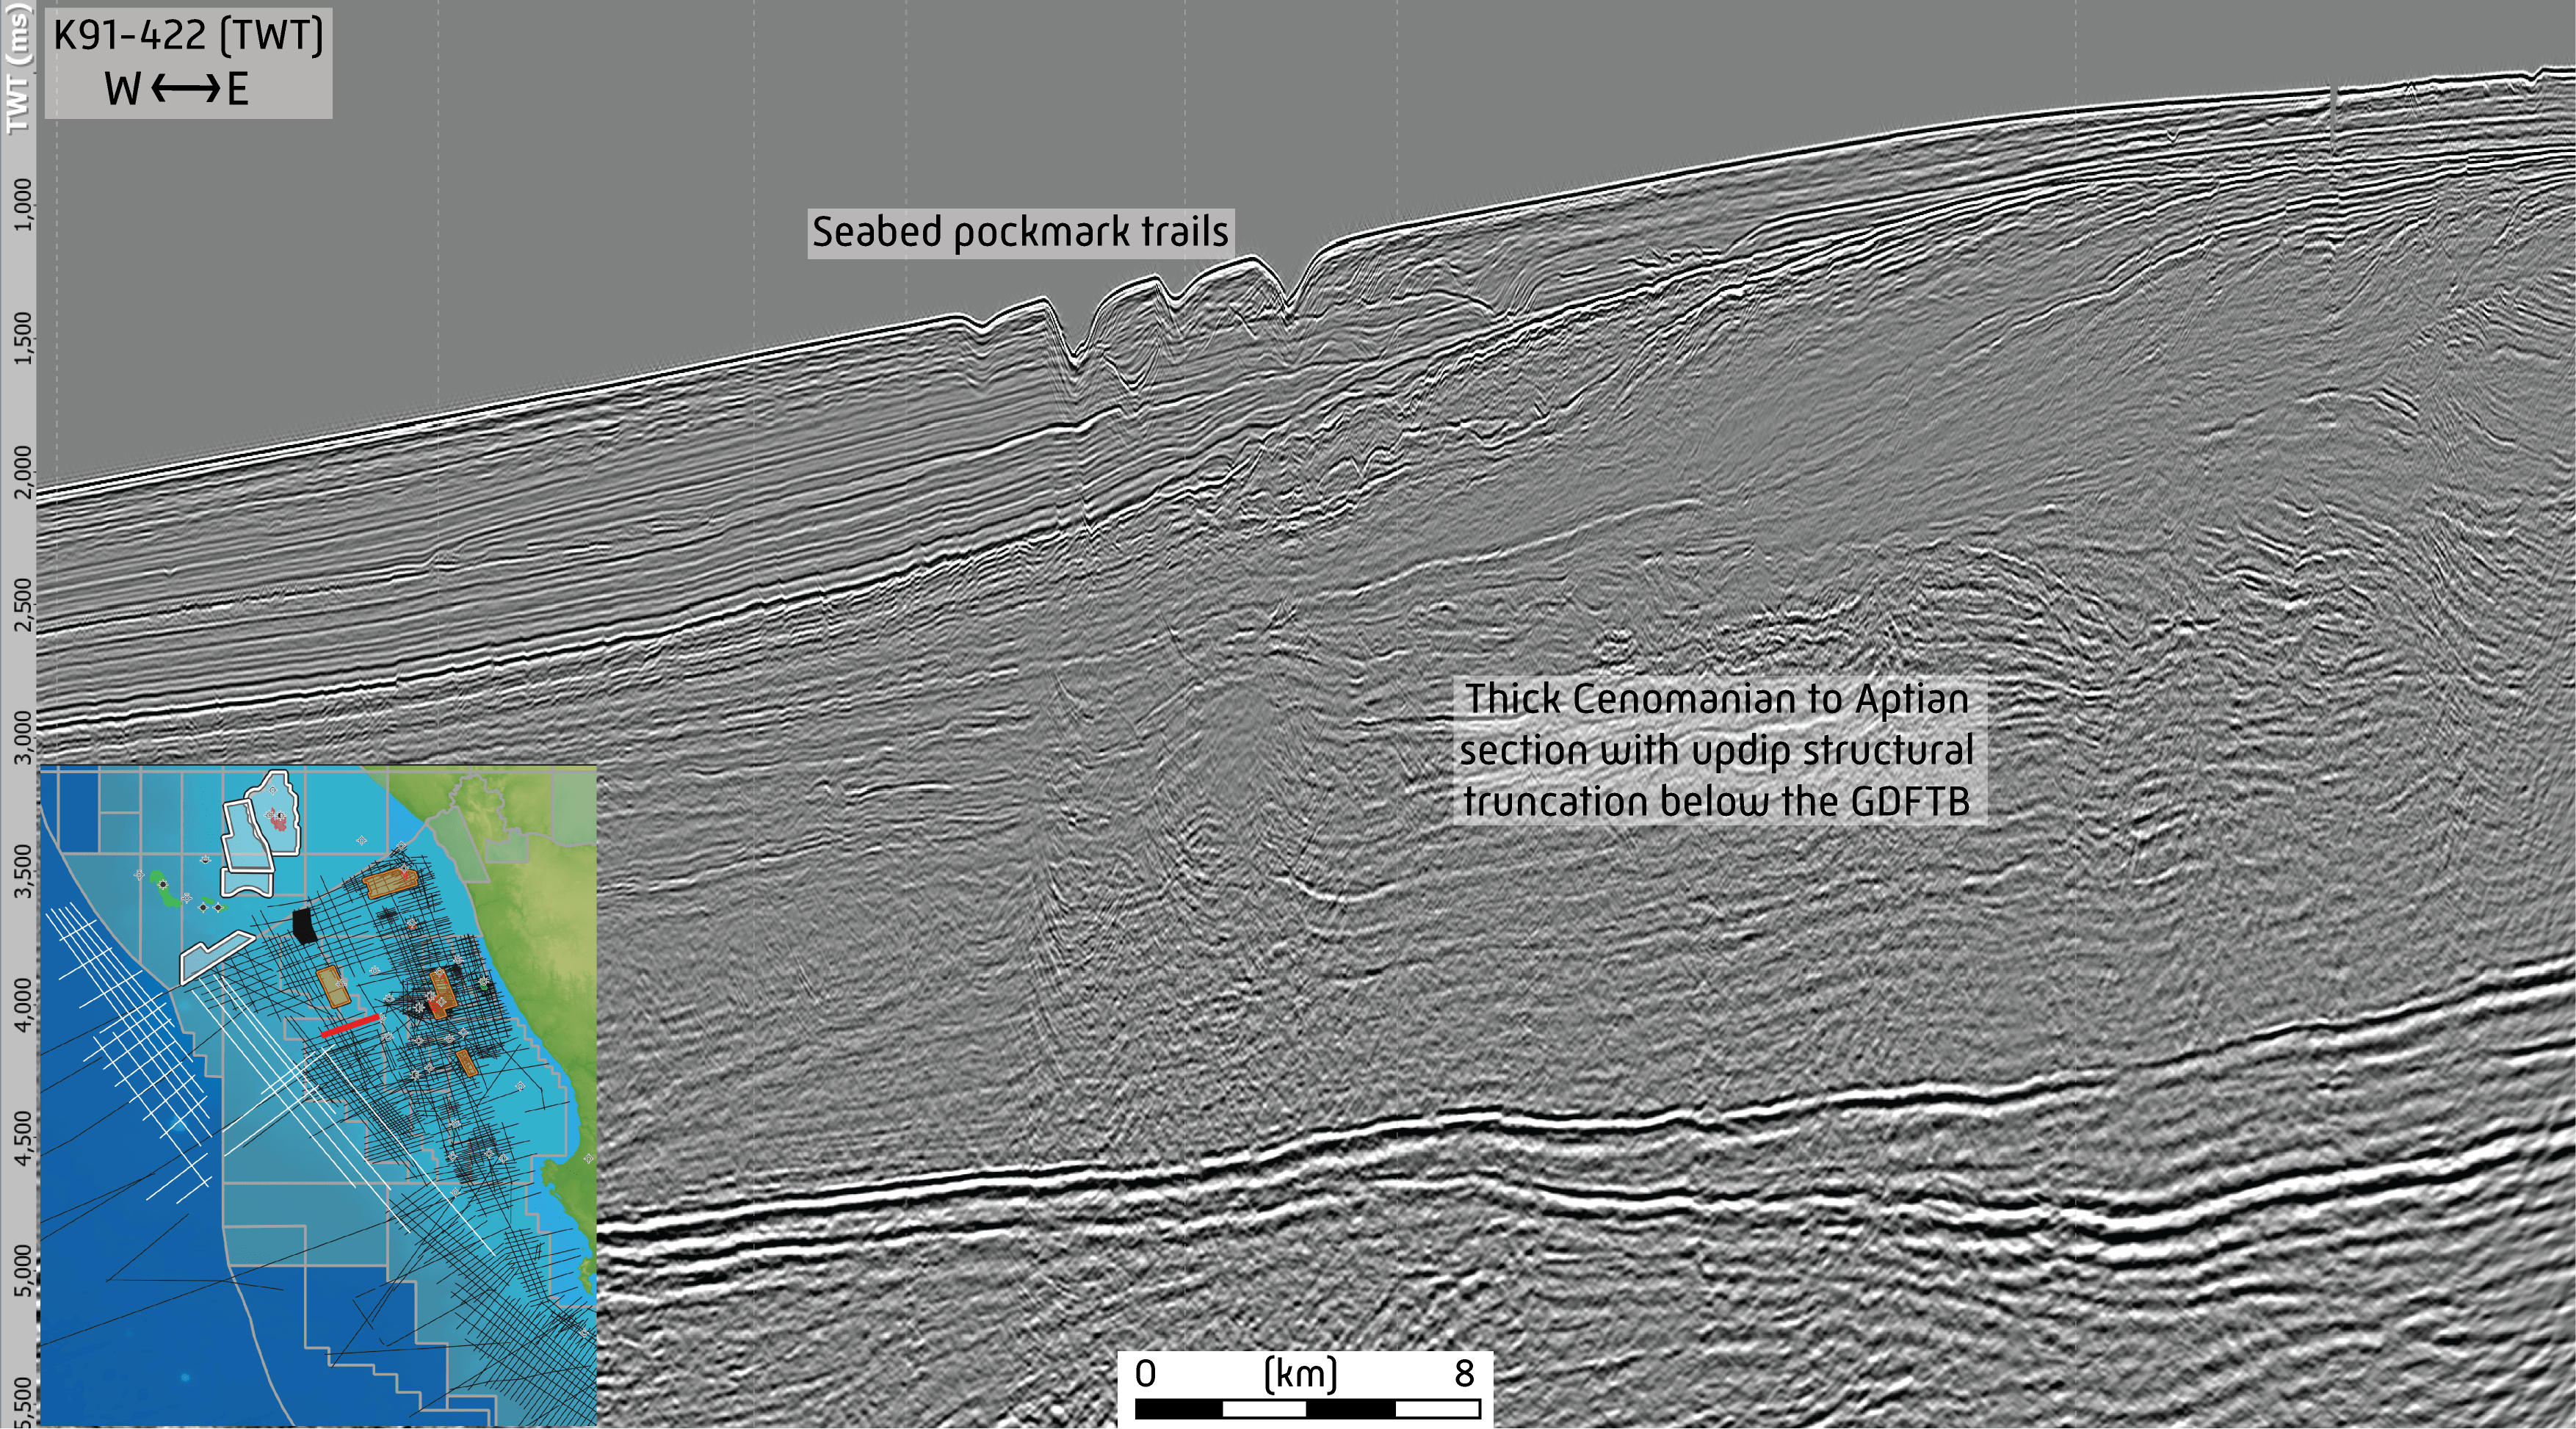
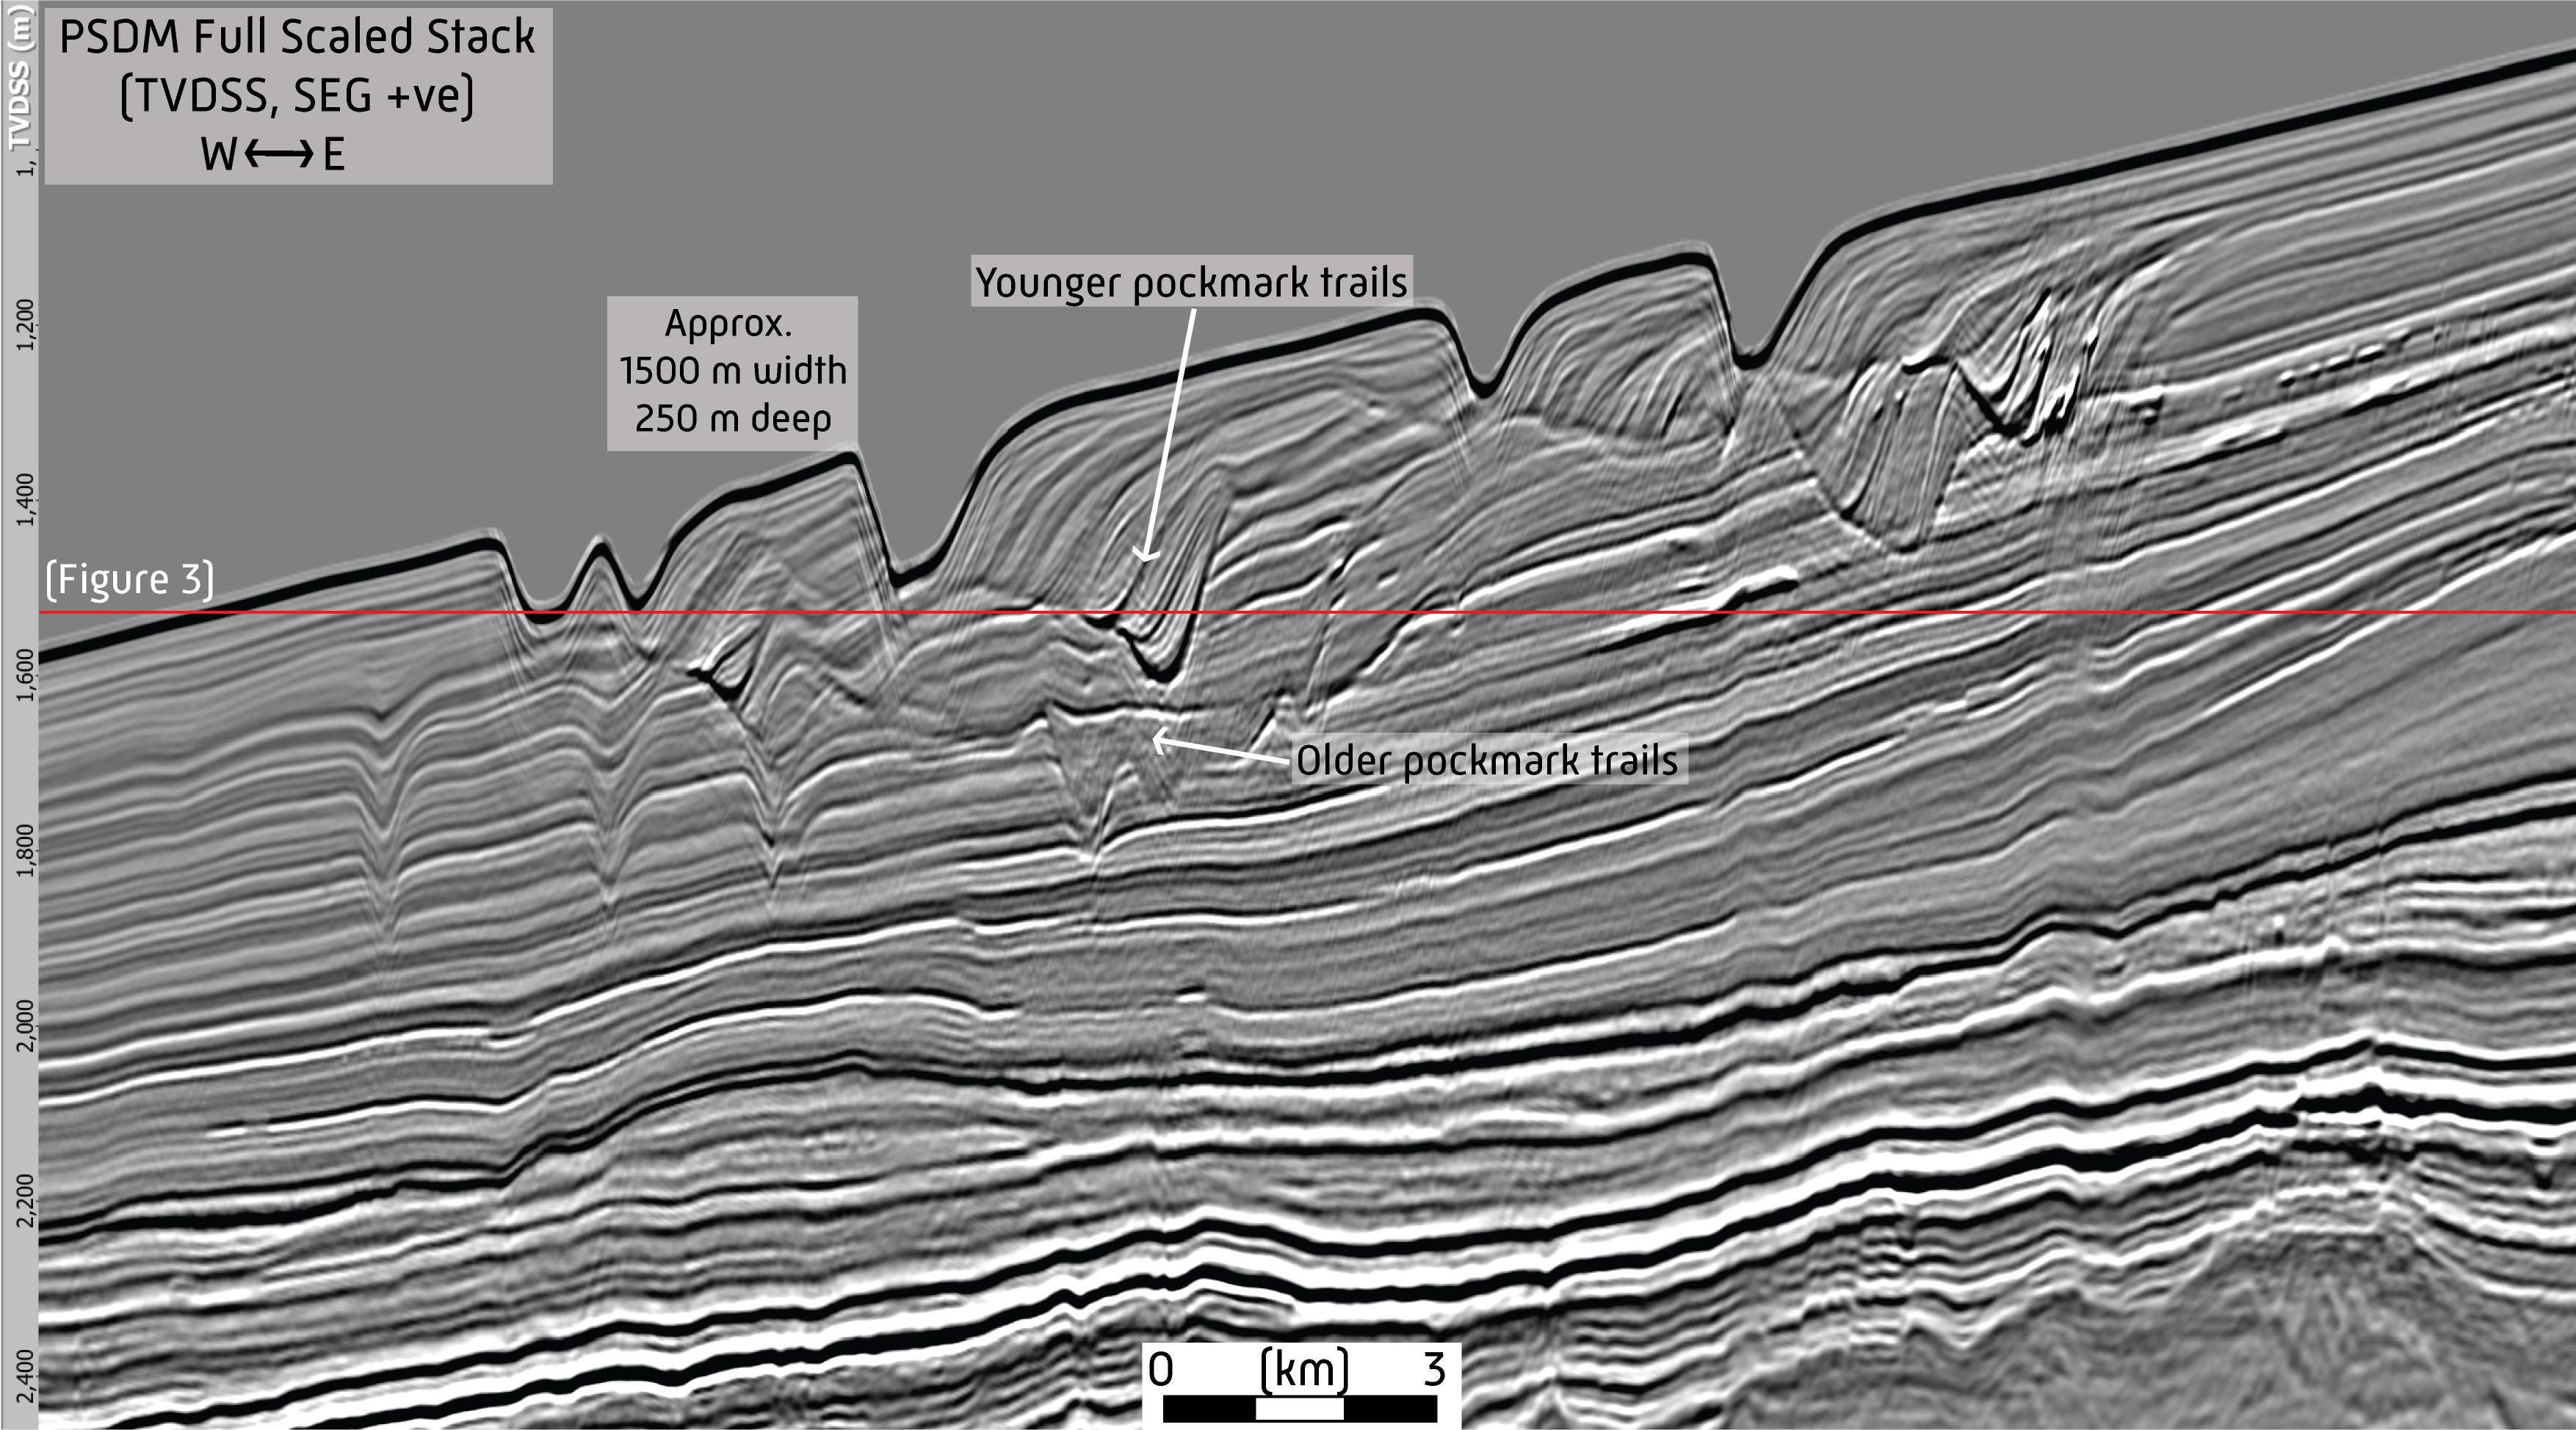
On any 2D dip line, we can see several almost triangular notches, divots or holes in the seabed, some 1.5 km in width and 250 m deep. Upslope, the divot wall is at a lower angle than the downslope face, which is truncated, and erosional. The upslope face is mirrored in the subsurface by a set of reflectors that extend to the same depth. Look for all appearances like prograding units marching back up the slope.
On 2D seismic, these features were initially interpreted as meandering slope channels, cutting into the seabed substrate and winding in and out through the plane of the section. The prograding units would be lateral accretion surfaces in this model. However, on 3D seismic these notches are almost circular to oval, and not connected to any slope channel features at all.
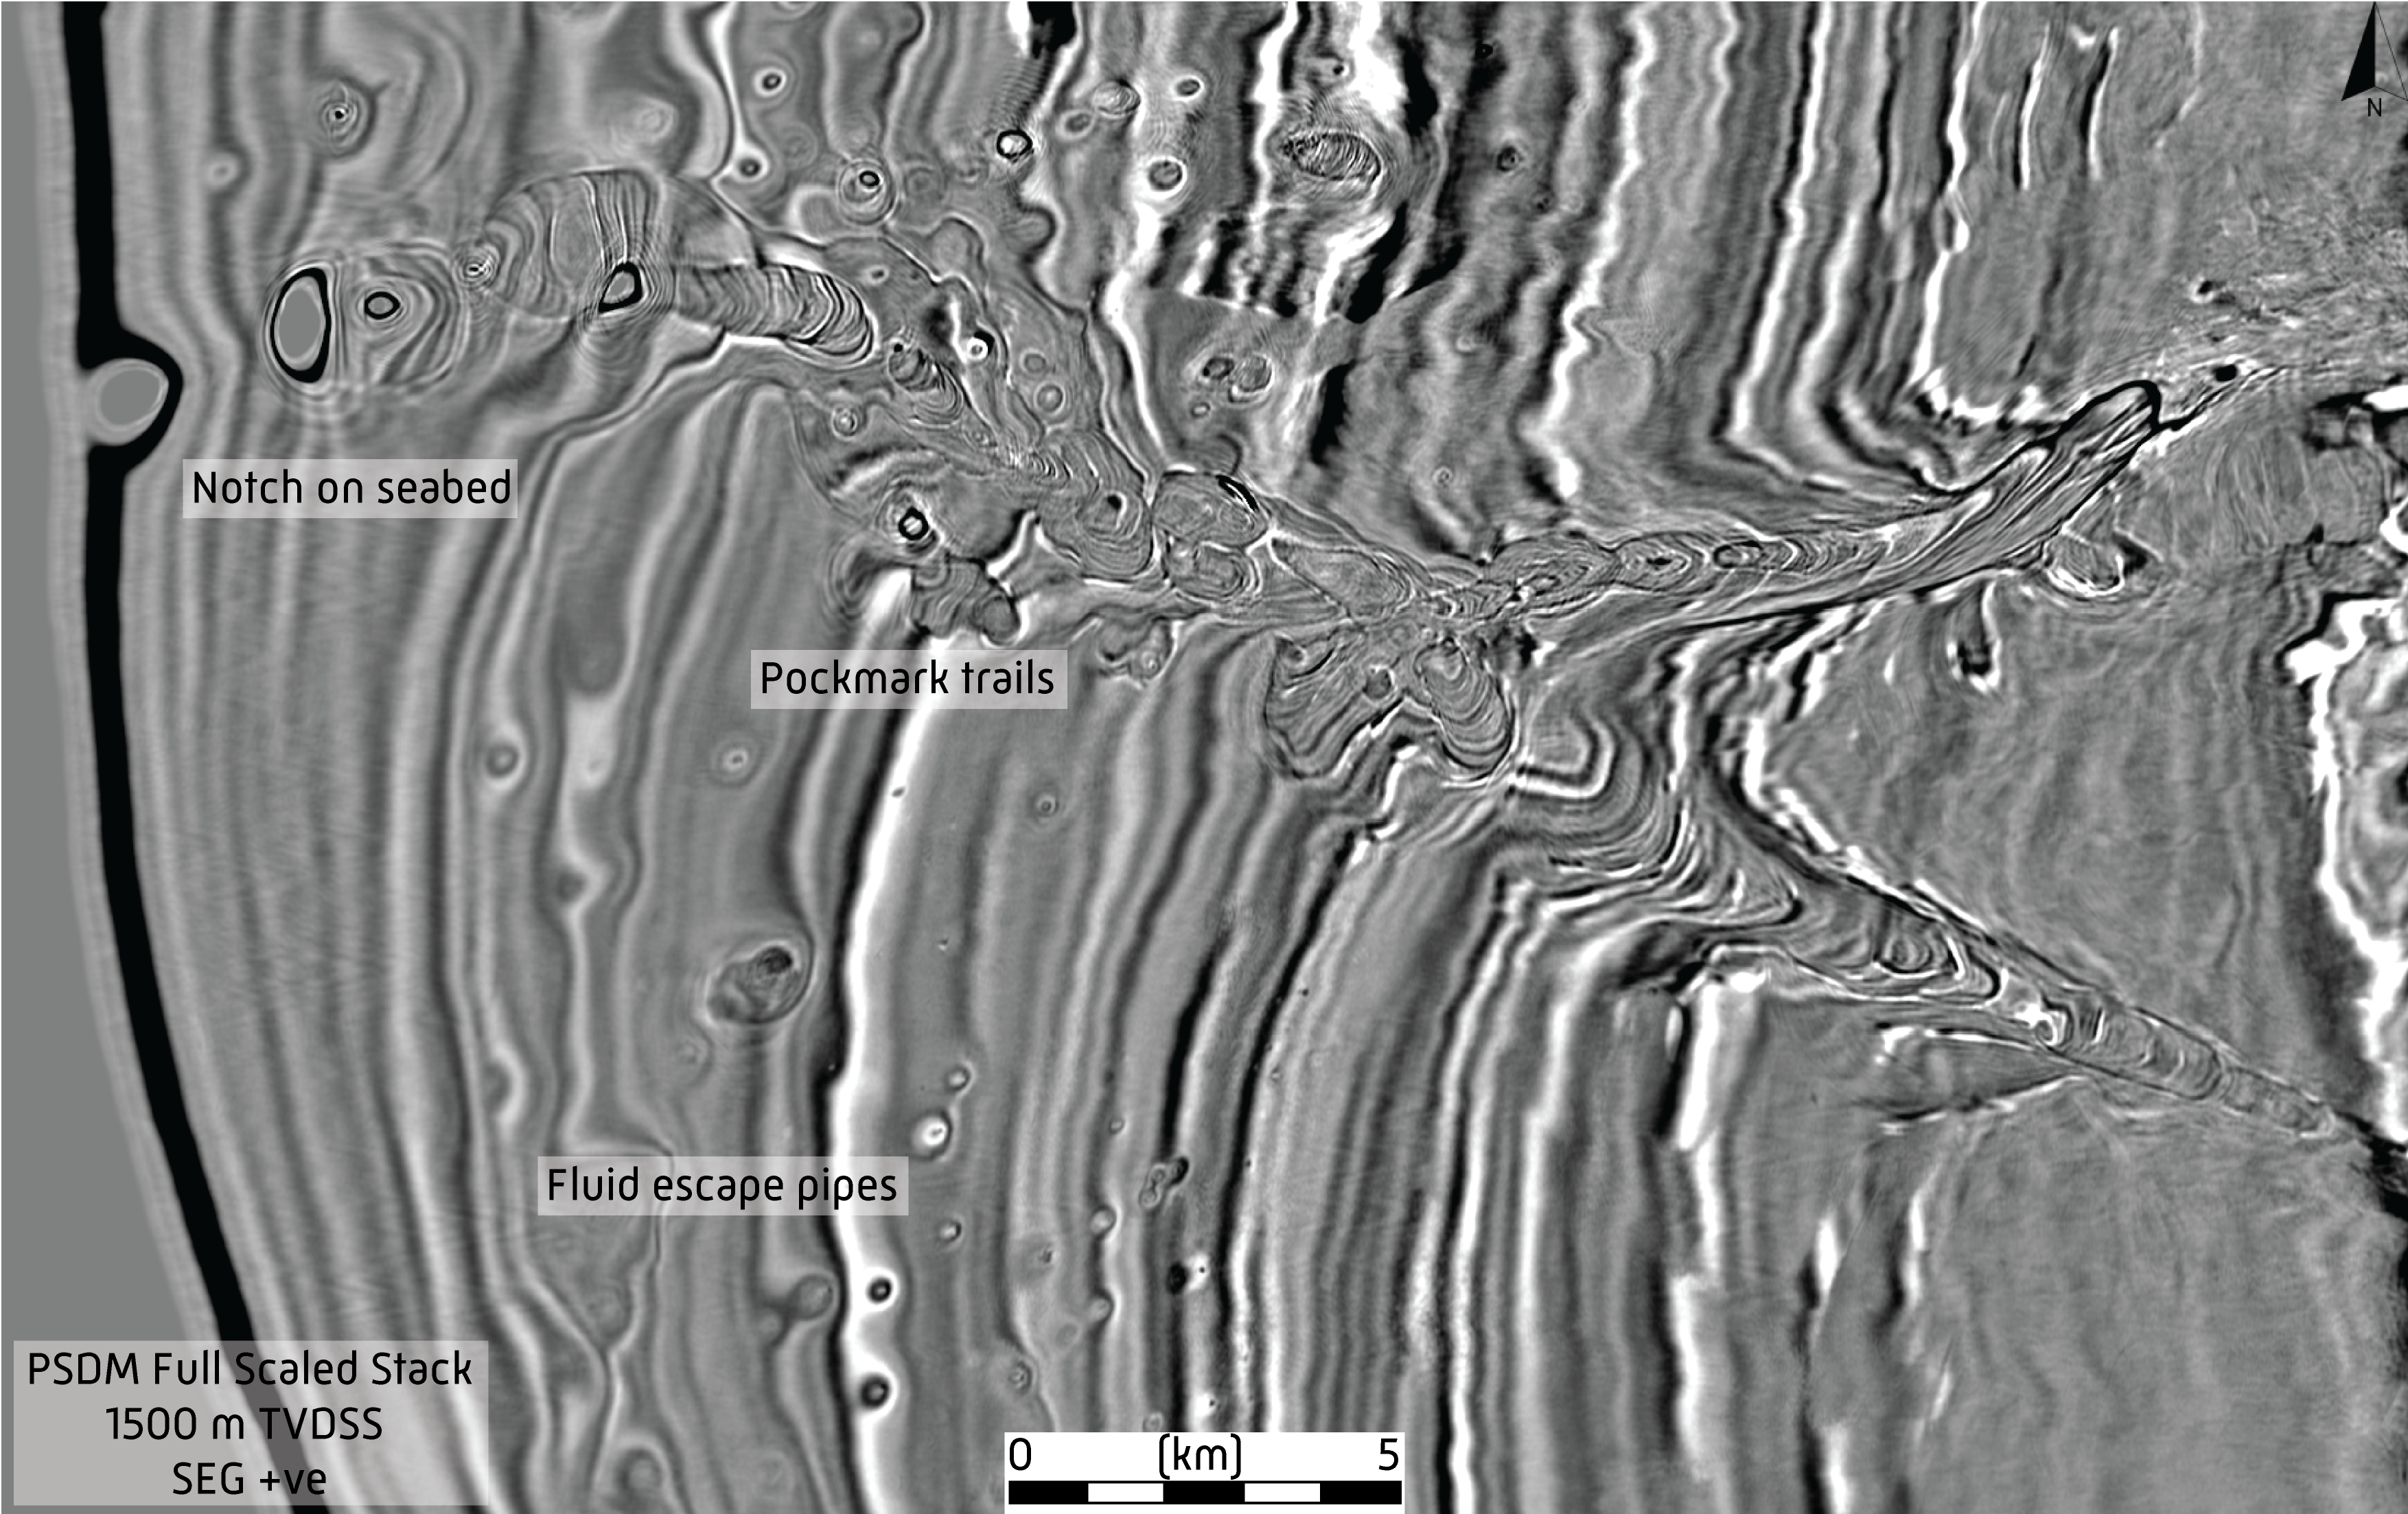
By taking a time slice we can see the relict circular to oval features, now sediment-filled, in addition to the long, thin trails extending through the top 200-300 m of the section (Figure 3, time slice marked on Figure 1). These trails run directly downslope (from east to west) and are as wide as an individual sea bed notch. The notches in the sea bed cluster in the west of the image, yet following the clinoforms to the east the trails stretch almost across the whole image. On the dip section of Figure 1, we can see that whilst to the west there is a recent set of these features, we can see another set, similar to these but older to the east. Whilst each notch in the sea bed has migrated from east to west (downslope), yet through time the start of the notch trails has also moved from east to west. So what mechanisms might drive these observations and, frankly, why do we care?
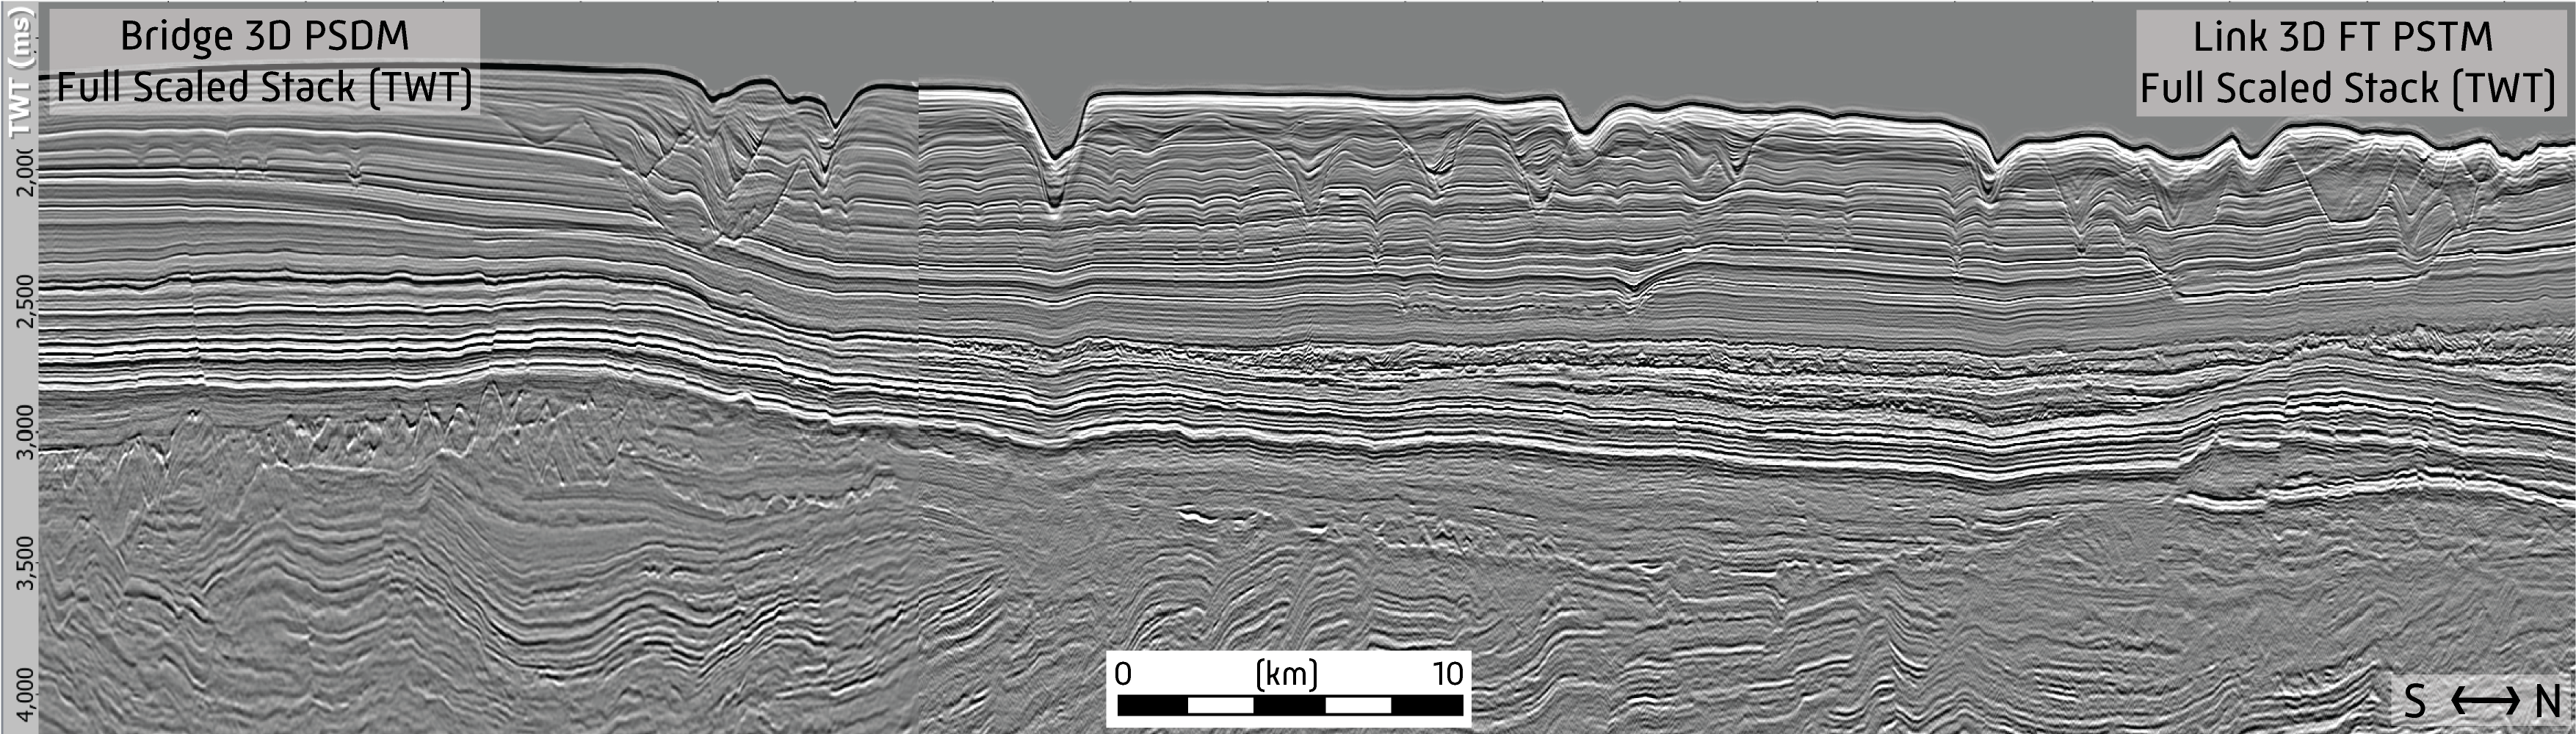
Before we stop making observations, one more. To the south on the time slice in Figure 3, one can make out a distinct 10 km west-east trending zone that shows thin circular disturbances, representing fluid movement pipes in the upper section. On the dip sections of Figure 1, there are several sets of these pipes. What each set has in common is that 400 m above the start of the visible pipe, they widen into a cone shape. The earlier pipes therefore have their sediment-filled cones preserved in the upper section, whilst the later pipes reach the modern seabed.
Fluid escape
These latter features indicate the importance of the migration divots. Of course, we are not the first to see these or indeed recognize their significance. In 2012, Satieng Ho, Joe Cartwright and Patrick Lubert published on migrating pockmarks from the Lower Congo Basin, reporting very similar observations of a similar phenomenon. The model that they derived was that fluid escape (either gas or oil) creates a pockmark in the sea bed, with currents – presumably holding sediment in suspension – running over the sea bed downslope either rapidly fill the pockmark or by a process of cut and fill, migrate the pockmark down slope, creating the pockmark trail. Repeated periods of pipe formation related to breaching a sealing of pressure cells.
Migrating source rock maturation
If we were to accept the pockmark model and make the leap that the location of the pipes and pockmarks are telling us something about a maturing hydrocarbon system below, then we might propose that earlier in the Tertiary, the Aptian source rock started to be effective further to the east, and then with time, this maturity became effective further west. This is consistent with the Tertiary clastic prism prograding east to west away from the shore, loading and presumably maturing the Aptian source as it went.
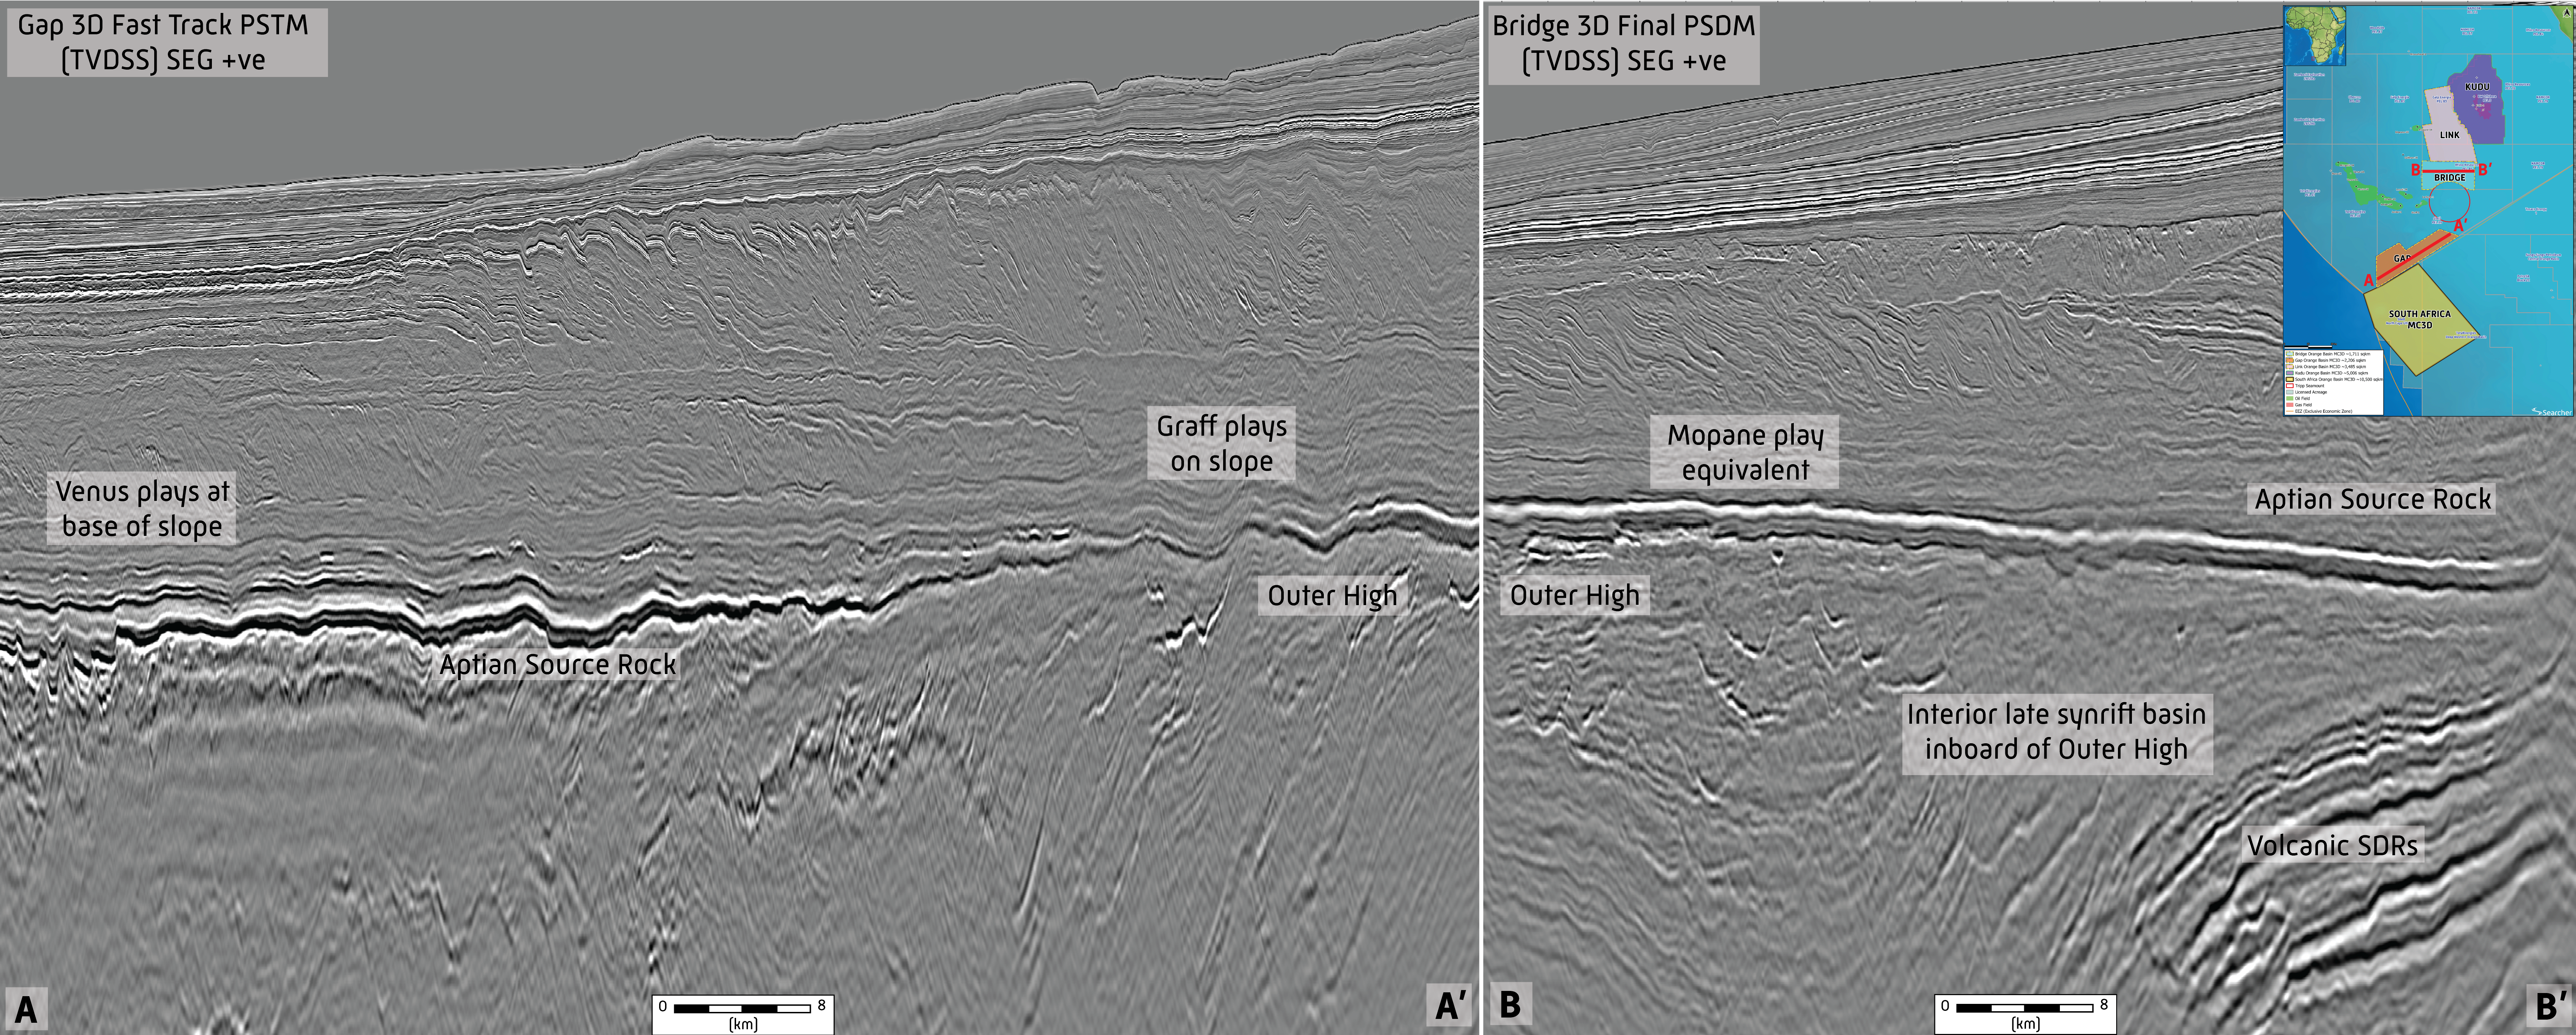
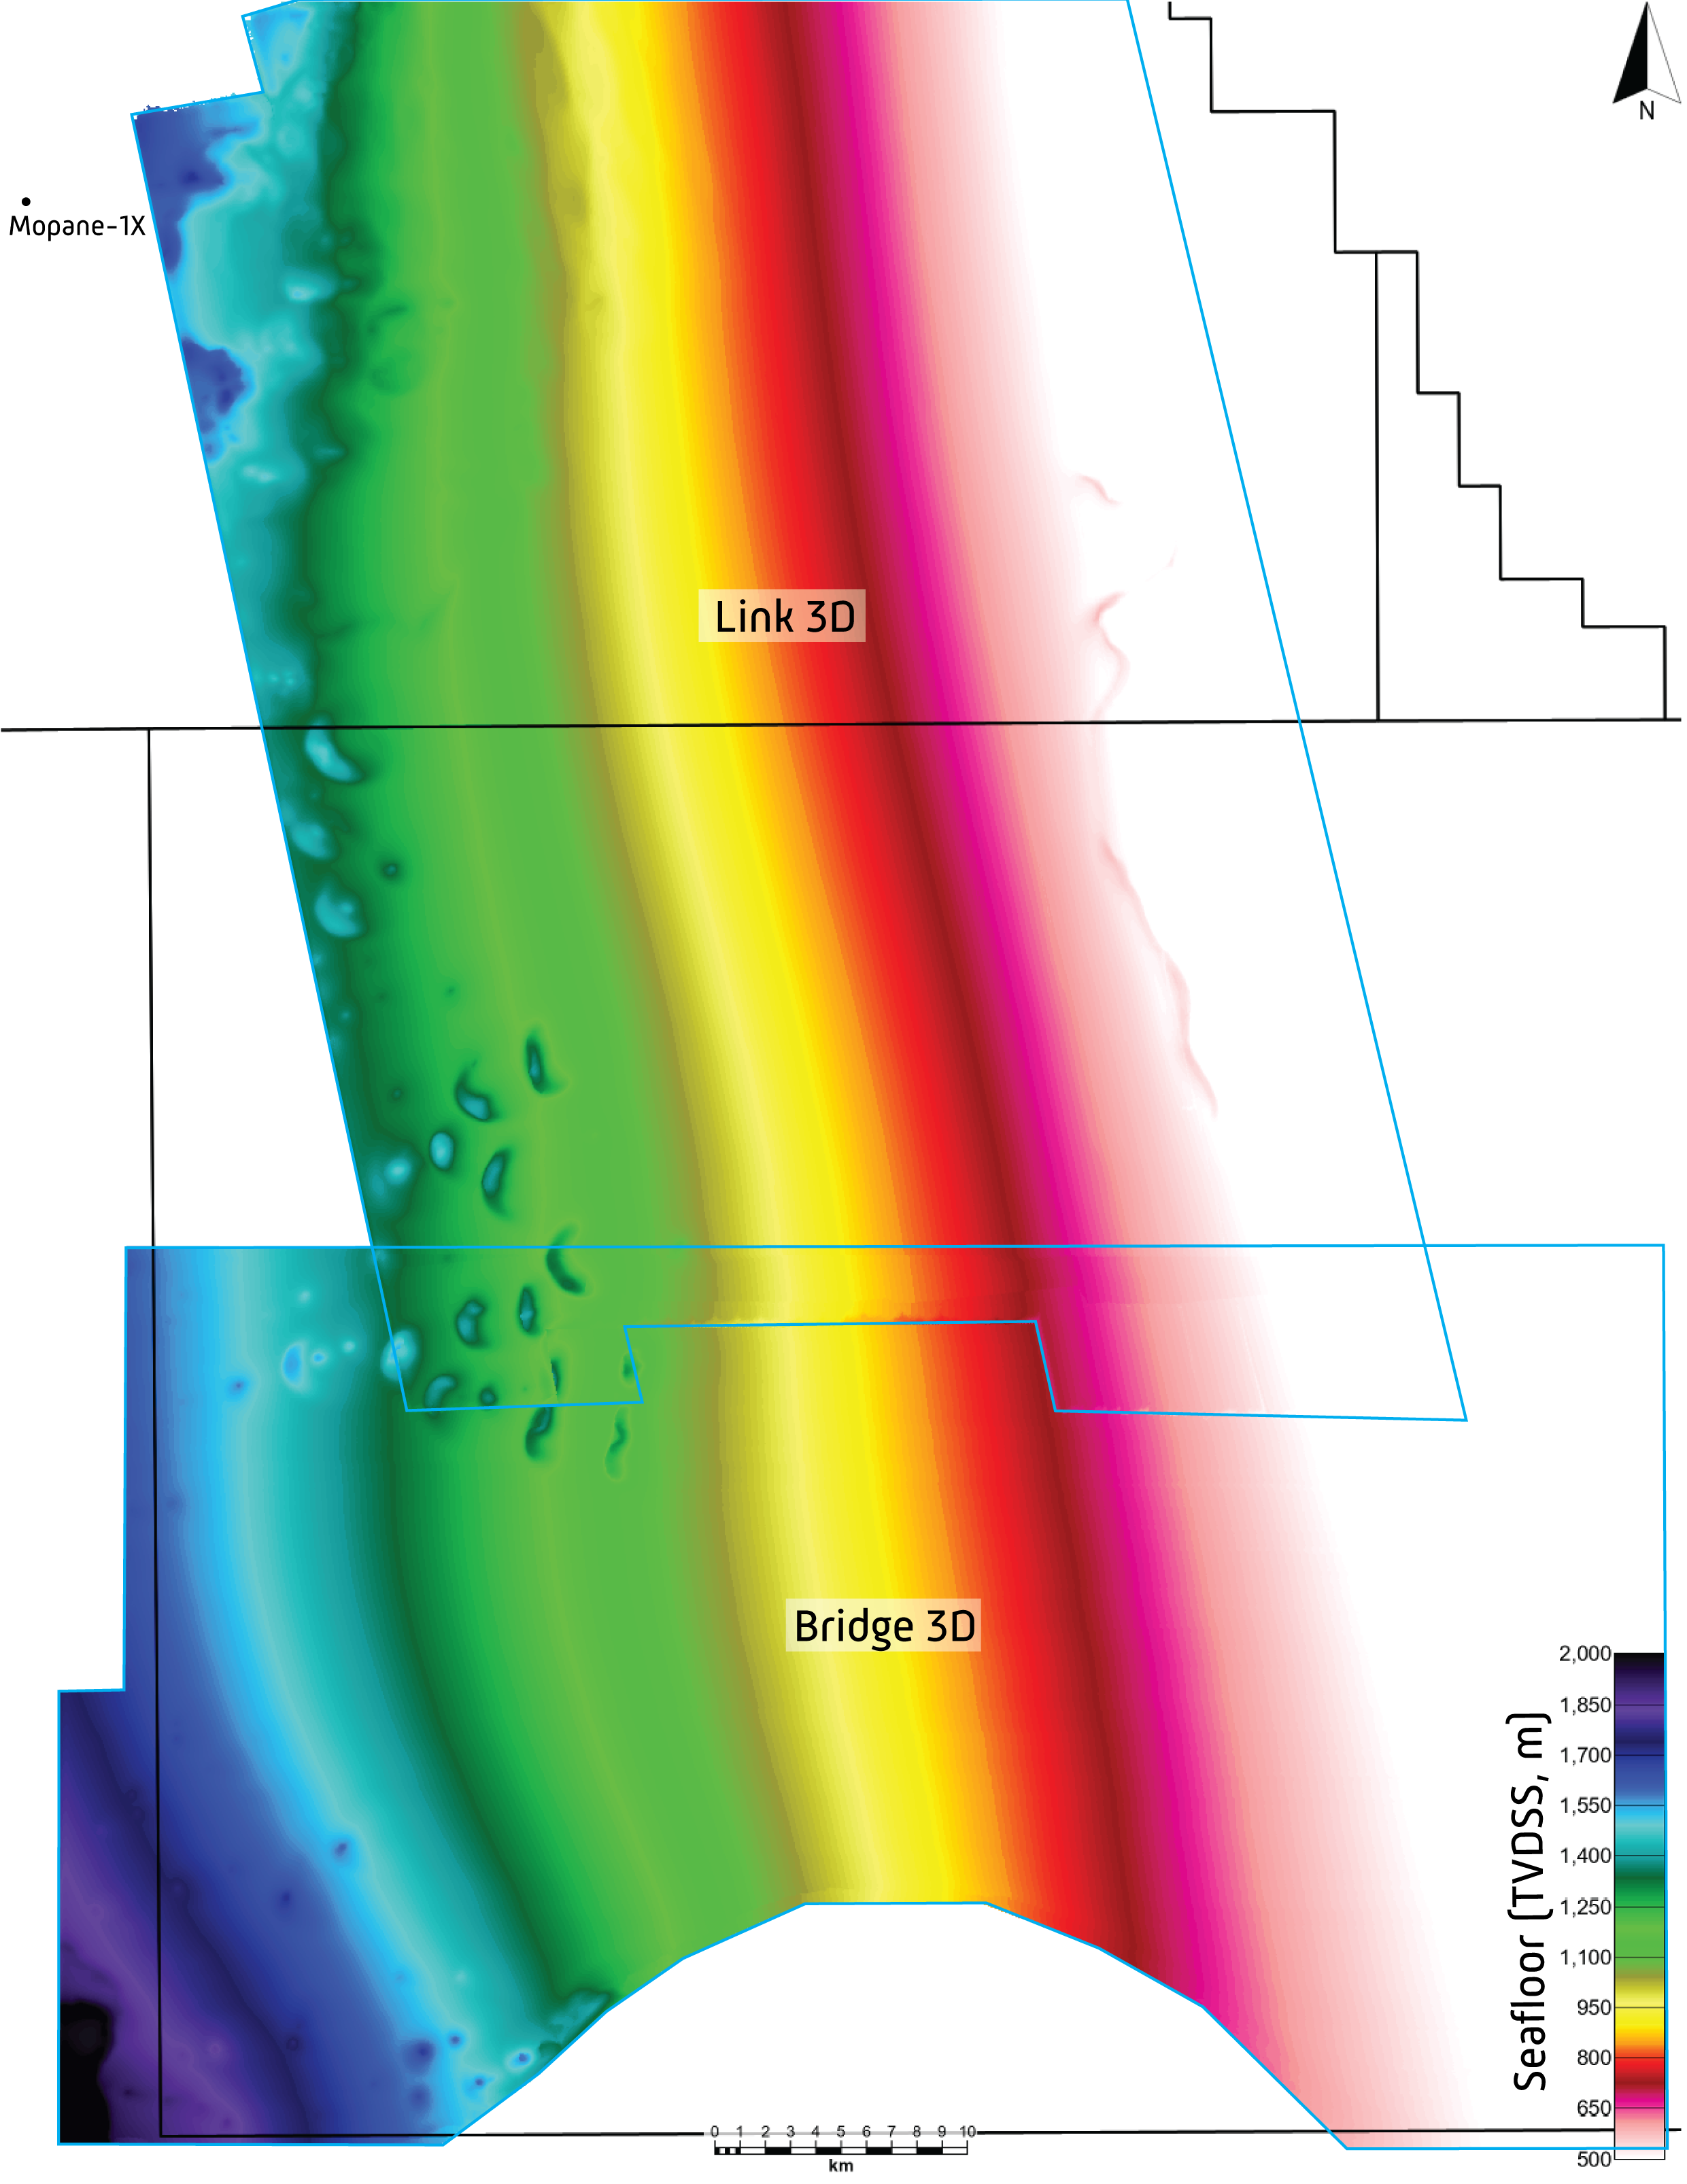
The implication is that even the Aptian across the whole Inner Basin is mature, at least for oil generation. The significance of this derives from the Mopane-1x and Mopane 2x discoveries drilled just to the north of PEL 85. Both discoveries are located inboard of the Outer High, so are not charged from the Venus discovery source rock to the west. Mopane-1X and 2x have encountered light oil accumulations.
When we look at the seabed over the area near Mopane-1X, utilizing Searcher’s 2022 multi-client 3D seismic over PEL’s 85 and 83, we see that the pockmark trail extends on a north-south trend up to close to Mopane-1x. This observation has been corroborated by sea surface slick identification around the Mopane discoveries, as reported on by Clément Blaizot. However, pockmarks and pipes at the seabed are seen virtually nowhere else (Figure 4).
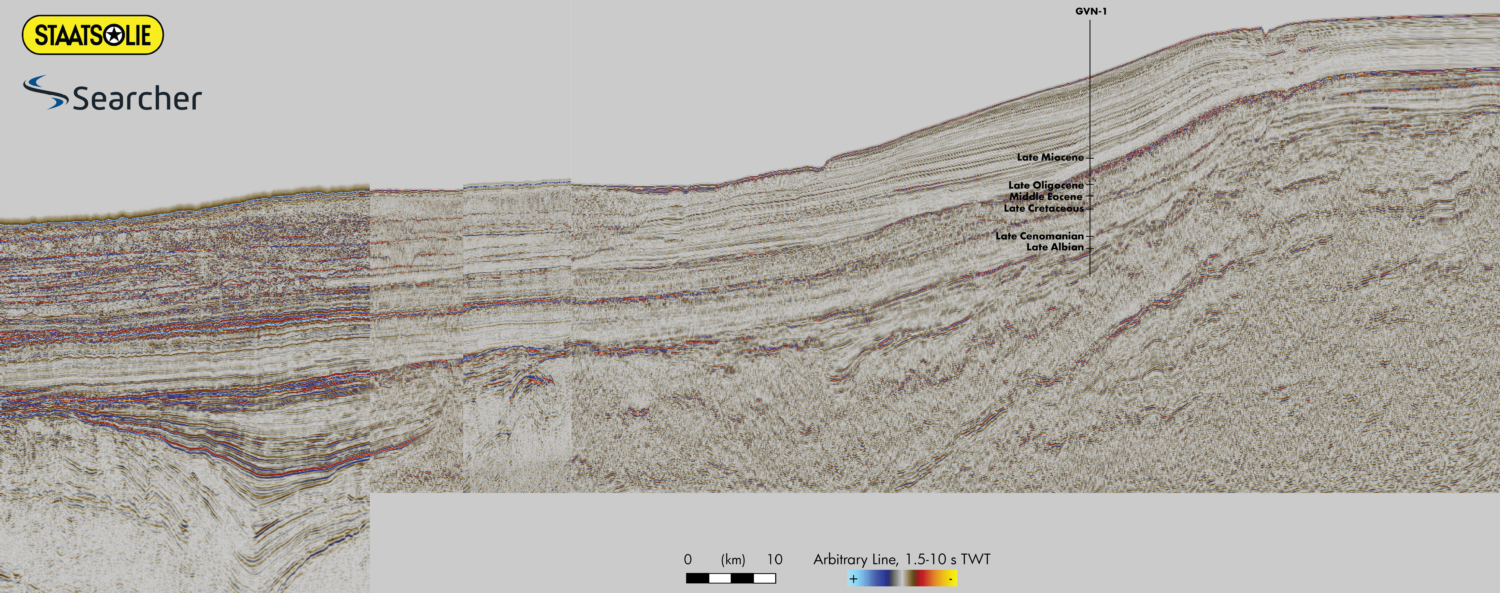
The keys to a new world
If the pockmarks are indeed telling us something about hydrocarbon maturity in the Aptian, then we can make second jump. The Inner Basin extends southeast from the PEL83 and 85 area in Namibia, and into South Africa’s Orange Basin. Here, on legacy 2D data, we see identical pockmark trails, and so, we believe this tells us something very exciting about the presence and effectiveness of the Aptian within the Inner Basin of South Africa (Figure 5). No wells have yet been drilled into the Inner Basin to test the Lower Cretaceous, but when such exploration occurs – it might be a great comfort to know that the Aptian is as mature there, unsurprisingly enough, as it is in Namibia’s Inner Orange Basin. As Sir Doyle may have remarked – “there are lots of obvious things that go unobserved – but some of them are the keys to a new world”.