Until recently, seismic velocities have had low value spin-off value as it was only used for migrating seismic data and depth stretching from time to depth domain in workstations. The vintage velocities were smooth and without much useful geological information.
However, that low-value status has changed. With the introduction of Full Waveform Inversion (FWI) techniques the details we can see, and the accuracy of the velocity data, are astonishing.
Over the past three years, TGS has processed vast volumes of 3D data along the Atlantic Margin alongside continuous R&D efforts on intra and sub basalt imaging with the valuable guidance of key clients and insight from partner VBPR (Volcanic Basin Petroleum Research).
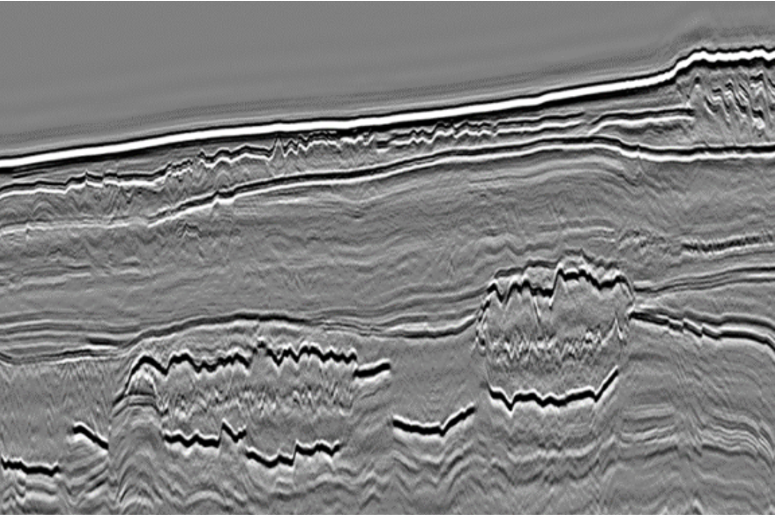
Using the latest 3D data, we are now able to interpret sub basalt targets, but most interesting are the details seen in DM_FWI velocities intra basalt. During the interpretation of these complex rocks, having the velocities overlain is key, as you can see in the image below. Now, slow, intermediate and fast trends define the volcanic facies. This comes handy when looking for porous flow tops basalt to store vast amounts of CO2 in. In addition, we cannot rule out trapped gas either within these super slow patches.

Another fascinating observation is the discontinuity of slowness anomalies scaled within 2-3km/s over the GRO discovery in the Norwegian Sea. If these slowness anomalies mean gas saturation or gas thickness as they appear on small-scaled anticlines – there’s real upside potential. There are also observe some very anomalous, structurally confined slowness anomalies deeper down within the Nise and Lysing FM levels, below GRO and down flank the Gemini well on the Fles fault complex.
When looking at modern seismic forward, never do so without the velocities overlain!
This story is based on a LinkedIn post from Bent Kjølhamar, TGS.