
Spectral decomposition methods are widely used to highlight geological features according to their frequency content. However, the frequencies characterising the targeted event might vary spatially, which complicates their extraction as 3D geological objects.
Generally, the picking of the frequencies representative of the targeted event is performed by selecting one specific trace directly from seismic lines. The picked frequencies may not be fully representative of the tracked object, which may reduce confidence in the process. On top of that, the spectrogram’s accuracy varies according to the spectral decomposition method and its parameters. All these limitations give rise to a high level of uncertainty and therefore risks.
COMBINING SPECTRAL DECOMPOSITION WITH GEOLOGICAL MODELLING
To assess geological targets, the traditional interpretation method consists of tracking the target object by scanning the seismic volume spatially and temporally (inlines/cross-lines vs time slices). However, a single object generally lies on several lines and geoscientists tend to have a hard time juggling spatial distribution in three dimensions.
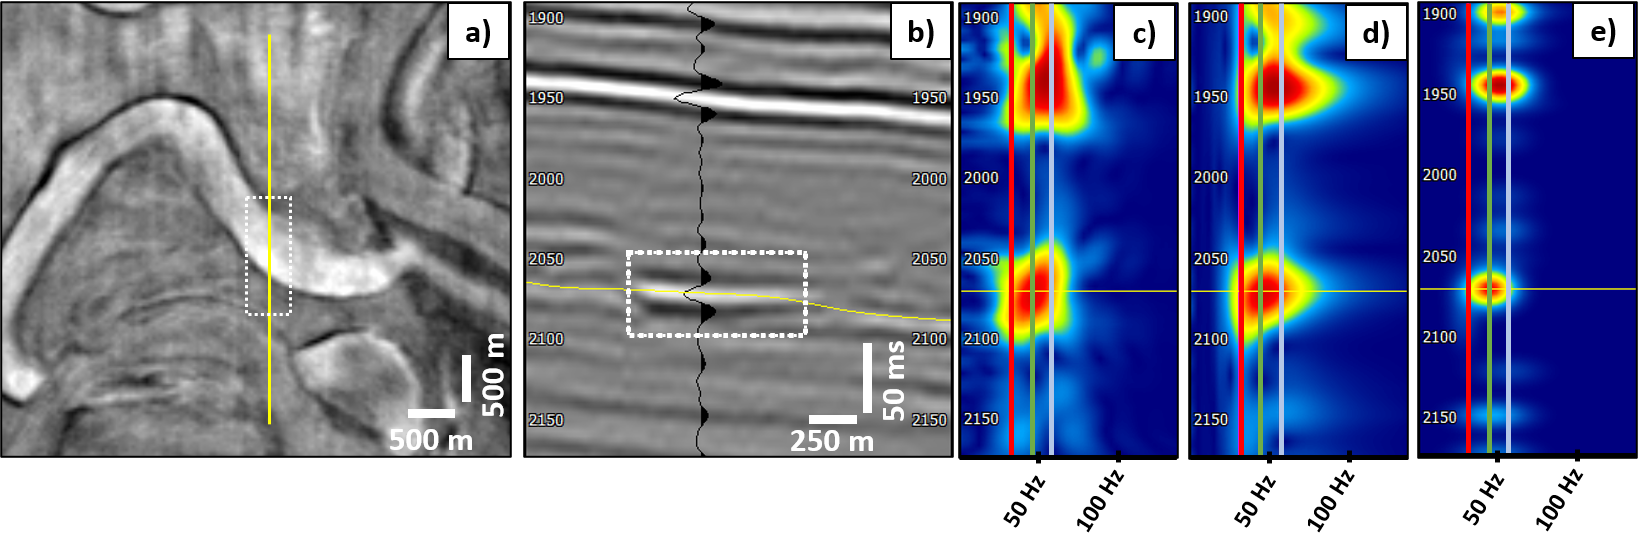
To overcome this issue, a Relative Geo-logical Time (RGT) model, where a relative geological age is assigned to each voxel belonging to the same depositional surface, can be calculated from a comprehensive seismic interpretation method. Seismic amplitudes and derived attributes are mapped on a dense stack of isochronous surfaces extracted from the RGT model, allowing an interactive scanning of the seismic data and, thus, facilitating the spectral signatures emphasis and subsequent 3D delineation of the targeted object. Finally, this high density of horizons enables a thorough selection of the tracked object’s most representative frequencies (Figure 1).
IDENTIFICATION OF TURBIDITE CHANNELS
The three spectral decomposition methods have been applied to a turbidite system from the MAUI dataset located offshore New Zealand in the Taranaki Basin. For this dataset, the visualisation of the turbidite system is challenging because of entangled geometries. The 32Hz, 45Hz and 57Hz frequencies were selected to display an optimum contrast for revealing the geometrical details and features of the sedimentary system such as the contour, thickness and connectivity of its constitutive elements.
A vertical window of 21ms is performed for the STFT and Morlet wavelets are used for the CWT and MP algorithms. The frequency-decomposed amplitudes are mapped into a red-green-blue viewer (Figure 2). The low-vertical resolution of the STFT and the CWT displays the energy of the stacked channels on more horizons than the MP. As a consequence, multiple events can overlap, which creates uncertainty with regards to the independent delineation of individual channels. In turn, this can lead to wrong volumetrics estimations.
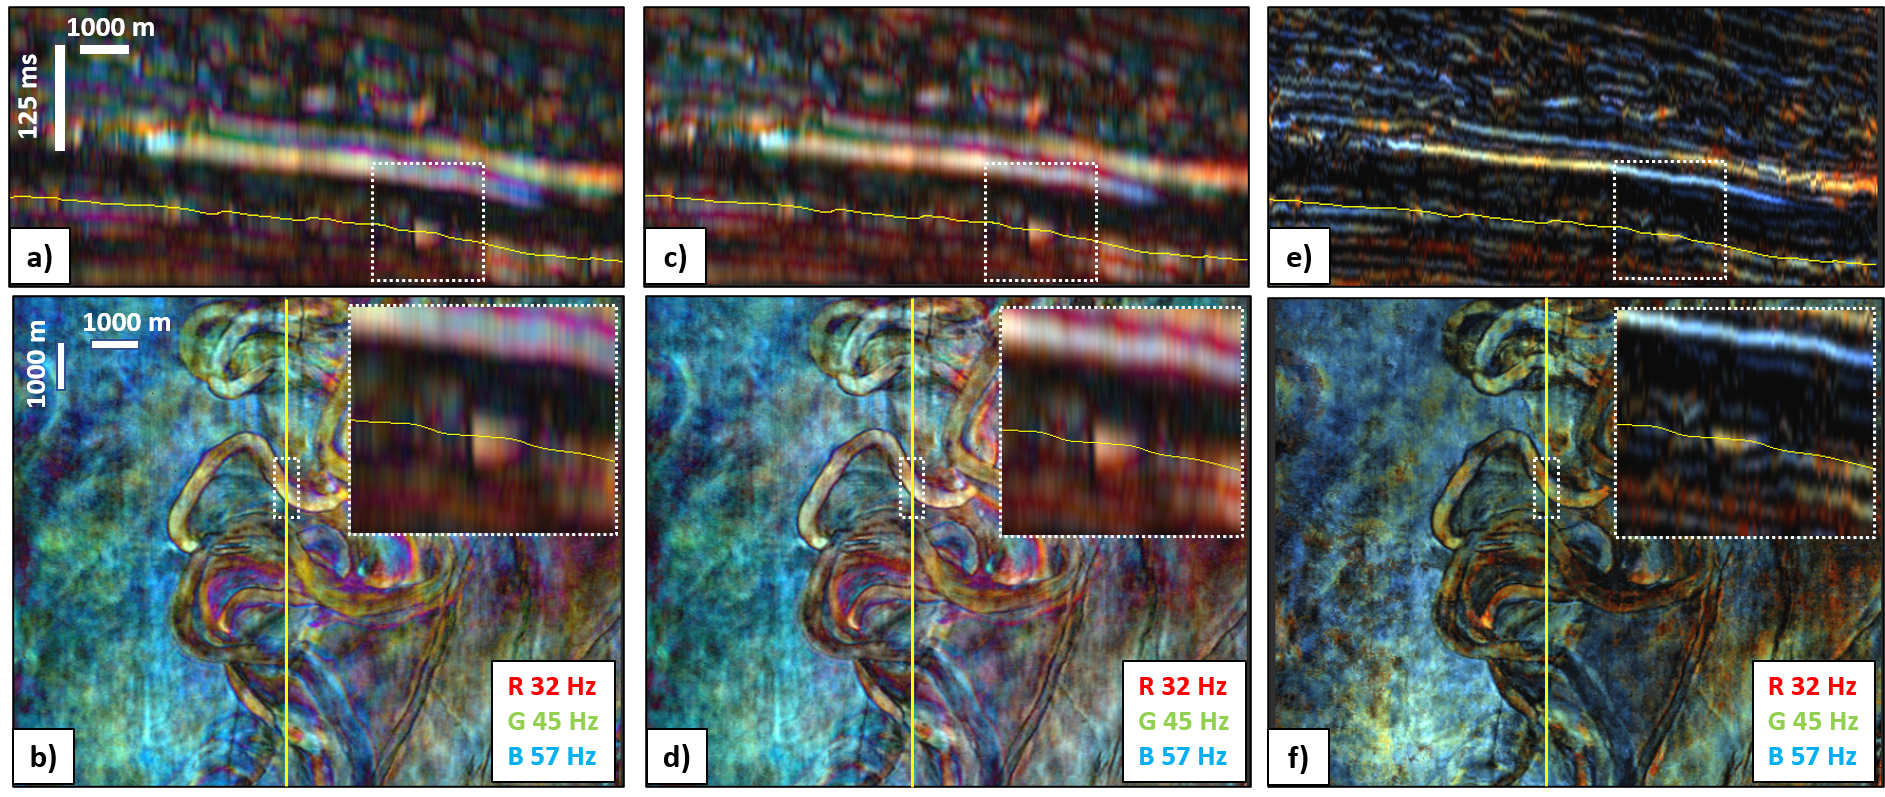
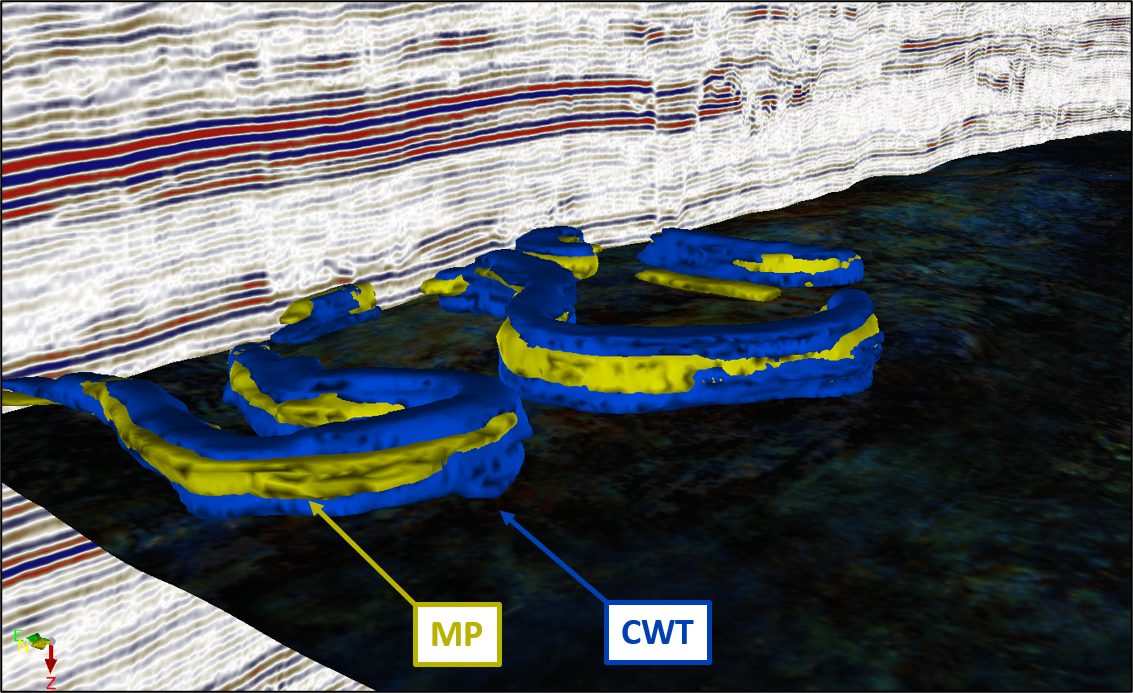
Thus, the high vertical resolution of the MP combined with the high number of horizons extracted from the RGT model enables a better delineation of geological objects, improving their modelling and then their interpretation (Figure 3).
SPECTRAL DECOMPOSITION ALGORITHMS
The Short Time Fourier Transform (STFT) and the Continuous Wavelet Transform (CWT) are the main spectral decomposition algorithms used for seismic interpretation.
STFT method consists of performing a Fourier transform inside a sliding window, implying a time-frequency resolution dependent on the window length. Indeed, the larger the sliding window, the greater the frequency accuracy will be. However, this is at the expense of vertical resolution. Reciprocally, the smaller the sliding window, the greater the vertical resolution will be. In this case, a loss of frequency resolution takes place.
The CWT convolves the seismic signal with different compressed-dilated wavelets, allowing a multi-resolution analysis of the signal, not available with the STFT. It generates high temporal resolution at high frequencies and high-frequency resolution at low frequencies.
MATCHING PURSUIT IMPROVES SEISMIC INTERPRETATION
Matching Pursuit (MP) is a third method that offers better temporal as well as frequency resolutions compared to the STFT and the CWT (Figure 1 c-e). Its resolution is similar to seismic data, but its iterative process lengthens the computation time. Indeed, each seismic trace is decomposed in a linear combination of wavelets that locally match the seismic data. The best wavelets are identified by correlation in varying their frequency, phase, scale and time delay. The high-resolution accuracy of the MP combined with the horizons generated from the RGT model results in the emphasis on geological feature delineation.
For the tree methods described above, a spectrogram can be computed along a trace chosen from the interactive scanning of the seismic lines and the dense isochronous surfaces obtained from the RGT model. The spectrogram corresponds to the trace time-frequency spectrum and helps pick the most representative frequencies of the tracked geological object. Once the iso-frequency volumes are computed, they can be blended in a Red-Green-Blue (RGB) viewer and mapped on the dense stack of horizons for further analysis.
LEVERAGING THE RGT MODEL TO GUIDE MATCHING PURSUIT
In addition to being time-consuming, the Matching Pursuit method is sensitive to small changes in seismic amplitudes, leading to lateral discontinuities in the extracted iso-frequencies. To solve this issue, the lateral coherence of seismic traces can be used as a constraint during the decomposition.
Indeed, by assuming that the waveforms along a reflection are continuous to a certain extent, a 3D structural constraint is added to the Matching Pursuit decomposition through the use of the RGT model. From a picked seed trace, wavelets are extracted using the Matching Pursuit and iteratively propagated laterally along the RGT model iso-values to reconstruct seismic reflectors (Figure 4a).
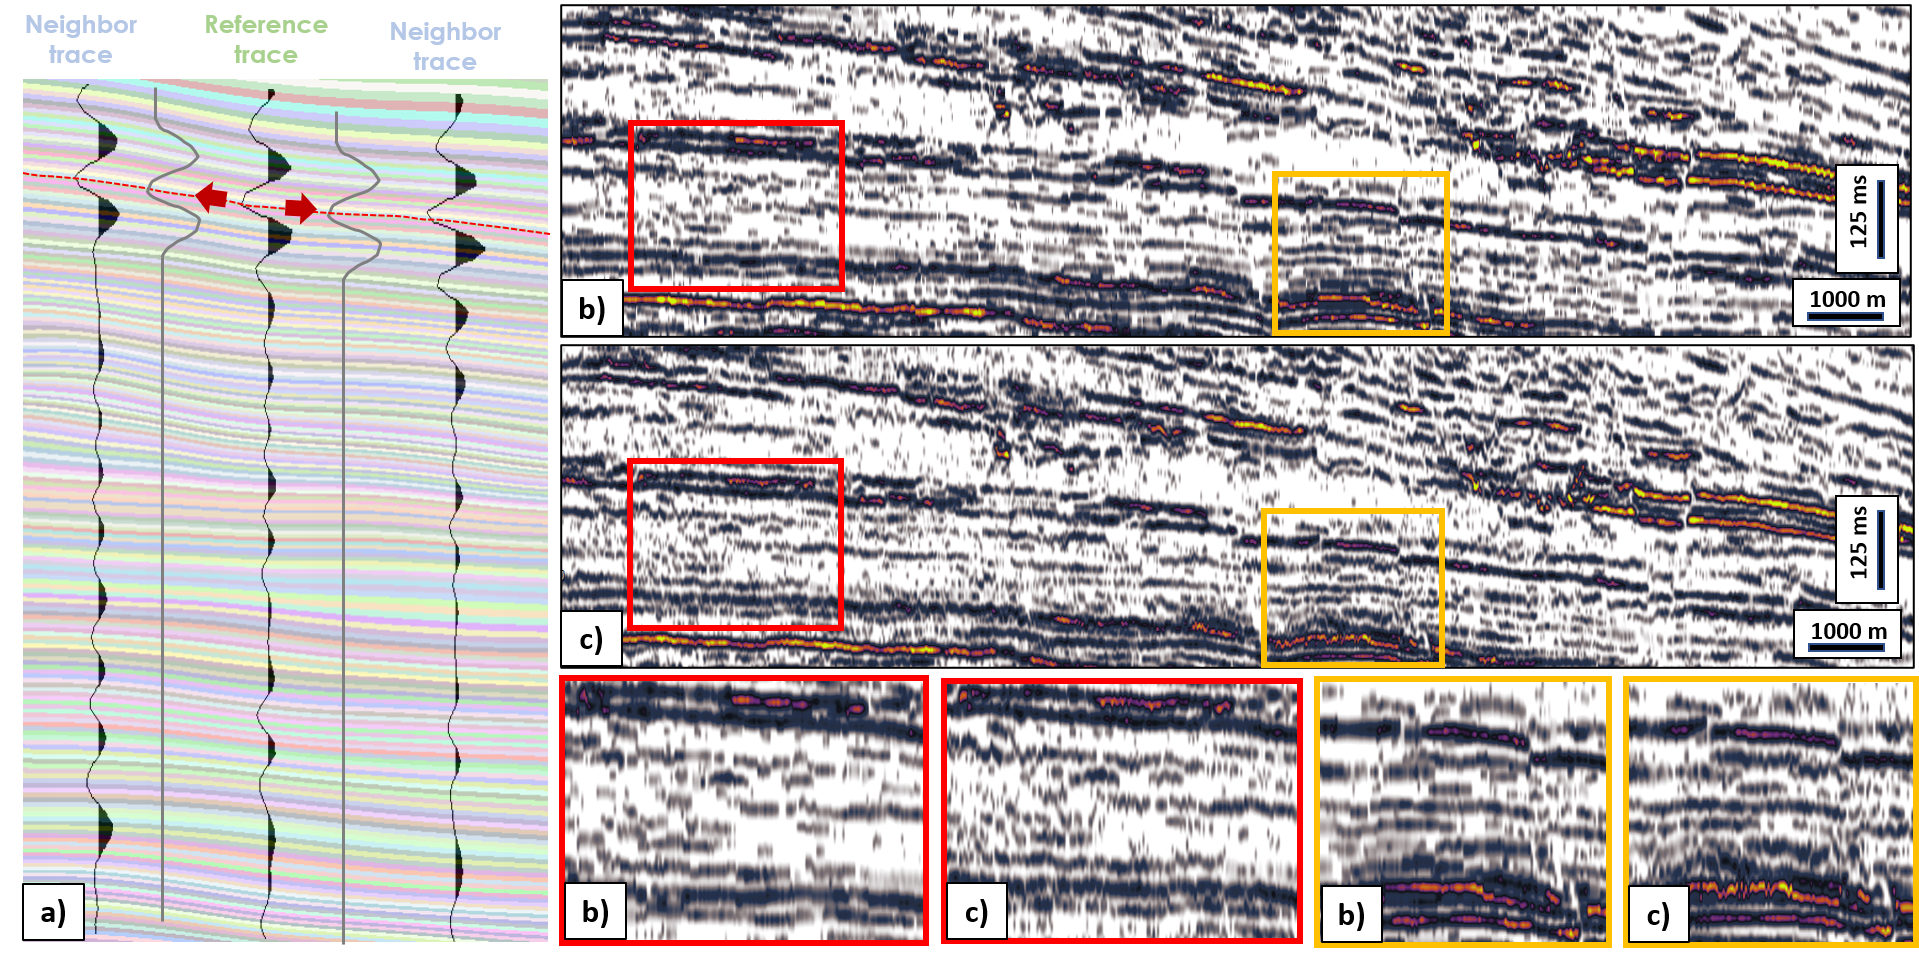
The RGT model helps identify at which time the wavelets need to be propagated and extracted to the neighboring traces. The waveforms along a seismic reflection change progressively when moving away from the trace where the wavelet has been extracted. Consequently, the propagation of the extracted wavelets must be stopped when the waveforms on the neighbouring traces are too different from the initial wavelet.
In summary, the method described here avoids going through the computation-heavy and time-consuming Matching Pursuit process where each trace is processed independently. In addition, the extracted iso-frequencies are less sensitive to noise and are more geologically consistent with better lateral continuity (Figure 4b & 4c).
ACKNOWLEDGMENTS
The presented workflow was obtained using PaleoScan™, software developed by Eliis. The authors would like to thank New Zealand Petroleum & Minerals and the New Zealand government for their permission to use and publish the MAUI dataset.