An image-based approach for identifying pores and particles in unconventional reservoirs for planning carbon dioxide-based enhanced oil recovery and associated storage (CCS).
The capture of carbon dioxide (CO2) from industrial sources and subsequent injection of the captured gas into geological formations for permanent storage has been identified as a potential means of mitigating climate change. Improvements in directional drilling technology and hydraulic fracturing of organic-rich shales and other tight rock formations have opened new opportunities for CO2-based enhanced oil recovery and associated CO2 storage. As a result, shales previously viewed mostly as CO2 storage seals for conventional geological formations are now considered as an emerging potential CO2 storage resource. The CO2 storage potential of shales, especially those that are rich in organics and clay minerals, can be quite high given the CO2 sorptive capacity of organic matter (OM) and clay minerals. In addition, pore space and induced and naturally-occurring fracture networks create opportunities for free phase CO2 storage.
Image Analysis-Based Approach
Characterisation of key features of interest such as pores, fractures, OM and clays in unconventional reservoirs can be challenging because of the scale. Traditional lab techniques are often unable to detect or quantify these nano-size features of interest; however, comprehending their occurrence and their relationship to each other is important to understanding fluid flow, potential sorption sites and void space volumes. Standard laboratory methods of investigation continue to be important tools in the characterisation of these unique rocks, providing the data used in making assessments related to all facets of operations. The key is to enhance and complement these methods with new tools in order to extrapolate data with greater efficiency and at different scales. In this case, the existence of nanopores and nanofractures in tight rock matrices offers a chance to study mechanisms to better understand potential CO2 transport, enhanced oil recovery (EOR) potential and storage mechanisms in organic-rich shales and other unconventional reservoirs. Understanding the detailed mineralogy offers insights into the propensity of rock to fracture during well stimulation operations, or for clays to swell during drilling or fluid injection. From a CO2 EOR and storage perspective, clay type and occurrence can affect the CO2 migration pathways and adsorption potential of the reservoir.
Field emission scanning electron microscopy (FESEM) coupled with energy-dispersive spectroscopy (EDS) offers enhanced capabilities for unconventional reservoir characterisation. The challenge with using FESEM to better understand the matrix of unconventional reservoirs is the high resolution needed to adequately detect and image nano- or microscale features of interest in areas of the reservoir as small as 100 μm2. To extract statistically relevant information about features of interest requires analysis of multiple locations on a single sample and analysis of multiple samples. As a result, automated solutions and machine learning become much-needed tools in the development of an image analysis-based approach.
Developing the Approach
Work to develop such an image analysis-based approach for the identification of pores, fractures, OM and clays in organic-rich shales and other unconventional reservoir rocks, was conducted at the Energy & Environmental Research Center (EERC) in Grand Forks, North Dakota, using samples from the Bakken petroleum system. The organic-rich shale source rocks of the Bakken, coupled with interbedded carbonate-rich, tight siltstone reservoir lithofacies that serve as targets for horizontal drilling, provide an ideal opportunity to apply advanced image analysis-based workflows to different types of unconventional reservoir rocks. The coupled FESEM image analysis, machine learning workflow developed by the EERC allows for automated and efficient characterisation of minerals, OM, pore spaces and fractures in unconventional reservoirs to evaluate their potential for CO2 EOR and storage applications. The key software packages used for the advanced image analysis method included the Advanced Mineral Identification and Characterisation System (AMICS), ImageJ and ilastik.
Examples of porous (A, B, C) and non-porous (A) organic material in the shale source rock of the Bakken. There is also an example of fractures adjacent to pore space (A). These void spaces provide conduits for flow within a system. © EERC.
Tools of the Trade
AMICS is software for automated mineral analysis, specifically developed for the identification and characterisation of minerals in ores and other types of materials (Bruker, 2019). In this study it was employed to process FESEM images to classify and quantify the mineralogy on a particle-by-particle and grain-by-grain basis in the form of mineral maps. To enhance any features of interest at the nano- and microscale, the samples were polished using a broad ion beam milling system, in which the top layer of a material is removed to reveal a fresh sample surface for high-resolution imaging. This increases the chances of imaging the different features of the rock matrix that represent the sampled interval. The output included quantitative estimates of key sample characteristics such as porosity, OM content, clay mineral types and content, and the whole suite of major, minor and trace/accessory mineral components.
FESEM image with associated AMICS map demonstrating texture and mineral, OM, and pore content in detailed colour. © EERC.
ImageJ (Rasband et al., 2016) was employed to segment FESEM images into phases. Binary images of each phase were extracted, and operations were performed on those images to extract information and facilitate classifications of size, shape, area, and border contacts. Ilastik (Sommer et al., 2011) efficiently segments image features based on several attributes, including texture, shape and grey scale. Together, these programs were used to perform machine learning processes to interpret grain (or pore) size and shape, grain counts, and fractal analysis at a pixel-level detail. The power of these two programs is that they are able to classify features of interest based on things like texture, shape or spatial relationships. Thus, image classification is more advanced than that of traditional image analysis techniques which rely solely on grey scale for image segmentation.
Workflow to Data Flow
Visual demonstration of the acquisition and analysis workflow during the AMICS advanced mineral identification and characterisation system process. © EERC.
The beauty of the AMICS software interfacing with the FESEM is that images acquired (and subsequent x-rays) are automatically passed to the software for further processing. Each image frame is then divided into several thousand segments based on differences of back-scattered electron (BSE) values and x-rays are acquired for the segments. The smallest segment for which x-rays were acquired was determined based on the smallest feature of interest in the sample. This is generally dictated by the lithology of the sample. For example, a typical frame size for a Bakken shale image was 85 μm × 85 μm, which, when recorded at 1,500× magnification with 40-nm/pixel resolution, would typically yield about 4.5 million pixels, approximately 66,000 segments and 47,000 x-ray points in an analysis. The image size and x-ray count are adjustable based on the smallest segment that is needed for observation and interpretation. AMICS allows for acquisition of single as well as multiple frames. The versatility of the program enables preliminary observation to occur in isolated areas with multiple x-ray count tests in order to establish a final determination of the ideal observable area and point density. This maximises data recovery efforts while eliminating wasted time on unfruitful testing areas.
The AMICS approach generated mineral maps that could illustrate spatial mineral/pore/OM relationships within the samples for a succinct comparison of different samples or different lithofacies, illustrating the vivid differences between the Upper, Middle and Lower Bakken samples. These maps allow for qualitative assessment because of the observed spatial relationships of potential CO2 flow pathways and sorption sites through the visualisation of pores, fractures, clay and OM occurrence.
BSE images (top) of shale source rock (left) and reservoir (right). The AMICS maps (bottom) clearly demonstrate the textural difference between the two horizons. © EERC.
Data Flow to Understand Fluid Flow
The high-resolution images with distinct contrasts in features allowed for further processing of the data. An advanced image analysis (AIA) approach that combined open source software with in-house code was used to manipulate, adjust, filter, analyse and segment LowMag (3,000×) and HighMag (20,000×) image sets. The workflow was separate from but complementary to the AMICS data and relied on the images acquired by the FESEM.
The AIA workflow also allowed for quantification of the spatial relationships between key features of interest, such as the distribution of non-sorptive minerals, clays or OM surrounding pore spaces or fracture networks. This is important, because when trying to determine what OM or minerals CO2 might contact when flowing through the pore spaces or fracture networks of a rock, it could be misleading to just use the bulk mineralogy or total organic carbon content of the sample. For example, many of the pore spaces in the Middle Bakken samples are lined with clay minerals, whereas within the shales, almost all of the porosity occurs within OM. Thus, the CO2 sorption potential will vary significantly between the Bakken shales versus the reservoir rock because CO2 has a much higher sorption affinity for OM than clays.
The sets of FESEM LowMag and HighMag images with distinct feature contrast were critical to the spatial resolution of different scales of pores and features in the tight rock matrix and within the OM particles for AIA. The LowMag images were used to segment and quantify the total pore space, OM, clay and medium-density mineral content. The latter includes quartz, calcite, dolomite, K-feldspar, etc. while the high-density mineral content consisted of pyrite, zircon or monazite. The HighMag images were used primarily to segment and quantify the porosity associated with OM, focused specifically on OM particles found within the sample matrix. Both image sets were acquired in BSE and secondary electron (SE) modes to distinguish different surface topological and textural attributes of clays, OM, and pores and fractures within both the matrix and within OM particles.
Illustrated Results
The AIA approach provided striking images of the relationships between the classes identified for machine learning, selected to represent features of interest to better understand the Bakken CO2 storage potential. Any number of class combinations could be designated based on which parameters the user wants to quantify, such as pores associated with OM versus matrix-only pores versus the void space within fractures. The distribution of pores between the different void types can provide useful insight into potential fluid and/or CO2 migration pathways. The ability to distinguish and quantify porosity within pores versus fractures is a significant step in better understanding the primary mechanisms of fluid and CO2 flow and storage within tight reservoirs.
AIA workflow to segment images to understand spatial relationships of key identified phases of interest. © EERC.
Growth and Promise
As can be seen, the analysis of FESEM imagery using the machine learning-based capabilities of AMICS, ImageJ and ilastik provided a new way to interpret and quantify key unconventional rock features at the micron and nanoscale. AMICS mineral maps create powerful visuals of the various mineral grains and their associations in the rock matrix with effectively characterised and quantified mineralogy, clay content, fractures, porosity, and OM content at the resolution needed for unconventional reservoir characterisation. The maps also facilitate quick, at-a-glance comparisons of different samples and highlight mineral phases that may be reactive to CO2. Resulting 2D imagery analysis with AIA methods highlighted the important features needed to identify and better understand potential flow paths and to quantify void space within pores versus that associated with fractures. There is potential for future development and application of these methods to better understand the primary mechanisms of fluid and CO2 flow and storage within unconventional reservoirs. One example is investigations to better understand the number of images needed to use stereological approaches to estimate the volume of sample components using 2D and 3D imagery.
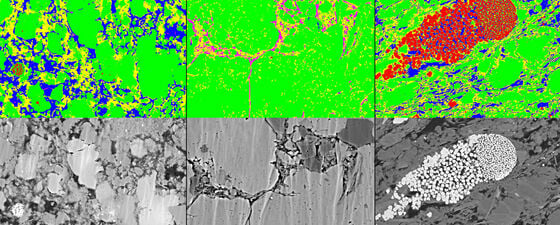
FESEM images (bottom row) from left to right of the Upper, Middle and Lower Bakken, with associated ilastik and ImageJ segmented images (top row), demonstrating relationships between the five identified phases of interest. Textural differences are easy to observe with AIA processes. © EERC.
Also, while AIA techniques successfully identified and quantified the void space in organic matter, making a differentiation between void space in pores versus fractures, additional work could determine connected and non-connected porosity. This would facilitate the ability to take sample characterisation data acquired at the nano and microscale and upscale it to core, well and eventually to reservoir scale by incorporating log data, petrophysical analysis and advanced mathematical techniques. Integrated results could facilitate and improve reservoir modelling and simulations for CO2 EOR and storage potential. This workflow, while developed using rocks from the Bakken, can easily be applied to other shales and unconventional reservoirs to characterise key features of interest and to better estimate CO2 storage and EOR potential.
References
Bruker, 2019, High speed differentiation of mineral phases of similar BSE intensity with AMICS, Application Note # EDS-16: www.bruker.com/products/x-ray-diffraction-andelemental-analysis/eds-wds-ebsd-sem-micro-xrf-and-sem-micro-ct/quantax-eds-forsem/amics-software.html (accessed February 2019).
IPCC, 2005. In Metz, B., Davidson, O., de Coninck, H.C., Loos, M., Meyer, L.A. (Eds.), IPCC SpecialReport on Carbon Dioxide Capture and Storage. Prepared by Working Group III of the Intergovernmental Panel on Climate Change. Cambridge University Press, Cambridge, UK, New York, NY, USA.
IPCC [Intergovernmental Panel on Climate Change], 2013. Summary for policymakers. In: Stocker, T.F., Qin, D., Plattner, G.-K., Tignor, M., Allen, S.K., Boschung, J., Nauels, A., Xia, Y., Bex, V., Midgley, P.M. (Eds.), Climate Change 2013: The Physical Science Basis. Contribution of Working Group I to the Fifth Assessment Report of the Intergovernmental Panel on Climate Change. Cambridge University Press, Cambridge, United Kingdom and New York, NY, USA.
Rasband, W.S., 2016, ImageJ: U.S. National Institutes of Health, Bethesda, Maryland, USA, https://imagej.nih.gov/ij/, 1997–2016.
Sommer, C., Strähle, C., Köthe, U., and Hamprecht, F.A., 2011, Ilastik: interactive learning and segmentation toolkit, in Eighth IEEE International Symposium on Biomedical Imaging (ISBI): Proceedings, p. 230–233.