Digital core analysis has become a useful addition to the petrophysics and reservoir engineering toolbox. The integration of digital and laboratory evaluations of rocks provides more and better engineering data than either alone, and that information can be delivered faster than ever before. The new Schlumberger DHD* (direct hydrodynamics) multiphase compositional pore flow simulation is a step-change improvement in the simulation of flow in porous media that can lead to improved recovery of hydrocarbons in the field.
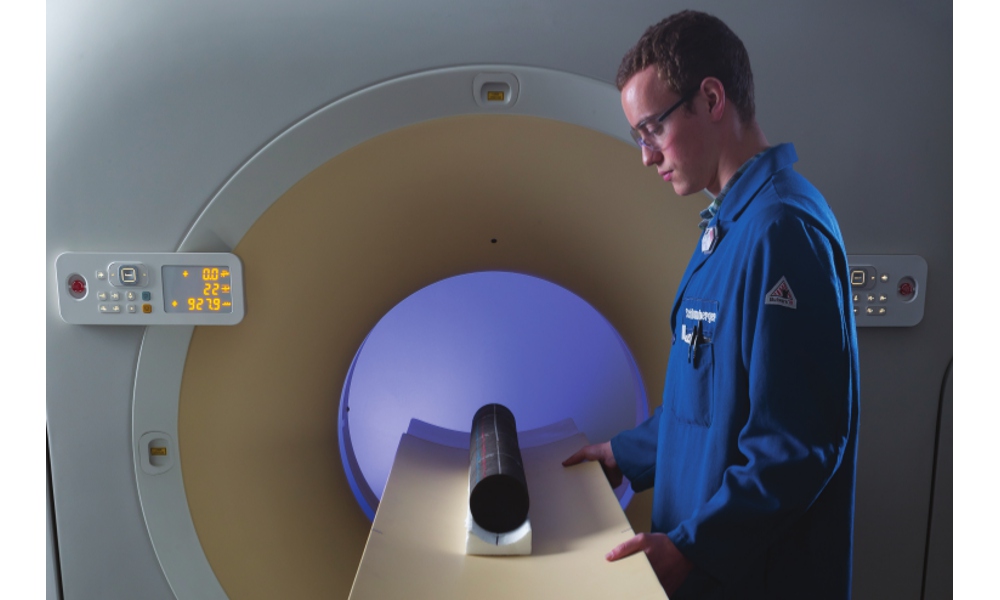
A whole-core sample is positioned for CT imaging using a dual-energy multislice scanner – the start of the process. (Source: Image courtesy of Schlumberger)
In the 1980s, attempts were made to use processed images of cores to generate petrophysical data. For example, researchers digitised thin section 2D images of core from a well and then evaluated them for size, shape, texture and structural information. This resulted in a large array of statistics about the pore space.
From this, researchers developed correlations to the permeability of the rock. This approach required several months of data acquisition, image processing and analysis, and the results were limited by 2D porous structure. Transferring the methodology to another well created additional challenges. Digital analysis of core images to provide useful geological and engineering information had a long way to go.
New Ways to Know the Rock
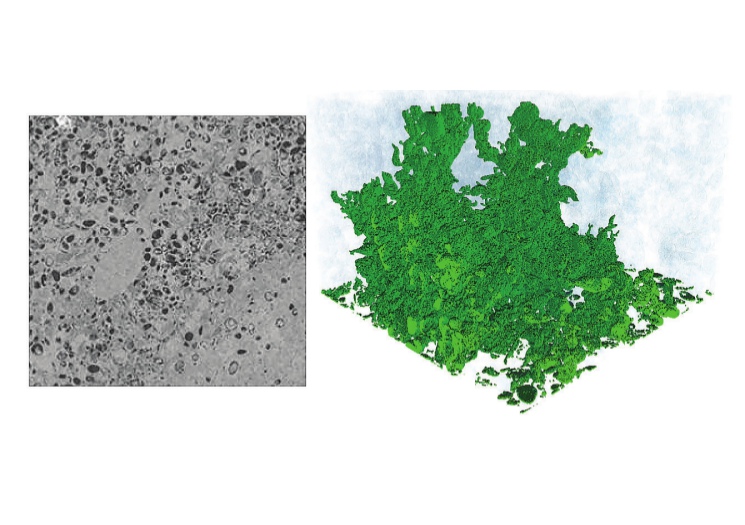 Simulation of tracer flow through Edwards White (outcrop) carbonate. The sample is somewhat heterogeneous, as indicated in the 2D cross-section of a microCT scan (left). A tracer test, shown at first breakthrough of the tracer, also indicates a high degree of heterogeneity in the flow (right). (Source: Image courtesy of Schlumberger)Widely recognised components of routine physical core analysis, combined with the latest in digital analysis technology, comprise the earliest stages of the process that culminates in DHD simulation. These different working parts — whole core X-ray computed tomography (CT), micron-scale CT (microCT) imaging, and focused ion beam scanning electron microscopy (FIB-SEM) — can be integrated rapidly to produce an actionable digital rock model. Analysis that previously took weeks or months can be completed in hours or days. Having the power to leverage a working model, one which analyses both rock and fluid properties and involves both physical and digital interpretation, puts operators in a position to better plan for a range of reservoir engineering strategies.
Simulating core flow for a given reservoir using DHD simulation gives operators more options than ever, enabling the study of multiphase flow from individual pore-scale events all the way up to complex scenarios. The simulator uses density functional theory encompassing a multiphysics envelope. With the ability to track how fluids will move through pore throats, this new introduction of digitalmeets-physical analysis can consider the effect of mixed wettability, complex rheologies, and changes in saturation as water drives production. Phase transitions can be observed as pressure drops beneath the fluid bubble point. This ability to change properties based on reservoir pressure or temperature condition is important because these transitions can lead to major differences in production efficiency.
Rock and Fluids Measurements Meet
At the Schlumberger Reservoir Laboratory in Houston, the process of analysing rock and fluid properties follows three basic steps in one workflow: characterisation, simulation, and validation. All of this is made possible through the use of CoreFlow* digital rock and fluid analytics services.
Characterisation constitutes measure ments of basic fluid, rock, and fluid-rock properties, including PVT data, rheology, fluid-fluid and rock-fluid interactions, and rock morphology. Simulation comprises building digital models to explore rock-fluid and fluidfluid dynamics. During validation, the results are authenticated through laboratory tests and core analysis — first with well-defined samples, then progressing to more complex examples. The physical laboratory testing component helps to refine the DHD modelling, thereby enhancing and confirming the digital measurements.
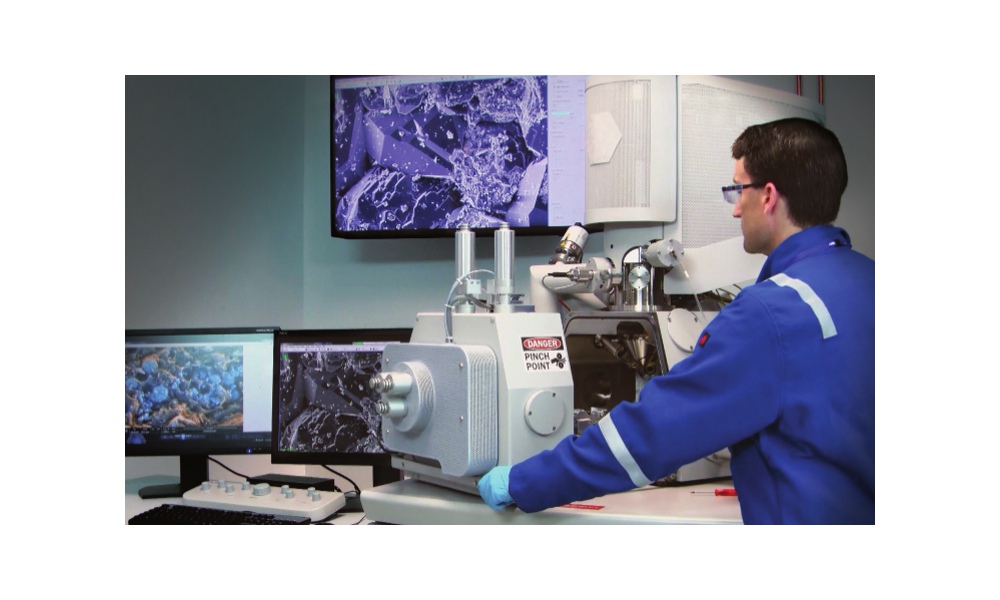
CoreFlow services SEM analysis typically provides key insights into the petrology of conventional and unconventional formations. (Source: Image courtesy of Schlumberger)
Whole core CT scanning is a typical start for the process. At this stage, operators are able to select samples for additional core analysis and imaging, while the whole core (e.g. 4″ diameter) is still in the liner. The 0.5 mm slice resolution from this imaging allows for the selection of a representative core sample with greater speed and ease, helping operators determine areas of interest for their reservoir evaluation. The rock sample obtained from this evaluation can be analysed to determine physical properties and is also used during digital analysis.
To create a core flow model, the samples then undergo another round of imaging at higher resolution based on the formation’s geological properties. Operators working with conventional reservoirs, like sandstones and carbonates, can determine flow characteristics by using microCT imaging and analysis. Using microCT plugs taken from the original core, micron-scale resolution images can be captured to show pore and grain characteristics (see page 33, top image). The digital porosity and simulated permeability can be compared with routine analysis measurements on the mini-plug. The use of the same plug enables operators to compare physical and digital results on a one-to-one basis, without risking possible miscalculations because of slight differences from sample to sample.
Because flow in unconventional reservoirs includes pores hosted by organic matter, instead of the larger pores found in conventional reservoir types, higher-magnification imaging is necessary to get the most accurate look at a sample. SEM provides 2D images that can reveal features as small as nanopores, in addition to offering a closer look at mudstone texture, which is useful in evaluating producibility. Further insight into pore connectivity can be determined by obtaining 3D images in an FIB-SEM.
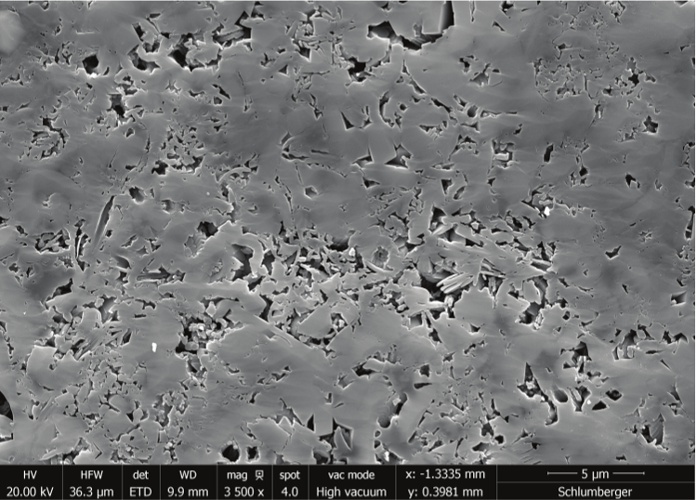
Argon-ion milled sample of a fossiliferous, calcareous mudstone from an unconventional formation. The image focuses on an organic matter pellet within the mudstone that is rich in calcareous fossils. The skeletal structures of these fossils provide a framework that preserves high porosities within the rock. (Source: Image courtesy of Schlumberger)
Reservoir Characterisation Answers Revealed
Both microCT and FIB-SEM 3D images can be converted to digital rock models that distinguish between minerals and the porous flow paths. These models are combined with a digital model of the reservoir and injection fluids to enable the DHD simulation of flow. This is the industry’s first simulation to combine digital rock models, complex compositional digital fluid models, 3D wettability distribution, and set-up of boundary conditions to simulate fluid flow through porous media. The simulator output can be compared with a laboratory measurement, such as relative permeability, and then extended to additional simulations that would be difficult, time-consuming, or prohibitively expensive to do in the laboratory. This scenario evaluation provides operators with actionable results to optimise field development plans, including identification of the most important parameters involved in displacement efficiency.
DHD simulation measures capillary pressure, relative permeability, recovery efficiency, and flow heterogeneity. This kind of dynamic modelling and comprehensive reservoir understanding based on fundamental physics has not been possible in the past. DHD simulation provides the reservoir characterisation answers necessary for reserves estimation, and offers an unmatched level of detail in modelling that can be used to improve production scenario planning decisions for optimised hydrocarbon recovery.
*Mark of Schlumberger