“Why would we need resistivity data if we are drilling for water”, some people argued when the Amstelland-01 geothermal exploration well was planned a couple of years ago. Now, almost a year after completion of the well, it turned out that the resistivity log formed a critical piece in the puzzle.
What happened?
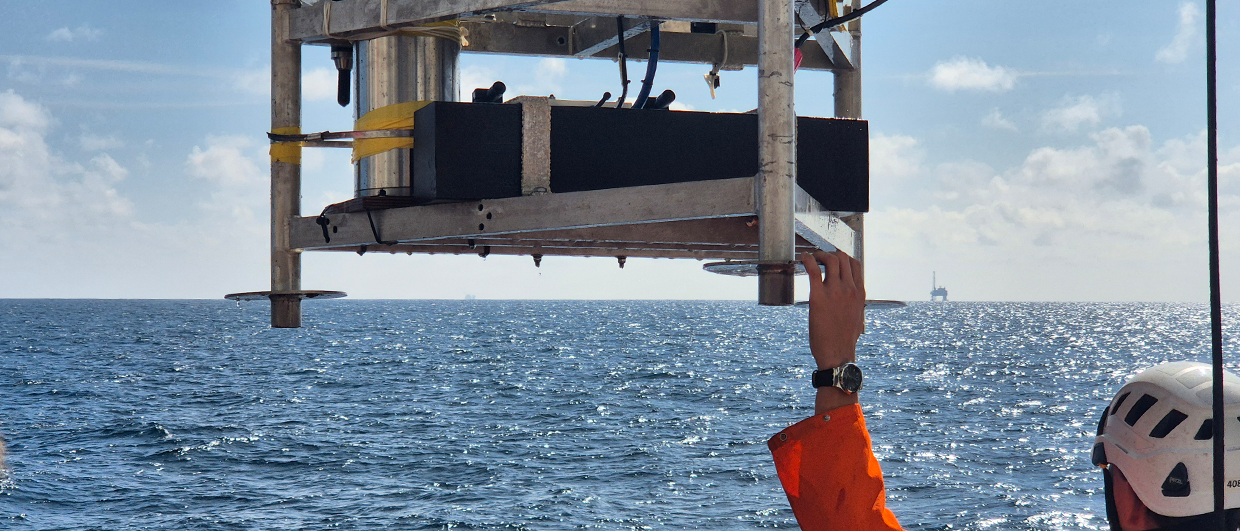
The Amstelland-01 well was the first in a series that EBN – the Dutch State Energy Company – is drilling in the Netherlands to better map the subsurface for geothermal energy production. This project is named SCAN, and more information can be found here. The wells are being drilled in areas where legacy oil and gas exploration never really took off. Amstelland-01 was located at a prominent location, close to the Ajax stadium just south of the city of Amsterdam.
Download a wide range of log and other subsurface data from the Amstelland-01 well from here
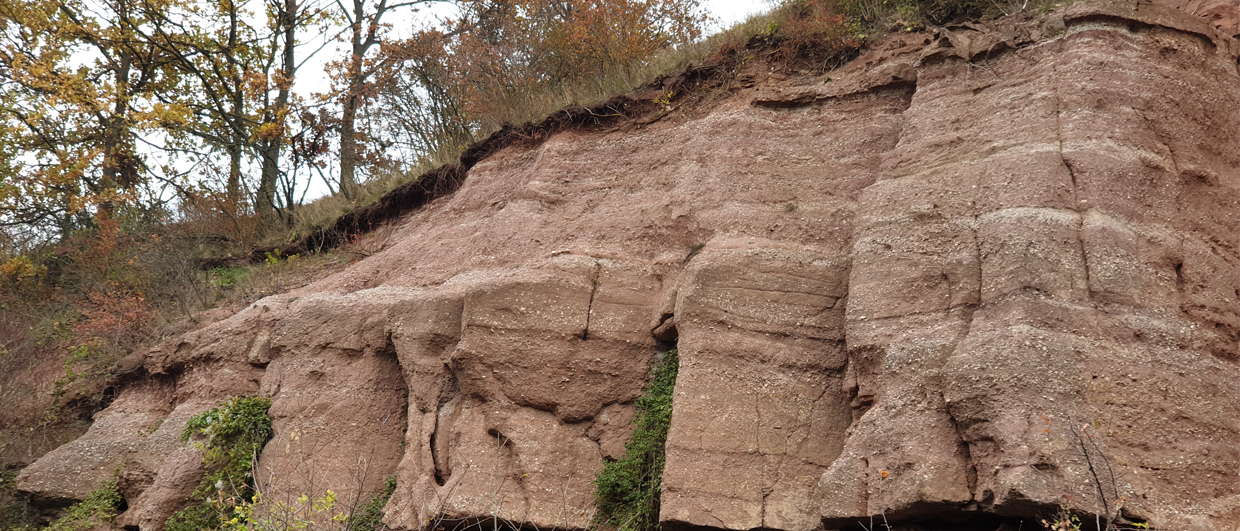
The main target of the well was the Rotliegend sandstone, because this reservoir is situated at a favourable depth with an estimated temperature of around 80-90°C. In many places, especially in the north of the country, the Rotliegend reservoir is known to be of good quality. The question was, how is the reservoir quality near Amsterdam and the wider Central Netherlands Basin where only a few wells were drilled?
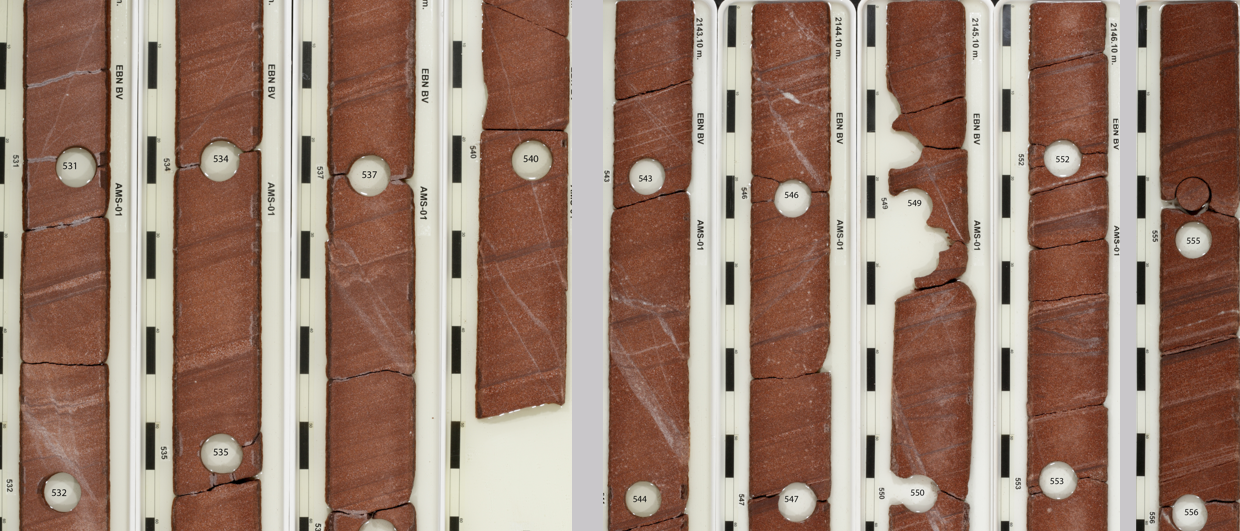
The results turned out to be difficult to interpret at first. The static data were promising. Almost the entire Rotliegend was cored, and air permeabilities of up to 11 Darcy were obtained. Surely, the production test would be showing a reservoir with flow potential.
But the production test, even though it flowed, was lower than expected. This led to many follow-up questions. Why was this the case? Two possible scenarios were put forward; a greater wellbore damage or “skin” than expected, or the presence of relatively low permeability deformation bands that were compartmentalizing the reservoir much more than expected.
Normally, a pressure transient analysis of the production test should help find out what the contribution of the skin or formation is, but due to wellbore storage effects, especially in the upper part of the well, the results were highly unreliable.
That’s where the resistivity logs came in. As well as other data.
First, based on core plug measurements of the fractures, a reservoir model was built to model the effect of low-perm deformation bands on flow. The result was positive; the presence of deformation bands only caused a maximum decrease of 22% in overall reservoir deliverability.
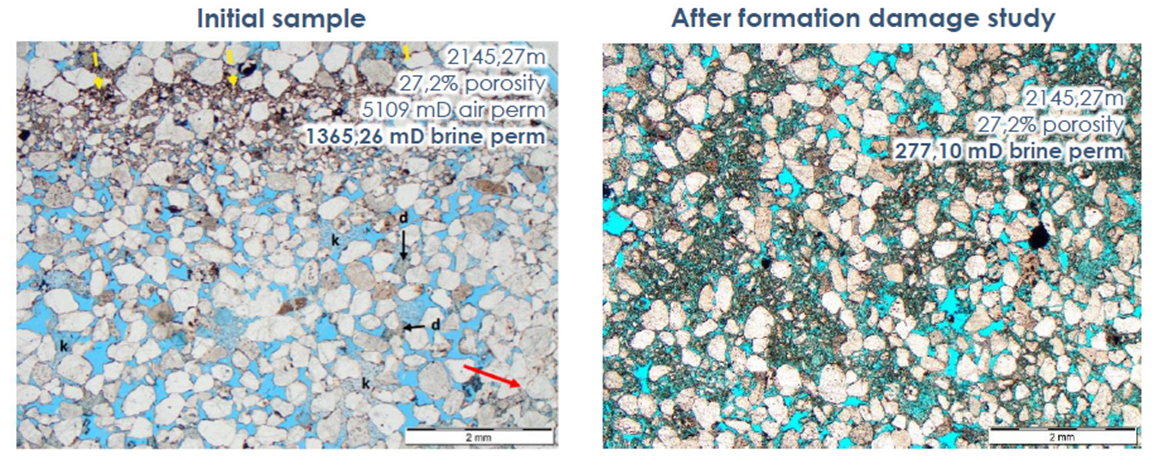
To estimate the effect of the wellbore skin on flow, the resistivity logs proved essential, as the well was drilled using oil-based mud. What turned out to be the case? The logs showed that oil-based mud filtrate invasion was much deeper than anticipated, well beyond the depth of the perforated zone. Modelling the effect of this suggested that the skin resulting from formation damage and relative permeability effects had a much larger negative effect on flow than the deformation bands.
Based on these results, being able to single out formation damage as the main issue, the team could conclude that he Rotliegend is indeed a promising reservoir in the area, opening the door for further geothermal feasibility studies. And these studies have already started indeed.