In my last column, I hinted at a case study, where I was able to interpret likely fluid migration based on temperature and vitrinite data in a single well. This study was a highlight of my career, in which our team could work with pretty much all of the data available in the basin.
At first, the vitrinite data were all over the place. A colleague from one operator company told me he just could not make any sense of those data in their license block and had to ignore them. We had the benefit of a much wider dataset and a wider context.
It turned out, we had reports for some wells that included original reflectance measurements with statistics and photographs for a number of wells. We had kerogen organoparticle analyses. We even had overlapping VRo data from two and even three different labs. Even though the data volume seemed overwhelming and messy I had a feeling we had a chance to make something out of it. So I decided to ignore the reported interpretations and dived into the files. I started organizing and typing all data in spreadsheets and began cross checking all the different pieces against each other. An incredibly tedious and time consuming effort. But it paid off.
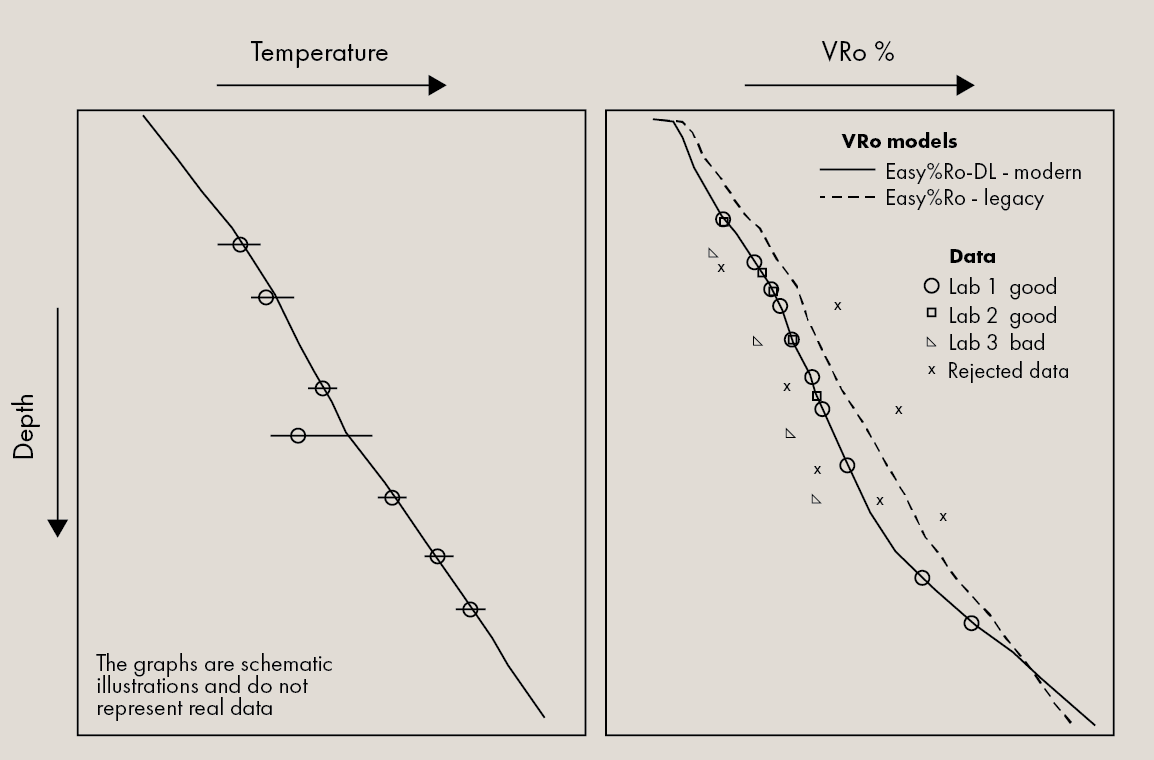
Gradually, I started seeing patterns and relationships. Some measurements reported as VRo started to show up as clearly measured on different particle types. I could see which data were more reliable. I found that two of the labs consistently reported reliable or at least reasonable data while the third lab consistently reported incorrect data. So in the wells where I did not have underlying measurements, I could flag the reported data based on the lab of origin.
I also did similar detailed analysis on temperature and RockEval data. Gradually trimming the noise and high-grading the dataset.
Then I proceeded to build 1D thermal models. I defined fairly detailed lithology columns from the well logs. After I calibrated the first model, I continued building others with similar heatflow settings. The results just made my eyes pop! One model after another came out with an excellent fit to temperatures and VRo that I never saw again.
The models did not only serve as a temperature history estimate for maturity calculations, they were important tests of the data integrity and overall geological model validity. It also confirmed my previous experience that the more modern EasyRo%-DL model is the best one to calculate VRo in a basin model.
The story shows just how important it is to have original and overlapping data, to share data among companies and not to rush through the model building. Take your time, invest a little bit and you’ll be rewarded!