Interdisciplinary approach to gain confidence
Using post well analysis in an interdisciplinary approach leads to a more confident understanding of complex petroleum systems.
Due to the complex nature of strata offshore in the Gulf of Mexico, it is difficult to identify formations and sequences across wells based on lithology and wireline data alone. Integration of biostratigraphic data from the US Bureau of Ocean Management unified with the Gulf Basin Depositional Systems stratigraphic framework was, therefore, utilized to characterize differing units. All the data inputs, from a variety of sources, have been collated into a geodatabase which can be scrutinized using ESRI’s ArcGIS software and specific query tools developed by TGS.
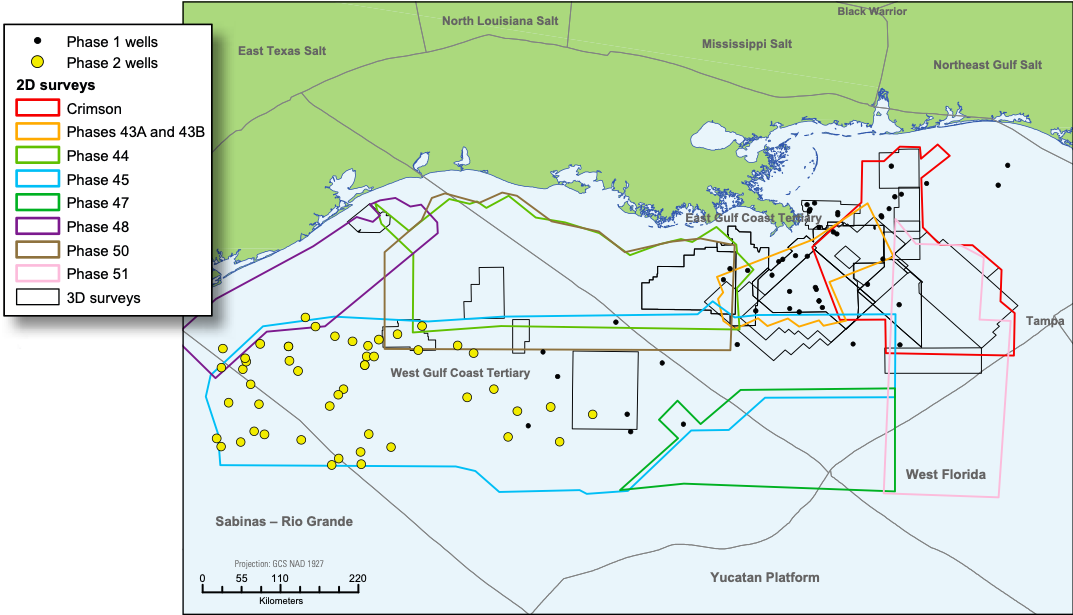
This interdisciplinary study currently includes 50 wells from the US offshore Gulf of Mexico. A further 50 wells are being included in a second phase (see map above). The criteria for well selection is based upon location in key areas of exploration, depth, well stratigraphy and availability of data.
The Phase 1 work schedule included the first 50 project wells centered around the TGS 3D surveys in the Eastern Gulf, such as Mississippi Canyon, Atwater Valley, and Main Pass areas, and infilling with 2D seismic in areas including Green Canyon and Walker Ridge.
Phase 2 is focused on the Western Gulf, where an additional 50 wells are included across Alaminos Canyon, Port Isabel, Corpus Christi and East Breaks, with predominantly 2D seismic coverage. The focus of phase 2 is to analyze and refine the understanding of this region and to provide a robust platform for comparison with Mexican wells south of the border.
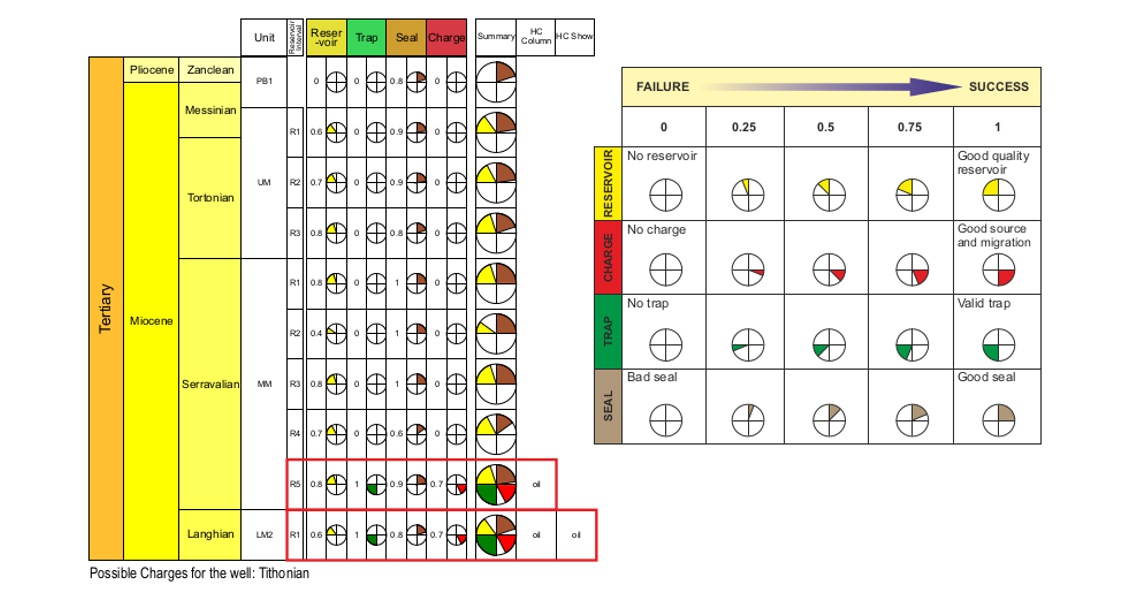
The four main elements assessed by the post well analysis (PWA) are reservoir, trap, seal and charge. By assessing wells from a holistic standpoint utilizing experience from geology, geophysics, petrophysics and basin modeling, we can determine the primary reasons for well success and failure.
Reservoir: Reservoirs are selected based on lithology, CPI data, presence of hydrocarbons, and zones of interest or targets defined by the original operator. Up to five reservoirs per unit are analyzed in each well, though due to the nature of sand deposition within the Gulf of Mexico, two sands with the same reservoir name in different wells may not be part of the same sand-body, even in circumstances where the wells are less than a half a mile apart. Porosity and net-to-gross (N:G) values, along with thickness and lithology information, are utilized to determine the rating of each reservoir. Porosity and N:G data were determined from CPI calculations.
Seal: Assessment of the seal for each reservoir was split into two parts: top seal and critical seal. Top seal was assessed directly at the well, using the log interpreted lithology to determine the likely vertical thickness and heterogeneity of the section. The critical seal is assessed where structural elements away from the well are necessary to form a lateral seal, i.e. a closing fault in a faulted anticline. Lithology at the well is combined with seismic character around the well to determine the possible lithology across a fault from the reservoir interval in order to ascertain whether there are likely to be thief zones across the fault. The presence of gas clouds and bright amplitudes around the well are used as indications as to whether the fault itself is sealing, or a migration conduit away from the reservoir.
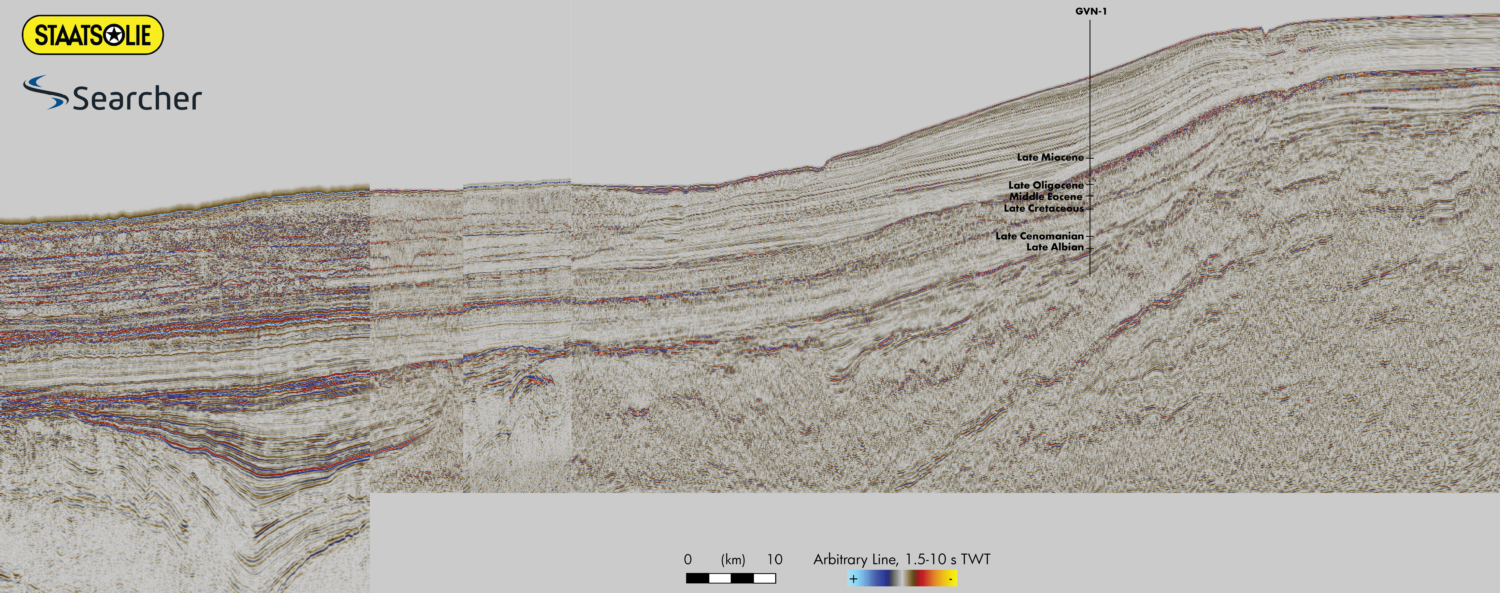
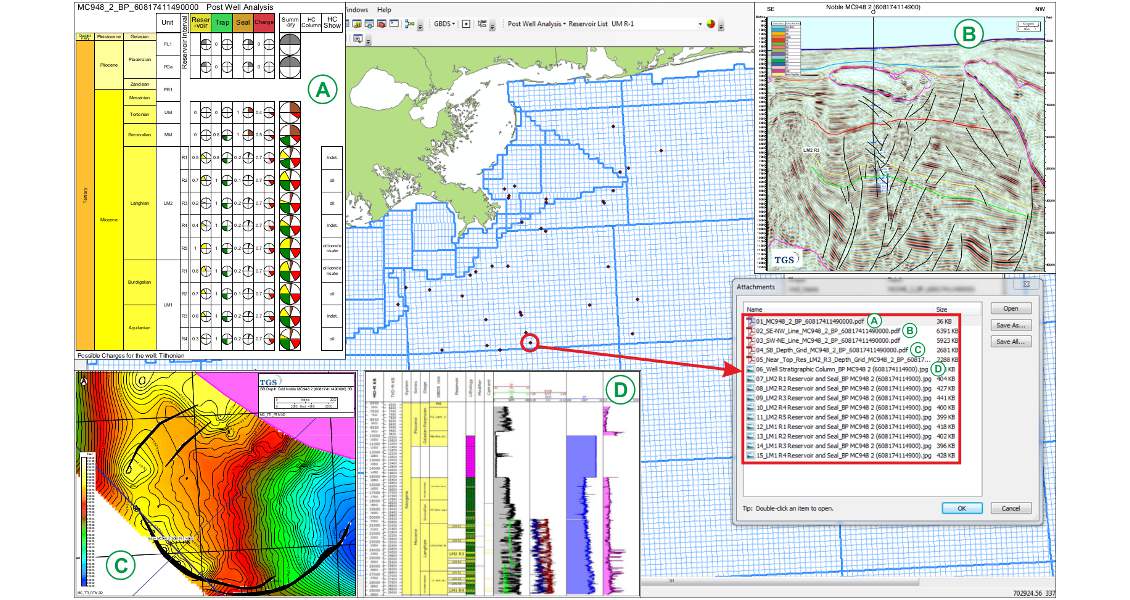
Trap: Assessment of the trap, as with the other parameters, is at the reservoir level. Within each section it is determined if there is a valid trapping mechanism seen on available seismic. When a trapping mechanism is identified on the seismic, as seen on the main seismic line above, it is rated on likelihood of success or failure. Confidence ratings are applied on both the data available and the interpretation to allow for complete transparency in workflow. Any DHIs observed are also compiled and commented on. Analysis of trap timing and basic volumetrics are also included in this part of the study. Images are used to demonstrate the structures observed, using TGS multi-client 3D and 2D data. For each well assessed there are two seismic lines with TGS interpretation and depth grids for reservoir levels of interest.
Charge: Evaluation of the charge is based on effectiveness of source rock (expulsion), using source rock quality at the well when geochemistry analysis is available, and also thermal modeling. Kitchen depths plus migration pathways, maximum burial and maximum temperature are all accounted for within the database. The main source rocks defined by Hackley (2012) formed the basis of the source rock units assessed. If a unit is potentially a good source rock, but there is no migration pathway (e.g. lack of carrier beds or lack of communicating faults) for the hydrocarbons from the kitchen to the well, then the failure was considered to be due to lack of charge.
Well summary chart and database
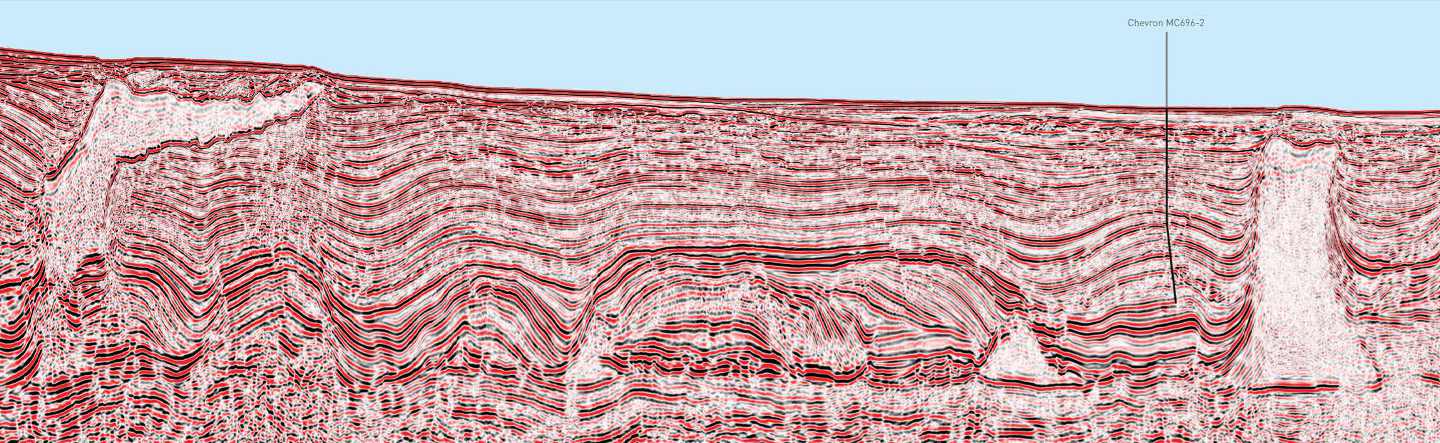
Upon completion of the analysis of the four main geological parameters a well summary chart is created to graphically represent whether the well is a success or a failure at each stratigraphic interval. Pie segments are representative of the overall rating that is applied for each reservoir interval. For example, the well above (M696_2_Chevron_60817410340000, Blind Faith), identified two successful intervals where the four primary pie segments display high values. Hydrocarbons have migrated updip via faults to charge the reservoirs at LM2 R1 and MM R5 level that have good structural trap and effective closure. The upper intervals are generally found to have effective reservoir and seal but failed due to lack of closure and charge/migration pathways.
The final project is delivered in an ArcGIS geodatabase format, so that each well can be scrutinized. Attachments of seismic and well images are provided for each well in the database and a query tool allows the user to further interrogate individual elements of the wells.
Rating confidence
Hydrocarbon exploration is a high risk investment and risk assessment is essential for successful asset management. Exploration is a complex concept and by using the PWA we have provided an independent confidence rating on the four main geological elements that are required for a successful outlook on wells that have been completed.