Gas flaring, the deliberate combustion of natural gas at oil and gas fields, refineries and processing plants, is a significant source of economic and environmental waste. Yet much of this gas can be recovered with technically proven and commercially viable solutions. As the world works to decarbonize, we urgently need to improve transparency on this avoidable source of pollution and deliver material reductions.
Hot Topic
Over the last 130 years the oil and gas industry has been instrumental in driving economic growth and improving living standards. No part of our daily lives is untouched by hydrocarbons. Yet this same industry is facing an existential crisis brought about by climate change and partly by the development of low-cost renewables.

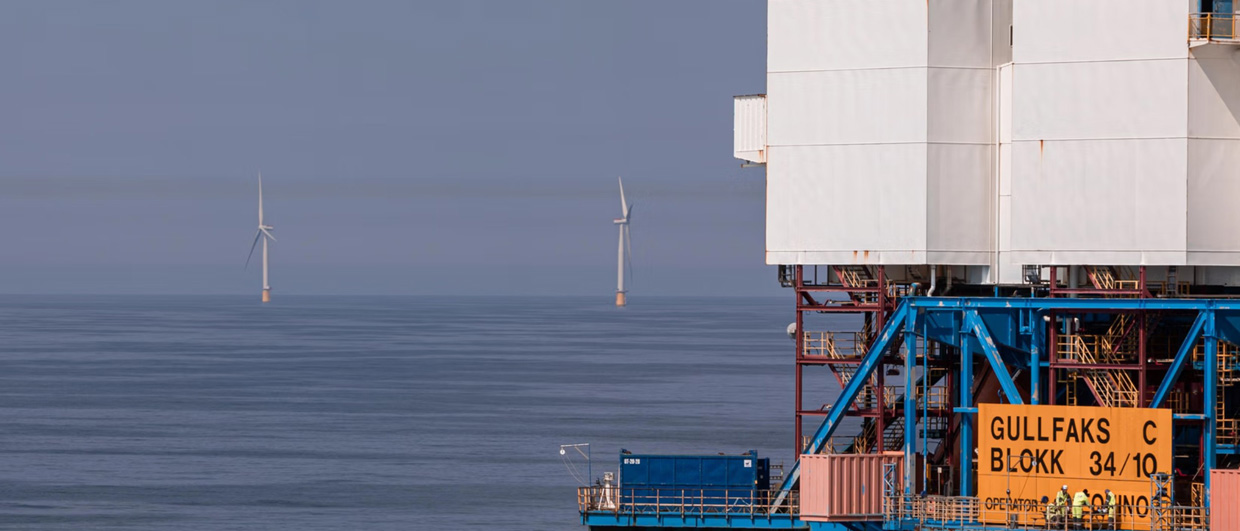
Figure 1: Examples of gas flares from Europe, Africa and the Middle East. Over 10,000 gas flares globally emit more than 1.2 billion CO2-equivalent tonnes of greenhouse gases.
The world is racing towards a low carbon future. Governments and corporations around the world have committed to net zero by mid-century. But as we progress to this point and for the considerable remaining time that hydrocarbons will power and drive our economies, we need to address the issue of flaring of natural gas.
Globally, 150 billion cubic meters (Bcmg), or 14.5 billion cubic feet (Bcfg) per day of gas was flared in 2019, according to the World Bank’s Global Gas Flaring Reduction Program, which estimates flaring from the thermal anomalies observed by satellite. Flaring is at its highest level for a decade, and is up by 3% since the 2015 Paris Agreement. That is 4% of gas consumption and is sufficiently large that, if it were a country, ‘flaring’ would be the fifth largest gas-consuming country globally (after US, Russia, China and Iran). It is also 100 gigawatts (GW) of continuous power (almost 3% of all power generated in 2019) and could displace up to 9% of all coal-generated power.

Figure 2: Flaring profile over time: Flaring also emits methane through ‘methane slip’ generated by incomplete combustion. Efficient flaring achieves around 97% combustion, but the global average is much lower, with a global weighted average combustion efficiency of 90%, leading to CO2-equivalent emissions of 1.2 billion tonnes per year. Note we use the IPCC’s Global Warming Potential (GWP) of 84, meaning that methane is 84 times more potent than CO2 over a 20-year period.
Apart from the environmental damage, flaring also leads to an annual revenue loss of up to $18 billion and direct emissions of 276 million tonnes of CO2 per year. And when the ‘methane slip’ which is associated with incomplete combustion of flares is included, these are probably at least three times higher at 1.2 billion CO2-equivalent tonnes (some 2% of global emissions), and could be significantly higher.
Flaring, the most visible of the sources of loss in the oil and gas supply chain, is a close sister to ‘venting’ (the deliberate, known release of methane from storage tanks, pumps and compressors) and ‘fugitives’ (the accidental release of methane from leaking infrastructure). Together, using numbers provided by the International Energy Authority’s (IEA’s) Methane Tracker, these three sources amount to an estimated 7 billion CO2-equivalent tonnes. Whilst venting and fugitives, collectively known as ‘methane leakage’, are increasingly in the public awareness, flaring is somewhat overlooked.
Yet to meet the IEA’s sustainable development scenario (which predicates a 90% reduction in flaring by 2025) and to deliver net zero by mid-century, flaring must be firmly in the spotlight. We estimate that the upstream E&P industry would need to invest a modest 2–3% of its $450 billion capital expenditure (some $10–15 billion) over the next three to four years to meet this target.
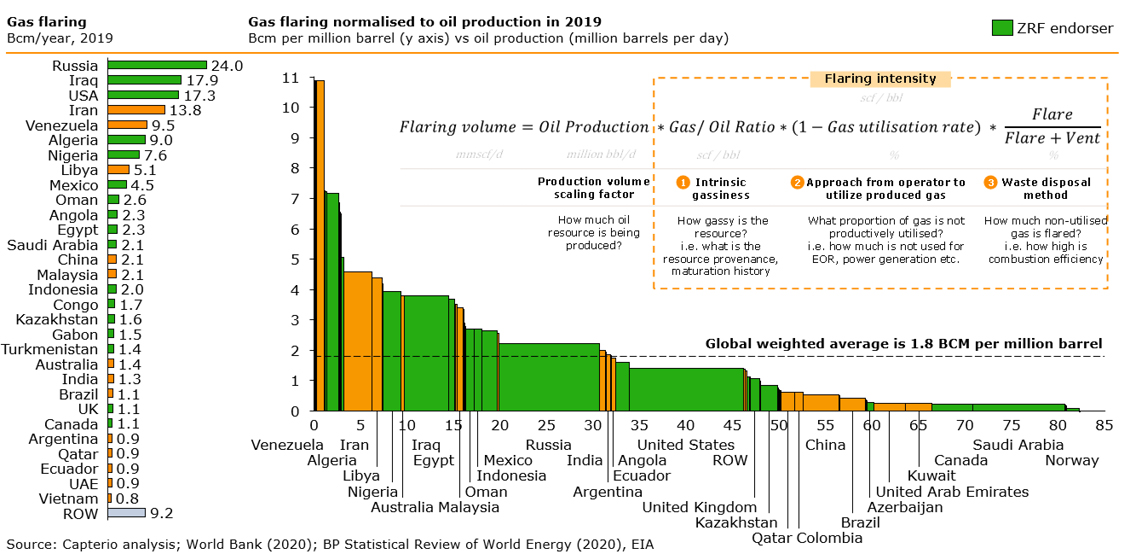
Figure 3: Illustration of the league table of nation-states, for flaring in absolute terms and relative to oil production. Countries such as Saudi Arabia and Norway have flaring intensities that are 1/10th of the global average – driven by policy.
Flaring varies significantly by country, with the top five countries accounting for over 50% of flaring. It is promising to see that 34 governments that represent 70% of all flaring have endorsed the World Bank’s ‘Zero Routine Flaring by 2030’ initiative (Figure 3). Each of these countries could be more ambitious with their nationally determined contributions during the upcoming negotiations in Glasgow for COP26.
Perhaps more interesting, when flaring is compared to its primary driver (oil production) in our ‘flaring intensity’ metric, countries with high ‘flaring intensities’ are generally those dominated by unlisted National Oil Companies. Venezuela, Algeria, Iran and Libya stand out with very high rates, whereas Saudi Arabia and Norway have very low rates, 10–20 times lower than the global average. It should be noted that we cannot rule out that our estimates of flaring are underestimated if countries vent unburnt gas to the atmosphere, often without detection and with huge environmental consequences.
Flaring intensity is a big deal, not least because consumers are becoming aware of the emissions embedded in their supply chain and are increasingly looking to buy products that are certified as low carbon on an end-to-end basis. The EU, as part of the recently-launched EU Methane Strategy, for example, is considering imposing a carbon border tax potentially as early as 2023. Countries with high flaring rates need to act to preserve the competitiveness of their gas, or risk losing revenue and influence.
Flaring intensity is a function of the source rock provenance (the gas–oil ratio), the gas utilization rate, and the combustion efficiency of flares. The most important driver of flaring is the utilization rate.
On associated gas utilization, Saudi Arabia has shown leadership, following a government decision in the 1980s to create a new petrochemicals business from waste gas. Norway is similarly successful (and flares 10 times less than the UK) showing that decades of focused policy, well-developed infrastructure and carbon taxation, delivers results.
This variation also talks to the causes of flaring. Companies flare natural gas in three main situations: when disposing of unwanted or ‘associated’ gas accompanying oil production, during operational upsets or trips, and for safety purposes during routine operations. Whilst the latter two situations are somewhat inevitable, the former is of significant concern. A detailed inspection of satellite data highlights, firstly, that most flaring is ‘continuous’ in nature, debunking the myth that most flaring occurs from upsets, and secondly, that moderate and large flares (those above, 3 million scfg/day) account for almost two-thirds of the flaring. Figure 4 has the details.
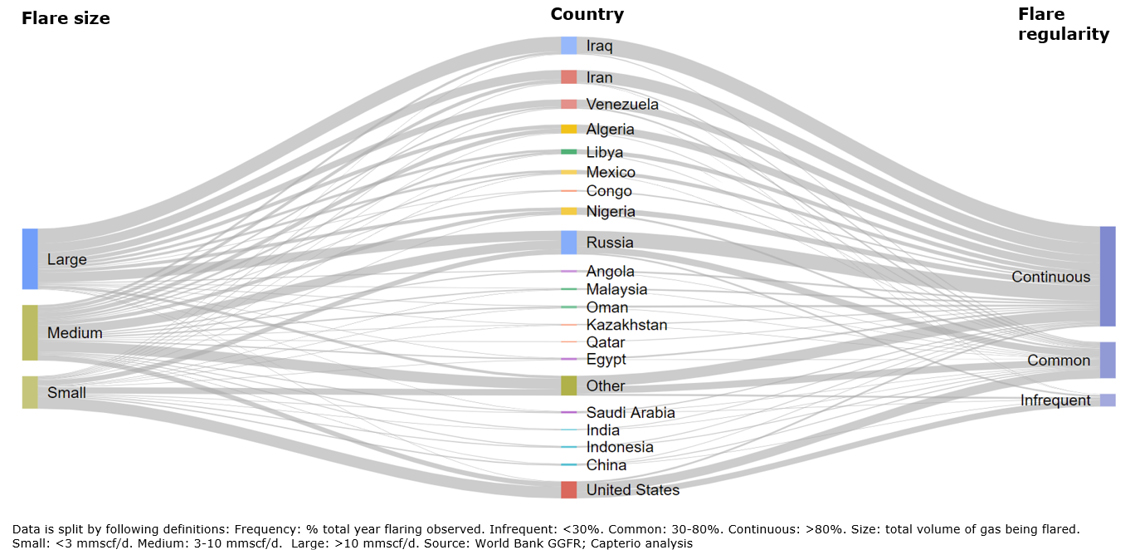
Figure 4: Sankey chart of the volume of flared gas by size of flare, nature and country. Flaring in countries such as Iraq or Iran are dominated by flares that are not only ’large‘, but are also operating ’continuously‘. Conversely, flares in (e.g.) USA are mostly small, and many are not operating continuously.
Why Operations Flare
So, given that gas is intrinsically valuable, why is so much of it flared? For the most part, we think it is due to a system failure, underpinned by lack of focus, economics, resources or regulation (see Table 1). Sorting out the system failure can be very challenging, but with the industry’s reputation on the line, it is imperative that we find collaborative solutions.
Our research shows that flare capture projects can often be intrinsically commercially attractive. The key is to unlock the barriers and ensure that the revenue split rewards each party appropriately. Often creative thinking, such as potentially ‘aggregating’ flares with other operators, helps.
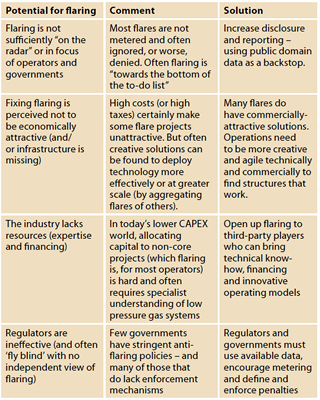
Table 1: Overview of the main reason that operators flare gas today.
Flare Capture, a Win-Win
There are two broad solution categories for gas flaring: use the gas in local operations, or export the gas (either directly, or as a product) to the market. In all cases, the industry is moving to deploy standardized units that are skid-mounted and are mobile, meaning that solutions can be deployed quickly and redeployed as required. Since many flare solutions are considered as small capital projects, they will likely require fit-for-purpose solutions delivered by agile and specialist solution providers.
Since flares are often rich in C2+ components (which often causes the thick black smoke), monetization options can also capitalize on the recovery of valuable liquid products such as LPG (Liquefied Petroleum Gas), NGLs (Natural Gas Liquids) or condensate, which can significantly enhance the economics.
The main monetization options for local operations include reinjection for enhanced oil recovery, storage or disposal. DNO and Genel, for example, have recently reduced flaring by 20–30 million scfg/day in their Peshkabir/Tawke fields in Kurdistan whilst also increasing gas drive, leading to increased oil production. Also, it is possible to use the gas to generate electricity for oilfield operations. A surprising number of oilfields are powered by electricity generated from diesel, when abundant and cheap flared gas is available.
The main market-based monetization options include sending the gas to an existing gas pipeline. We have analyzed the proximity of every flare to its nearest gas pipeline globally, and identify that 58% of gas flares are within 25 km of a gas pipeline. Another option is to transport the gas via a ‘virtual pipeline’ to the market as Compressed Natural Gas (CNG), Liquefied Natural Gas (LNG), or as methanol or synthetic diesel (‘Gas To Liquids’/GTL). Small-scale plants, which typically handle volumes as low as 2–5 million scfg/day are viable, and small-scale CNG and LNG plants in particular are already being deployed at scale in several countries. Our analysis highlights that 63% of gas is within 25 km of an existing gas demand centre. Other options include generating power for the grid and delivering computing services by using flared gas to power-run data centres, or to enable cryptocurrency mining. Such systems have been deployed commercially at scale in the US with considerable success. Equinor is the latest major oil company to have announced a Bitcoin project. Another option is to generate value-added products such as petrochemicals or fertilizers, or potentially synthetic proteins for use as animal feed.
Sound Investments
We estimate that approximately a third of flared volumes (50 Bcmg per year) can likely be monetized with attractive IRRs in the 20–50% range, post tax. These projects deliver significant new revenues to owners and their host governments (in some cases, boosting GDP by up to 1%), improve health, create jobs, improve reputations and contribute towards emissions reductions targets. Another 50 Bcmg would likely be roughly value-neutral – meaning that only a third of the total flaring is likely to be seriously ‘out of the money’. Whilst most gas flaring solutions lead to the gas being burned with associated CO2 emissions, unless sequestered, they deliver two environmental advantages. Firstly, the end product, which is often gas-fired power, could end up displacing lower-quality power sources, such as coal. Secondly, total emissions are dramatically lowered by eliminating venting of methane at inefficient flares (offset by marginally increased CO2 emissions from more efficient combustion). The result is a net emissions reduction of up to 77% for a typical flare (Figure 5).
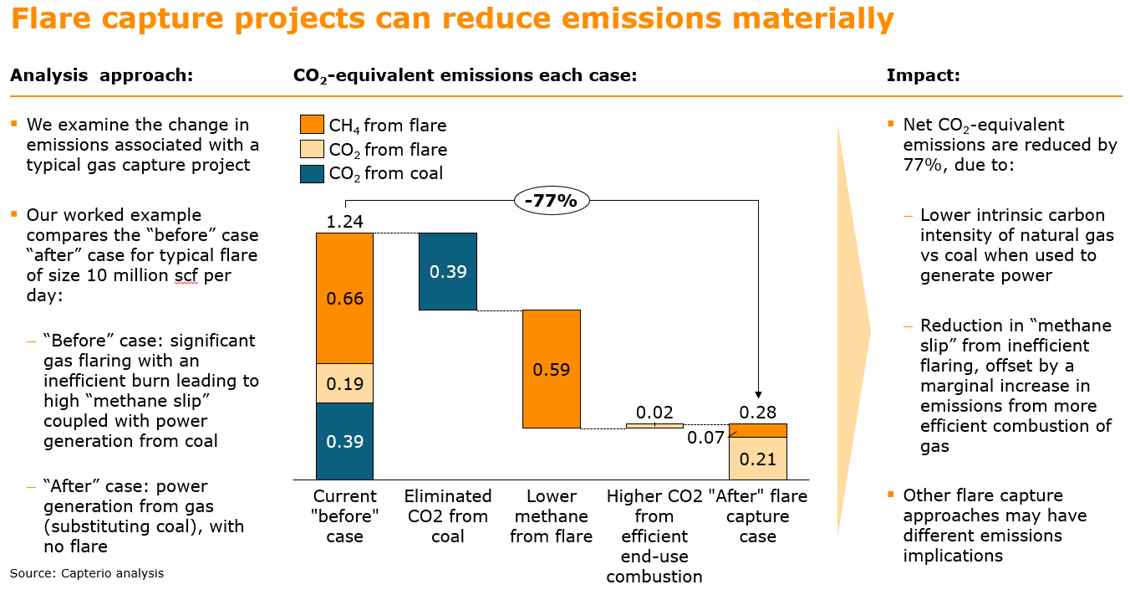
Figure 5: Emissions impact resulting from a 10 million scfg/day flare where recovered gas replaces coal-fired power generation. We calculate CO2- equivalent emissions of methane over a 20-year basis.
Flare capture projects, therefore, are ‘low-hanging fruits’ that not only create real economic value, but also significantly reduce emissions and help to accelerate the energy transition. Investors that are seeking sound investments that deliver against their ESG metrics and have negative marginal abatement costs, are increasingly interested in these opportunities.
Making Flaring Glaringly Transparent
It is however disappointing that, five years on from the 2015 Paris Agreement, global gas flaring has increased by 3% from 146 Bcmg to 150 Bcmg in 2019. The cumulative waste is some $100 billion in lost potential revenue.
It is particularly disappointing that flaring from the 11 countries that “specifically identified flaring as a significant component of their NDCs” has increased by 6%, to 60 Bcmg. Eight of the 11 countries now flare more than in 2015, which is not good enough. We must do much more and quickly. To help this situation, Capterio has launched a new and open-access tool ‘FlareIntel’, which enables users to explore each of the 10,000+ flares globally for free (Figure 6). The tool, which is available on the Capterio website, integrates the last eight years of flaring data at the level of the individual flare with recent satellite imagery and metadata (such as the field name). We hope that by bringing this data into the public domain, we can improve awareness, accountability and assist in identifying and accelerating the delivery of on-the-ground flare capture solutions.
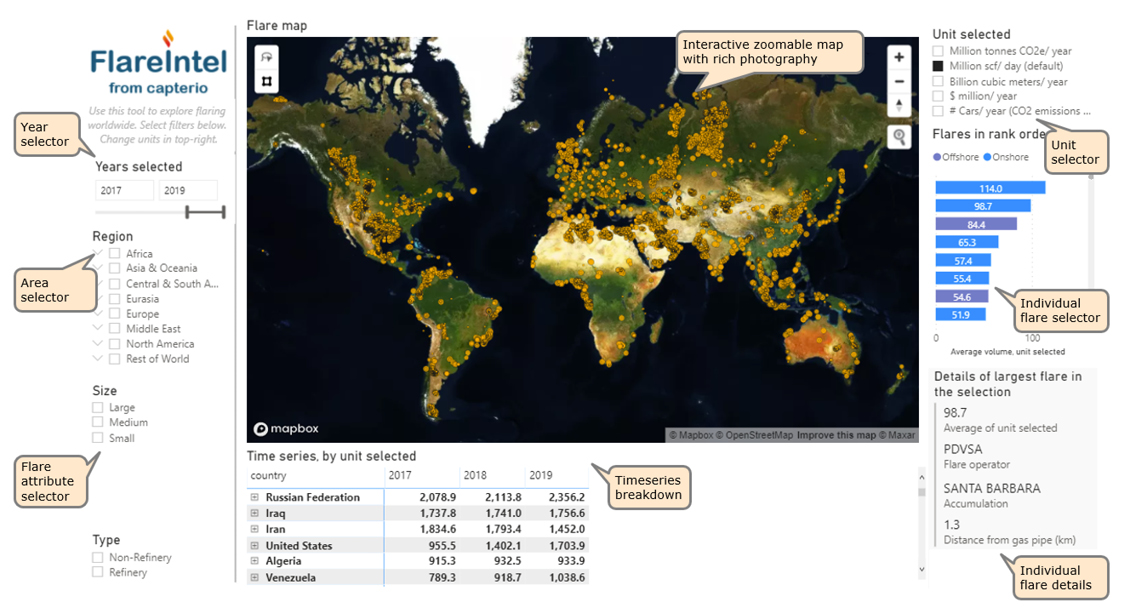
Figure 6: Screenshot of a new, free to use, public-domain ‘Global Flaring Intelligence Tool’ which enables users to explore each of the 10,000+ flares that are detected by satellite.
Geoscientists have long been interested in and understood environmental change. Our natural tendency for big-picture, integrative thinking has a direct application to flaring, whether by minimizing it by design through better cross-discipline integration from project inception or by holding our industry to account. The upcoming COP26 is the moment for governments to raise ambitions. Let’s use our influence to make sure it happens.
Related Articles
Flaring – the $20 Billion Dollar Decarbonisation Opportunity
Geotalks by GEO ExPro
On 6th May 2021, GEO ExPro will launch their ‘Geotalks’ webinar series. The first Geotalks session will host Capterio CEO, Dr Mark Davis, who will discuss the root causes of and the importance of reducing gas flaring to reduce emissions, create value and accelerate progress towards net-zero.
This article appeared in April, 2021
GEO ExPro Vol. 18, No. 2 Out Now!
Nathan Young
Geoscience magazine GEO ExPro Vol. 18, No. 2 is now available for download. This issue of GEO ExPro focuses on North America; New Technologies; the Future for Geoscientists.
This article appeared in Vol. 18, No. 2 – 2021