The evolution of FWI Imaging technology
FWI is a sophisticated model-building technique. This method has traversed a remarkable journey, from its nascent stages in the 1980s to its near failure around 2000, battling with limited computational capabilities. With the exponential growth in computational power over the years, FWI has experienced significant advancement and a place as a vital model-building technology in current workflows.
About 15 years ago, work on FWI increased dramatically. Development efforts were focused on employing acoustic FWI as a complementary velocity model building (VMB) tool. Over time, it has aided in generating better-focused images of subsurface features by utilizing more waveform information recorded by seismic receivers (phase, amplitude, and different types of waves) than traditional methods such as tomography. Recently FWI’s capabilities have expanded even further, transforming it into a technique capable of generating interpretable models that could start to be cross-validated with data from well measurements. In addition, the acoustic approximation is being changed to elastic FWI with a better theoretical agreement with the nature of field seismic data. All this is bringing new levels of confidence to FWI-derived models.
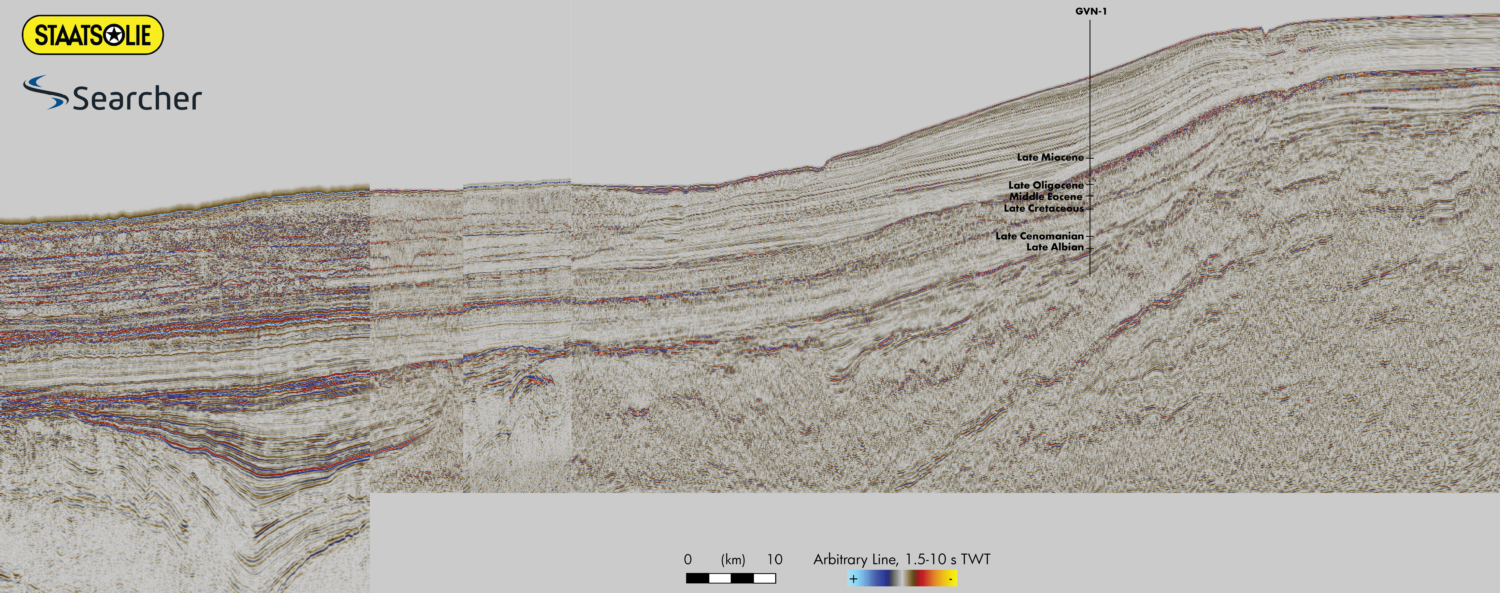
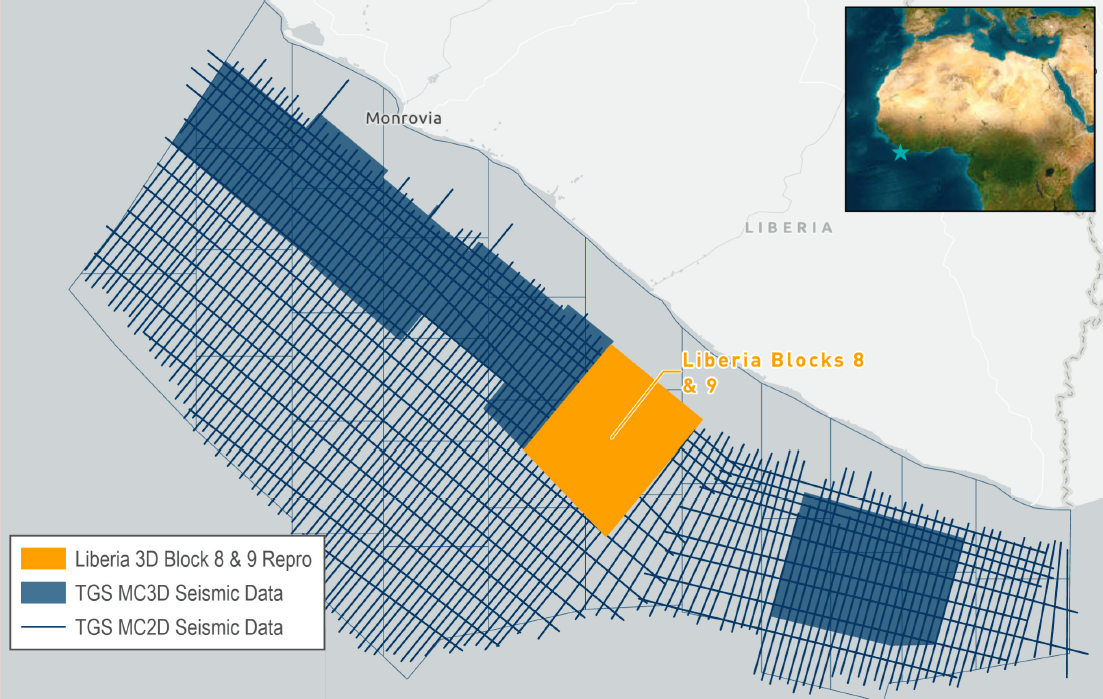
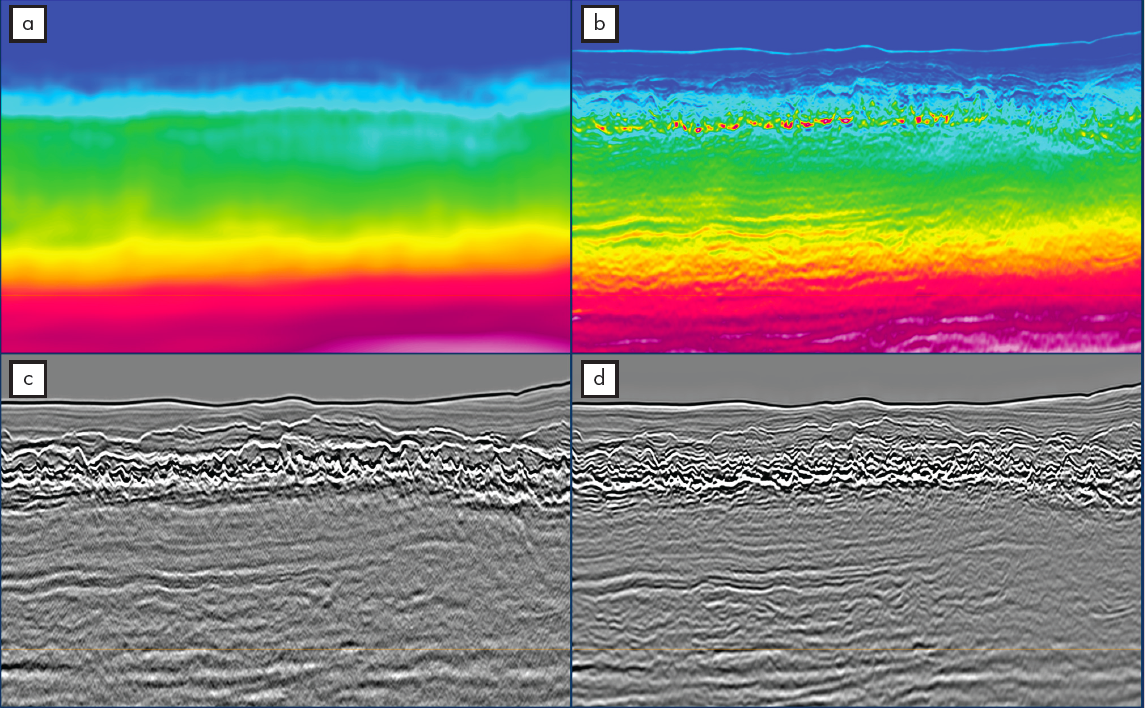
Today, we are creating derivative products of FWI to allow direct extraction of seismic images. These images, FWI-derived reflectivity, are providing complementary views of the subsurface to the standard images produced with seismic migration, as in the example from offshore Liberia (Figures 1 and 2). Here, an extensive series of shallow collapsed mass transport complexes (MTCs) with a highly variable velocity structure cause significant scattering and degradation of the seismic signal. To compensate for this and accurately image the target, capturing as much velocity detail as possible in the model is essential. Tomography cannot achieve this, but DM FWI, especially using higher frequencies, can produce models with greater detail and resolution. This allows more accurate imaging of the seismic data and enables the generation of an FWI Image. The added interpretability and geologically-consistent velocity provided by the 40Hz DM FWI, better resolves the MTC complexity and delineates more coherent, deep events on the FWI Image.
The beauty of FWI Imaging lies in its ability to adapt to various geophysical survey scenarios and handle complex subsurface conditions. As a model-matching technique minimizing differences between observed and modeled seismic waveforms, it can reproduce more of the true model’s features that are not always well illuminated by traditional seismic imaging given a survey design, illumination gaps, noise, residual multiples, etc. FWI iteratively builds these features into the model to better match the different types of measured waves. The future that we are starting to see accelerate is the realization of full wavefield scattering analysis of the data, generating models, structural maps, and imaged attributes such as gathers and angle stacks through FWI-based technology without needing or attempting to explicitly follow a traditional processing, model building, and imaging workflow.
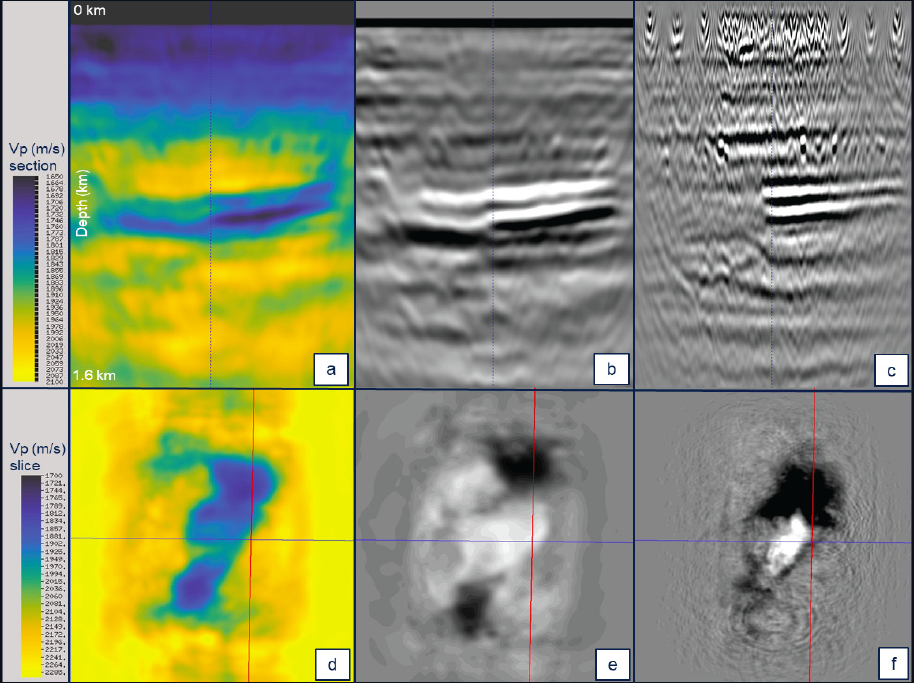
Figure 3 is a realization of the latter. It shows early results from a pilot study in which XHR (eXtended High Resolution) short streamer and sparse OBN data were combined in a hybrid approach to image the CO2 plume at the Sleipner CO2 storage facility offshore Norway. A sparse grid of free-fall nodes was deployed on a 500 m x 525 m grid at an average bathymetry of 80m. The purpose of the node data is to update the current velocity model, while the XHR data is for high-resolution imaging. Here we focus on the value extracted purely from the node data.
Figure 3a shows the velocity model from the 15 Hz DM FWI, which can already identify changes in velocity associated with the CO2 plume, in the Utsira formation (~800 m) and is easily identified as a reduction in p-wave velocity. The spatial distribution of the CO2 can be seen in the depth slices at 900 m. The FWI Image in Figs 3b and 3e shows the plume and improved the shallow illumination. The RTM of the raw hydrophone in Figs 3c and 3f clearly shows the imprint of the node spacing.
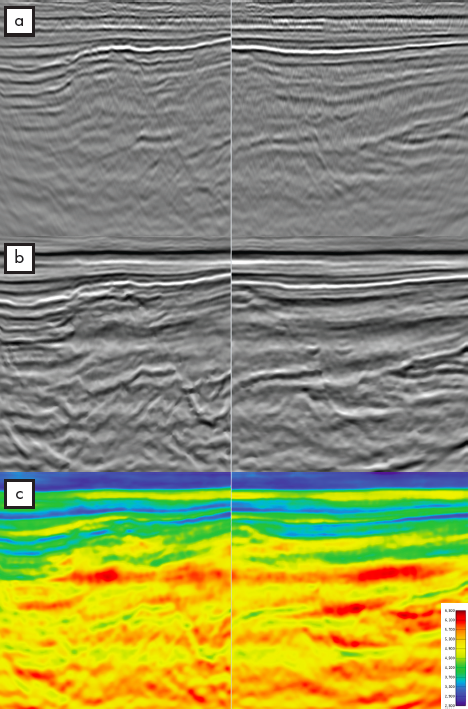
Figure 4 from NOAKA OBN (Ocean Bottom Node) survey also explores FWI Imaging bypassing the traditional linear processing, model building, and imaging workflow. The data shown here is on the west of the Yggdrasil development in the NCS. The project is ongoing. However, sufficient detail has been achieved to produce with 15 Hz DM FWI an FWI image of the deeper Jurassic and older sections without fully processing the input data and running traditional migrations. This FWI Image shows clearer faulting and more interpretable deep events when compared to the equivalent filtered Kirchhoff image. These structures are difficult to image traditionally due to seismic attenuation and complex overburden effects. The production of FWI images at this interim stage in the model-building flow has allowed the interpretation of these deeper events to aid in an early understanding of the geology, also helping to improve the model-building process in terms of quality and turnaround.
The advancements in FWI technology have been remarkable; yet, FWI still faces unrealized opportunities, and it is a thriving area of research and development. Despite these challenges, the future for FWI and FWI Imaging is exciting and full of promise. As demonstrated here, FWI Imaging can accelerate timelines, provide early interpretable products with better penetration and illumination of deeper or complex targets, and final high-detailed images that complement traditional images and have the potential to replace them in the future. This technology has proven especially useful when there are overburden complexities, illumination gaps, and shadow or attenuated zones precluding the effectiveness of traditional seismic migration products. FWI Imaging will continue to improve and deliver added value for derisking of prospects, subsurface understanding and decision-making in an accelerated turnaround.