When liquids-rich parts of the Montney Play in north-east British Columbia emerged and began to be developed in late 2013 and 2014, ‘The Montney’ was thrust on to the scene as one of the most commercially attractive and compelling unconventional prospects in North America. A rush to find where new liquid-rich sweet-spots might emerge along the play ensued as existing and aspiring Montney players started assessing new areas for land acquisition.
Like other unconventional plays, the heterogeneous nature of reservoir quality and liquids content within the Montney creates sweet-spots both laterally and vertically within the section. Using the exceptional open file database of Alberta and British Columbia, and an extensive digital well-log dataset of over 10,000 wells, we aimed to identify potential new liquids sweet-spots in the play using a regional Common Risk Segment Mapping approach. Calibrating from producing wells we have also adapted the method to interpret Estimated Ultimate Recovery (EUR) and Recovery Factor (RF) therefore adding a quantification aspect to the normally qualitative Common Risk Segment Mapping approach.
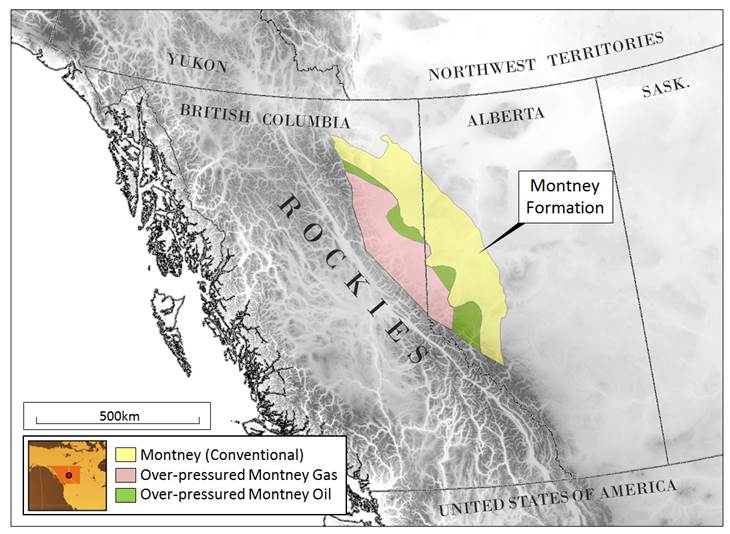
The Montney play is located in the Western Canadian Sedimentary Basin from north-east British Columbia to north-west Alberta.
The result has been the development of a Montney Play Atlas which describes key elements of the play spatially and provides a quantitative description of Montney potential. We believe the quantification approach, which we refer to as Common Recovery Segment Mapping, can be applied to similar pervasive unconventional systems in North America and globally.
Common Risk Segment Mapping is a technique often used in international new venture evaluations as a process which efficiently allows the Geoscientist, or Geoscience team, to understand a basin or play. The technique is very useful for highlighting potential sweet-spots and addressing critical risk elements on a regional or basin-wide scale. Pervasive unconventional hydrocarbon systems, such as the Montney, can also be evaluated using a Common Risk Segment Mapping approach. Recognition of critical play elements within the hydrocarbon system can be ‘stacked’ to identify potential sweet-spots. Furthermore, in pervasive hydrocarbon systems where our definition of ‘Risk’ becomes more synonymous with ‘Recovery’; we can adapt the Common Risk Segment Mapping work-flow to quantify recovery potential. Common Recovery Segment Maps were created using the components of the play which we considered most important to Recovery. Through calibration to existing production, the Common Recovery Segment Maps were subsequently used to create maps of EUR and RF.
The Montney Play
The Montney is a Lower Triassic-aged formation in the Western Canadian Sedimentary Basin extending over 70,000 square miles (182,000 million square kilometres) from north-east British Columbia to north-west Alberta. The siltstones of the Montney Formation form part of the Western Canada ‘Deep Basin’ system, a pervasive hydrocarbon system of organic rich shales and siltstones where tight reservoirs exist in close proximity to matured hydrocarbon-expelling source rocks.
Like the Eagle Ford, Utica Shale, and other unconventional plays in North America, the Montney has dry gas, liquids-rich gas, and oil windows. As the generated hydrocarbons are in-situ, or in very close proximity to the mature source rocks, the system becomes ‘inverted’ from the conventional sense so that water sits above the oil window, which in turn sits above increasingly dryer gas with depth (Figures 1 and 2).
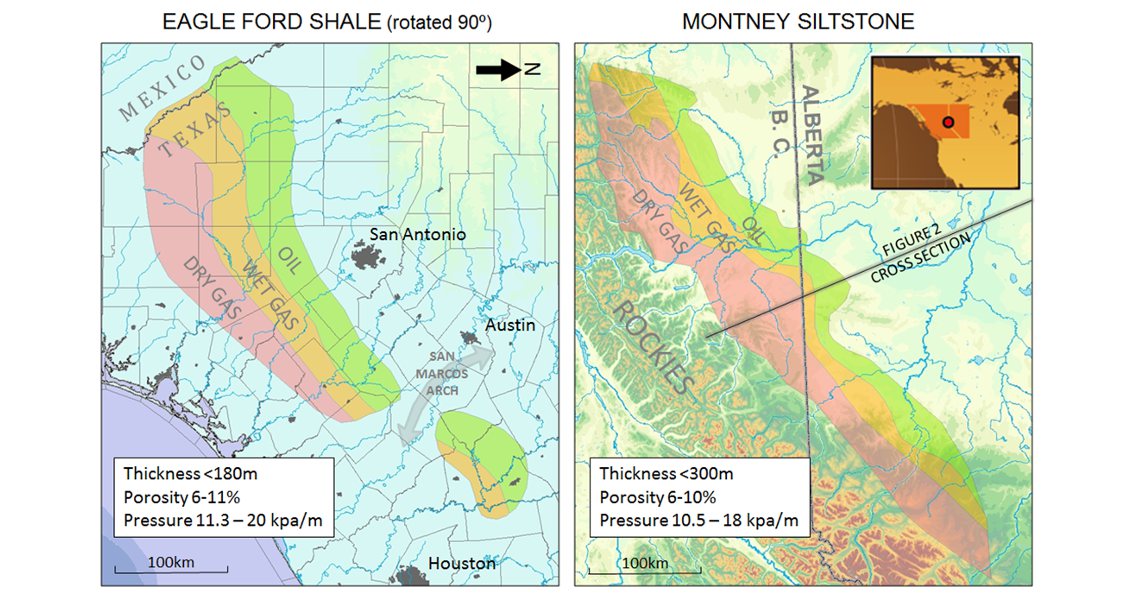
Figure 1: Location of the Montney Siltstone Play (Western Canada) and scale comparison with the Eagle Ford Shale Play (Texas). (Source: Transerv Energy)
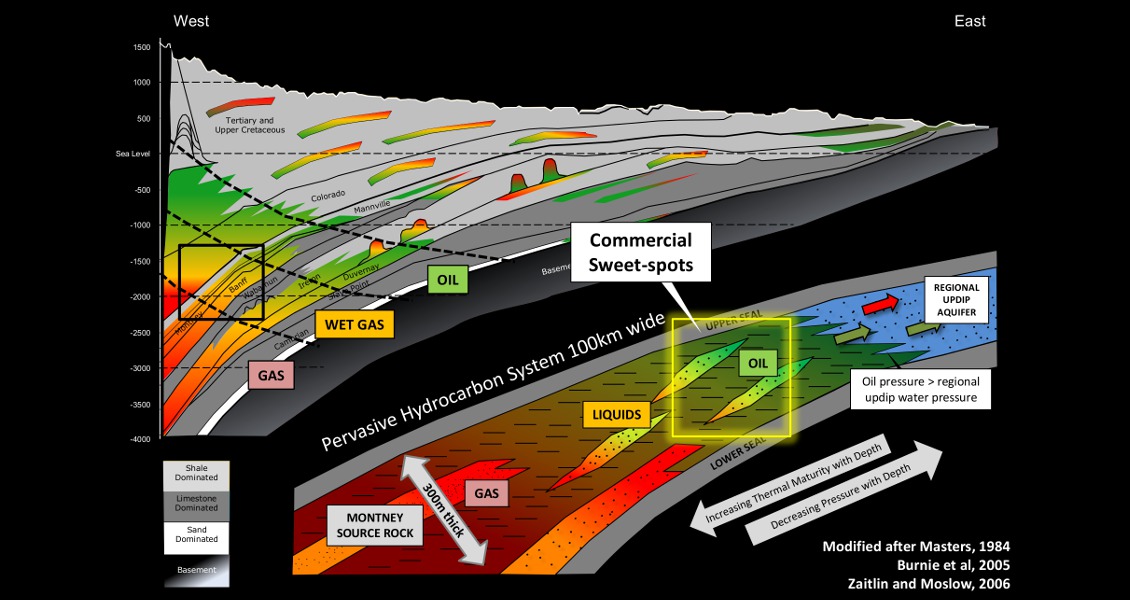
Figure 2: Representative Cross Section across the Western Canadian Sedimentary Basin illustrating the ‘Deep Basin’ hydrocarbon system. (Source: Transerv Energy)
Sweet-spot Mapping
In plays with significant existing well control, such as the Montney, the use of digital well-log data and efficient interpretation techniques becomes imperative in assessing and quantifying potential on a regional scale. The first step in understanding the play was to characterise and isolate the interpreted play components of the system. Studying the 3,500+ horizontal wells currently producing in the play allowed us to develop an understanding of what the key components of the hydrocarbon system are. Proven and potential ‘sweet-spots’ become apparent as the play components are ‘stacked’, as shown in Figure 3.

Figure 3: Sweet-spot mapping for areas of high liquids potential in the Montney Play. The key components mapped spatially included Porosity, Resistivity, Pressure, Liquids-Gas ratio and above ground considerations such as terrain and infrastructure. These individual play elements are ‘stacked’ to begin to qualitatively identify potential liquids rich sweet-spots of the play. (Source: Transerv Energy)
Zone Attribute Analysis and Resource Quantification
A sequence stratigraphic interpretation of the formation allowed us to map each component for individual zones within the Montney. Zone attribute and cross plot analysis for Porosity and Resistivity log data were used to create Net Sand, Average Porosity, and Average Sw maps for each zone. Effective Permeability (Net Pay) was calculated using a cross plot of Log Porosity versus Log Resistivity using Effective Permeability curves described by Wood (2013) and his extensive work calibrating log to core data within the Montney. With all of the play components mapped spatially we were then able to create hydrocarbon in-place maps for each of the zones (Figure 4).
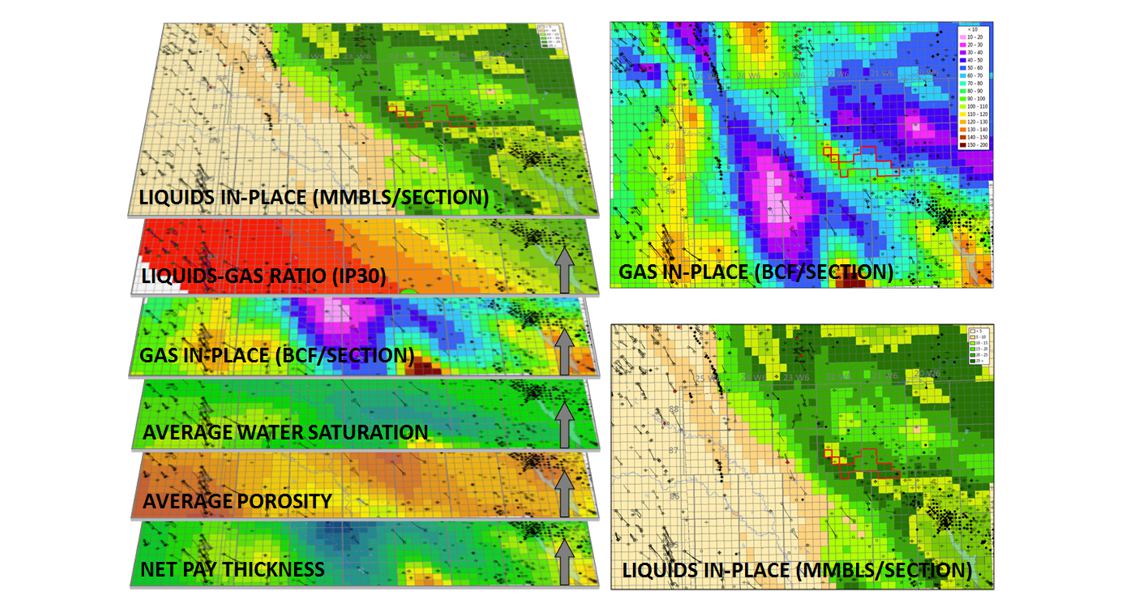
Figure 4: Hydrocarbon in-place mapping for the Montney. The mapping was rasterised to one square mile sections to fit with the acreage tenure system used in Alberta and British Columbia. Example from the Inga area, NE British Columbia. (Source: Transerv Energy)
Common ‘Recovery’ Segment Mapping
Calculating EUR and RF in unconventional plays is challenging because the RF and resultant EUR is dependent on how the resource is developed (i.e. how many wells are anticipated to be drilled to develop the resource). Consequently, the EUR and RF become controlled by non-geological drivers rather than geological drivers. By calibrating the geological drivers to known production, and assuming equivalent development density, completion design, and production results, we can begin to develop an interpretation of how recovery may change spatially due to geological variations. A Common Recovery Segment Map was created using a weighted average of Effective Permeability and Pressure which were considered the primary geological drivers affecting recovery potential. The Common Recovery Segment Map is an interpretation of where we consider production results will vary spatially due to differences in Pressure and/or Effective Permeability (Figure 5).
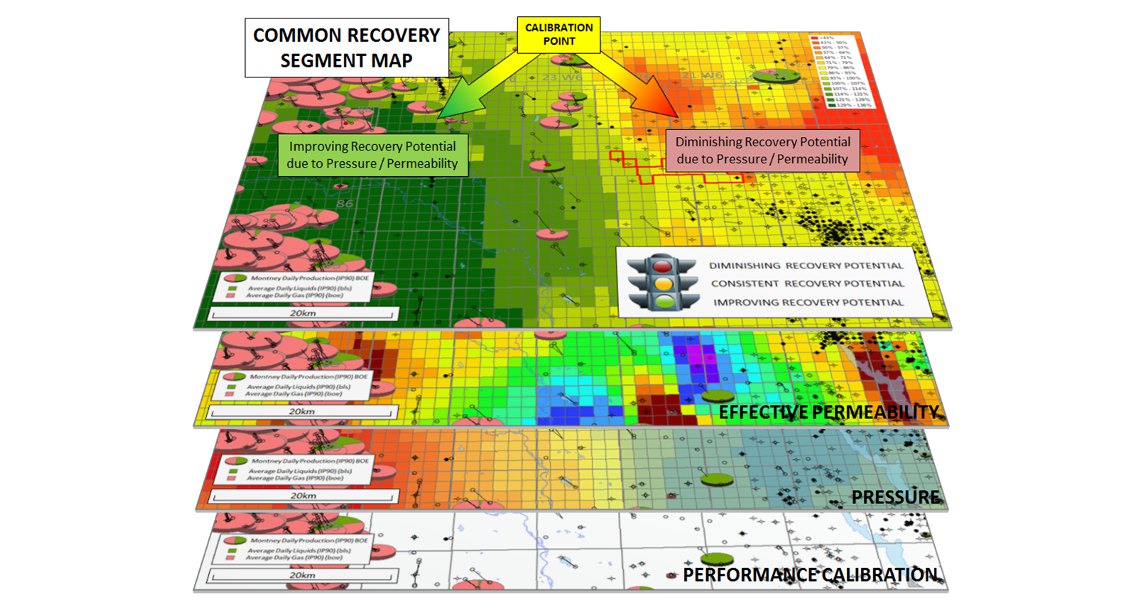
Figure 5: Developing a Common Recovery Segment Map from well performance calibration and the mapping of key geological drivers for recovery. Example from the Inga area, NE British Columbia. (Source: Transerv Energy)
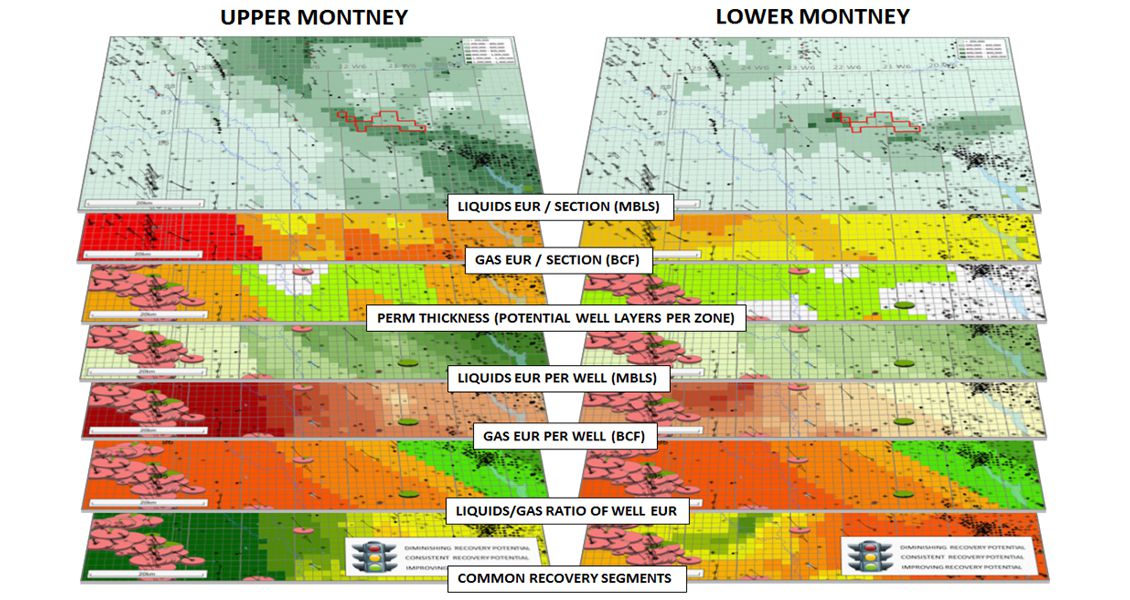
Figure 6: Calculating EUR through Common Recovery Segment Mapping. Example from the Inga area, NE British Columbia. (Source: Transerv Energy)
The calibrated Common Recovery Segment Maps are subsequently used to produce EUR and RF Maps for each zone. Again, using a spatial analysis stacking approach we used our Common Recovery Segment Map to produce Liquids EUR per Well and Gas EUR per Well Maps. The effective permeability mapping provides the guide to how many potential ‘frack’ envelopes, or horizontal well layers, could potentially be developed in each zone. Multiplying the Potential Well Layers per Zone Map with our Liquids and Gas EUR per Well Maps resulted in the Liquids EUR per Section and Gas EUR per Section Maps respectively (Figure 6, above). By dividing the resultant EUR per Section maps with the In-place maps we can back calculate RF. At current development rates in the Montney we are estimating Liquids RF’s in the order of 2% – 3% in the Inga area.
Summary
An adaptation of the Common Risk Segment Mapping approach has been used to identify sweet-spots and quantify potential in the Montney Play. The resource potential of the play has been characterised using calibrated reservoir characteristics and production performance from key wells, multi-attribute cross-plot analysis, and mapping of the key geological play components. The approach combines efficient data manipulation of the Canadian open file data system (including digital well logs) with the Common Risk Segment Mapping method.
The resultant Montney Play Atlas identifies potential sweet-spots and includes full quantification of Montney resource potential which can be used for targeted New Venture assessment, land or asset appraisal, and quantification.
Common ‘Recovery’ Segment Mapping is a solution to the sometimes challenging exercise of estimating EUR and RF in unconventional plays. We believe the technique has application beyond the Montney and could be used in similar pervasive unconventional systems.