It is estimated that there are over 100 salt basins located around the world. To complicate matters, over 35 of those are described as allochthonous sheet basins (an allochthonous sheet is one which has migrated some distance from where it is now found). Some of the more profitable allochthonous sheet basins are the South American Santos, Campos, and Espirito Santo Basins; the western African basins in Angola and Gabon; in eastern Africa the Madagascar Offshore Salt Basins; and in North America the Nova Scotia and Gulf of Mexico Provinces.
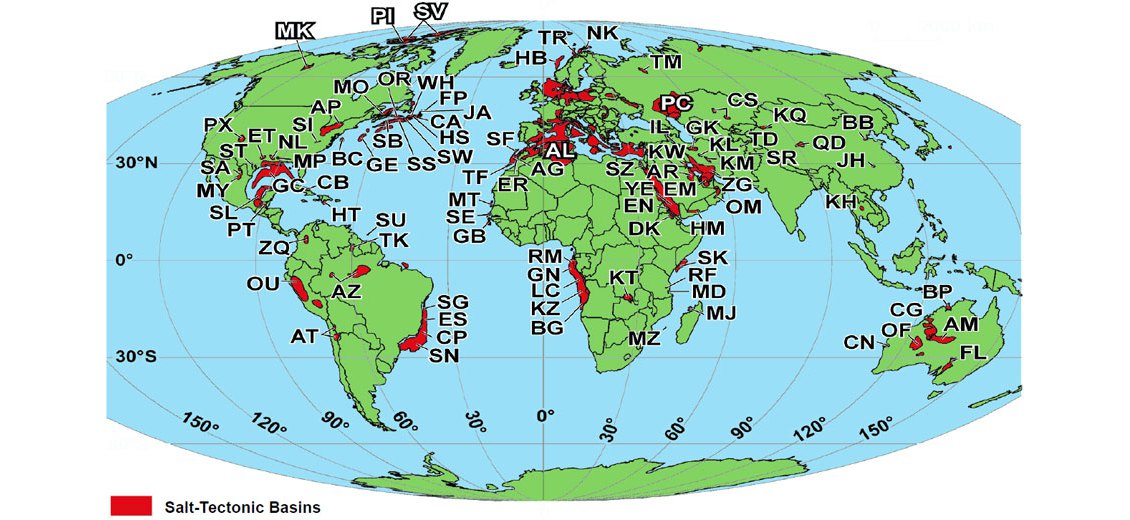
Global map of salt basins. (Source: Hudec and Jackson, 2007)
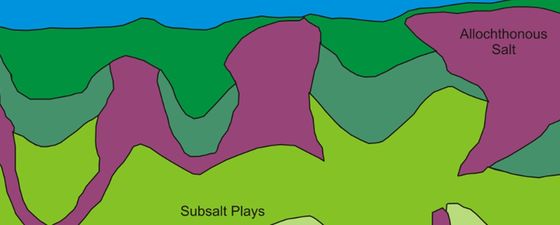
The prospectivity of stratigraphically younger sediments beneath a salt layer has held oil and gas explorationists’ interest for a long time, but engineering technology has encouraged interest in the prospectivity of older sediments beneath salt in recent years. The target of imaging technology has been to enhance the salt/sediment interface to efficiently optimise the drill bit location for subsalt and presalt plays.
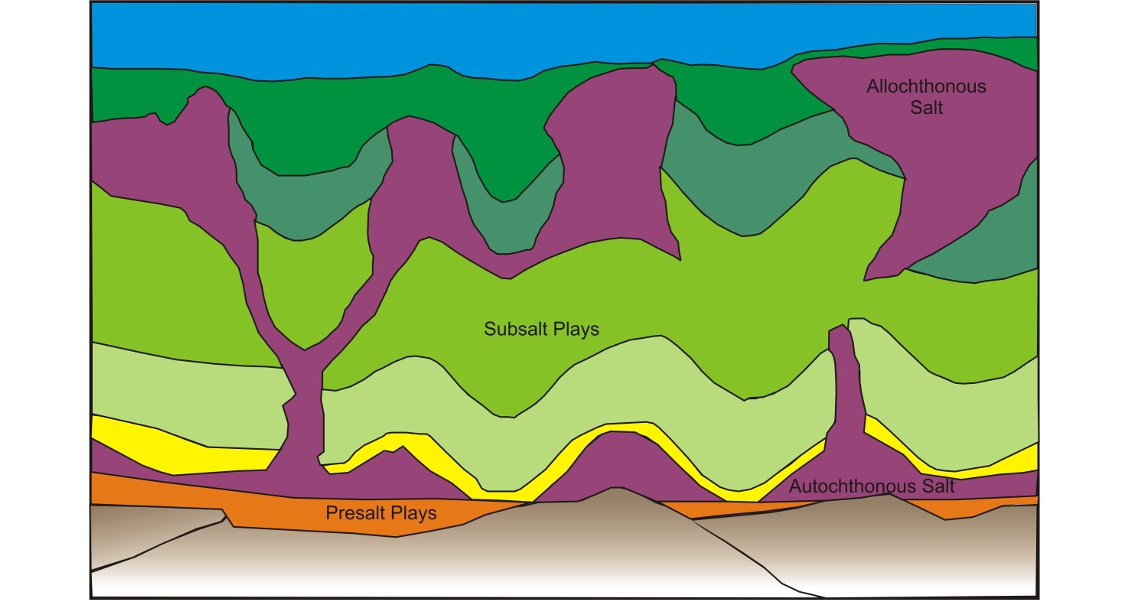
For clarity, a subsalt play is defined as exploring beneath the allochthonous salt layer that overlies stratigraphically younger sediments, while in a presalt play we are exploring beneath the autochthonous salt layer that overlies stratigraphically older sediments. (Source: IGC)
Modelling the Salt
An EarthModel, a geophysical/geological three-dimensional (3D) model of the earth, is best described in terms of its exploration objective. This means that when a geologic target is established, the model is designed to represent the geological environment surrounding the prospective target. Integrated Geophysis Corp. have been building EarthModels since the 1980s. Today they are a product of an integration scheme that encompasses all geophysical and geological information that can be made available for an interpretation of the salt tectonics. The greater number of constraints, the higher confidence in the model reflecting the in-situ situation.
Like seismic geophysicists, the gravity/magnetics (GM) geophysicists continue to develop software and expertise for the refinement of the salt-sediment interface image. The gravity-based EarthModel is a density model derived from sediment interval velocities; it is constrained by well control, magnetic basement structure, sediment sourced magnetic depth estimates and coherent seismic reflection-based layers. Current EarthModels are built with over thirty layers to represent the sedimentary section.
Modelling the salt – a similar model could be built up in a salt basin anywhere in the world.
The video illustrates the capability to visually view results from the 3D EarthModel. The allochthonous salt is coloured white; the autochthonous salt is orange and intermediate salt sills are shown in green. There is an abundance of well control as indicated by the yellow vertical lines. The red dots shown on the surface of the salt are wells that encountered salt. Only one well indicated overhang. The story behind this salt interpretation is that these domes have been prolifically producing from the post-salt section since the 1970s. However, previous to these modelling results, both domes shown in white were considered attached salt diapirs, so the model reveals interesting insights on a well established play.
The Bouguer gravity data used in the creation of this model were from a water bottom survey conducted in 122m of water with a 1,200m spacing. The Total Magnetic Intensity Anomaly data were from an aeromagnetic survey flown at 150m above sea level with a flight line spacing of 0.6 km. Seismic interval velocities were from a 3D seismic survey calibrated with several check shots.
Interpretation Methodology
The interpretation methodology is iterative and interactive. Once the EarthModel is built, the gravity inversions are done on each salt in steps:
- First round – Top Autochthonous Salt: initially a 150m thickness is allowed to thicken or thin based on a residual gravity field. Top Allochthonous Salt in this case was controlled through wells, although usually control is seismic based.
- Second round – Base Allochthonous Salt: allowed to shallow or deepen. This sequence of inversions tests for rooted or detached salt.
The Final Model Difference between Observed and Calculated gravity was RMS = 0.178 mGal with Standard Deviation = 0.177 mGal.
The results of the interpretation scheme will produce various products designed to target the exploration objectives. A variety of digital maps are delivered to the explorationists, as well as the 3D volume results. For example, if the allochthonous salt has significant thickness, the base of the shallow allochthonous salt layer is generally of interest and is usually the initial requested surface. In addition, the corresponding isopach representing the thickness between the top and base of the allochthonous salt has exploration interest due to the fact that seismic resolution diminishes as this layer thickens beyond 1,000m.
The autochthonous salt – the deeper, older in-situ salt – has recently gained exploration interest, with targeted sands lying deeper within the sedimentary section. In many locations the base of the autochthonous salt is initially considered to be the basement surface. Related isopachs of interest would be firstly, the salt thickness between the top and base of the autochthonous salt, and secondly the inter-salt sediment isopach defined as the sediment thickness between base of allochthonous (shallow) salt layer to top of autochthonous (deeper, older) salt layer.
The geometry that salt intrusion takes is non-predictable yet measurable. How the salt structures influence oil and gas migration pathways is always being studied. Understanding and refining salt features with confidence has significant impact on the prospectivity of a specific drill site, which is why this sort of modeling is so important.