Mud diapirs have long been enigmatic structures in the subsurface. With older seismic data being of insufficient resolution to properly map them, companies often took a careful approach when it comes to drilling close. This is primarily related to the observation that the mud diapirs are often associated with overpressures.
The Tertiary basin in Brunei is a good example of this phenomenon.
Peter Henneberg, who worked in the country for seven years, was involved in drilling a well that took him a lot of convincing of management, because it was getting close to what was just before mapped as a mud diapir. For a long time though, it wasn’t even known that it was. But it was considered a no-go zone anyway, because a well had been drilled into it had experienced overpressures and was rather shaly.
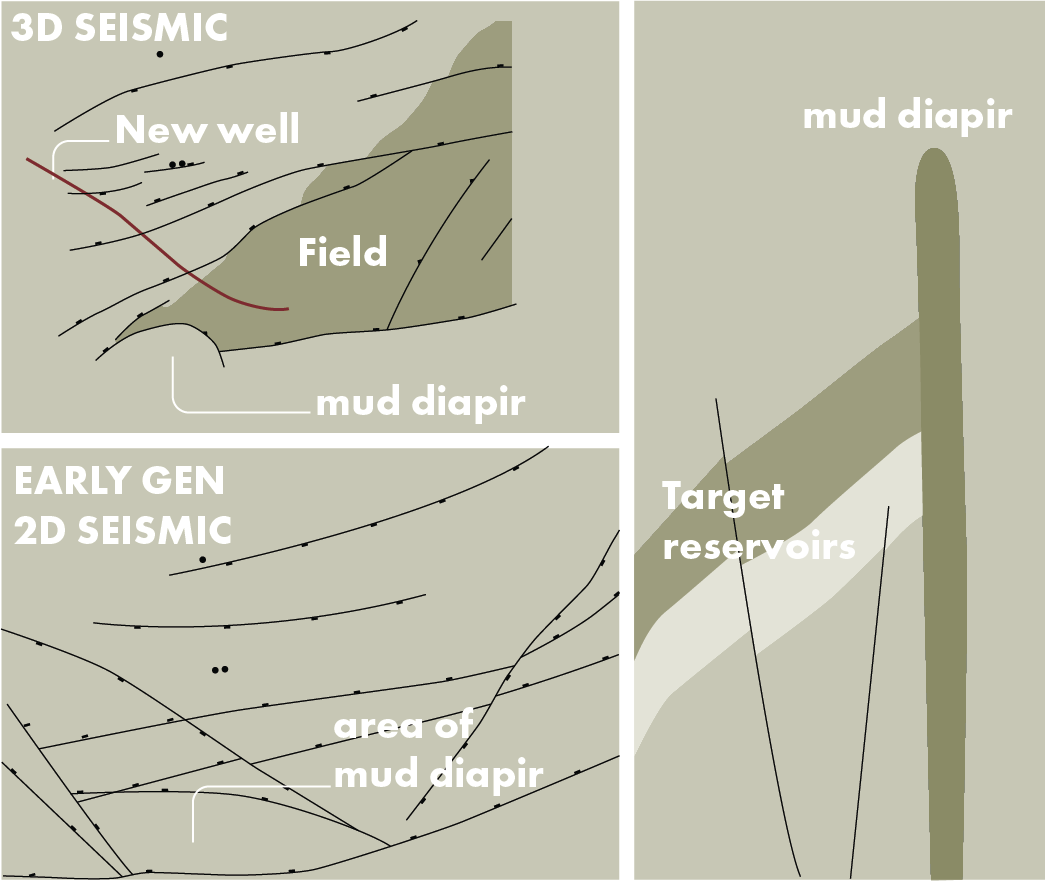
“Early maps of the field based on 2D seismic data showed a zone that was surrounded by a series of faults, as if it was an isolated fault block,” says Peter. It shows how geologists tried to solve the pressure difference between the main field and in the well that drilled the diapir.
Only when 3D seismic volumes became available, the contours of the mud diapirs became more obvious. In time slices, circular zones can be seen, which are mostly transparent, but with clear higher impedance slivers in it, interpreted as isolated overpressured sands.
“It is these sands that are the problem,” says Peter. “They have kept the pressures from deeper down, and due to their isolated nature, they still record higher pressures than the sands in the reservoirs juxtaposed against the diapir at the same depth. However, we did observe that some pressure dissipation must have occurred though.”
The easy bits first
The oilfield Peter worked on was large, and because there were plenty of areas to go after for oil production first, the “difficult” high-pressure zone was avoided for a long time. Until the moment that even this area appeared on the radar, invariably driven by the depletion of the easy parts of the field. But it was only the radar of the production geologist the area appeared at, not so much on the management’s radar because of the cloud of overpressure issues hanging over the area. It took some convincing, or maybe to word it differently: Education.
As with so many things, once it is possible to explain why it happens, it becomes much more feasible to find ways to mitigate against the potential issue. And the mud diapirs were a classic example of that.
Peter took the matter to heart and, having studied similar structures elsewhere, was clearly being able to show that the zones of overpressure tend to be confined to the diapir itself. This meant that the extent of overpressure could be mapped, which de-risked the areas immediately around it. That was the area Peter had in mind targeting, because he saw that a significant undrained compartment must be present there. The existing production wells in the field were simply too far away to have properly done that.
Into the field
In order to make things easier to understand, Peter even organized a field trip for management to show how a diapir looks like in outcrop and that the sands intercalated tend to be isolated and unconnected to the main reservoirs outside the diapir. This helped, and slowly the idea to drill a new well became more concrete. The continued depletion of the main field helped make the case as well.
Then came the question how to drill the well, what trajectory it should have?
It was decided to drill the well parallel to the sides of the diapir, in an attempt to tap into as many compartments that may have arisen due to faults radiating away from the diapir. These faults are commonly found around these structures, and have a tendency to create compartmentalization of individual fault blocks.
After all, the well was drilled successfully, and a 2 million barrel resource could be produced safely. No overpressures were observed, and all the reservoirs known from the wells at a distance were found. This clearly demonstrated the value of the seismic data and the value of applying a valid model to explain overpressures observed at times when it all seemed so obscure.