A novel solution tailored for the Barents Sea
An unusual acquisition configuration resolves the challenges of the Barents Sea through an innovative combination of streamer setup and advanced imaging technologies.
The Barents Sea is one of the remaining frontier exploration areas on the Norwegian Continental Shelf (NCS); it accounts for around half of the undiscovered resources on the NCS, according to the Norwegian Petroleum Directorate. In order to fully exploit the exploration potential and to understand these frontier areas, high quality seismic data are required. PGS has added a unique ultra-high density 3D seismic dataset to their Barents Sea data library, utilising an innovative acquisition solution to enable FWI and high resolution imaging of this complex area.
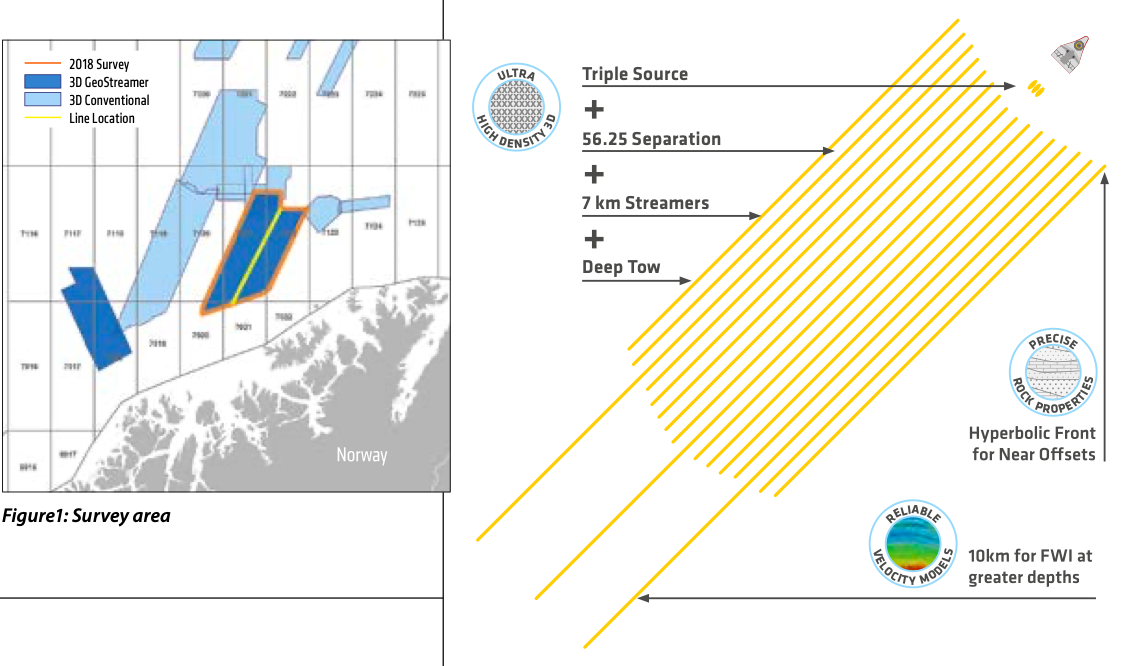
The GeoStreamer survey was acquired during the summer season of 2018 and combined a high-density 16 x 56.25m streamer spread with a triple-source configuration. This resulted in a nominal acquisition bin size of 6.25 x 9.375m, allowing accurate imaging of frequencies as high as 200 Hz. For velocity model building using FWI, three out of the 16 streamers were extended from 7 km to 10 km, which allowed the recording of refracted energy generated from deeper geological layers. The survey covers an area of approximately 4,100 km2 including parts of the Finnmark Platform and the Hammerfest Basin (Figure 1).
Great potential
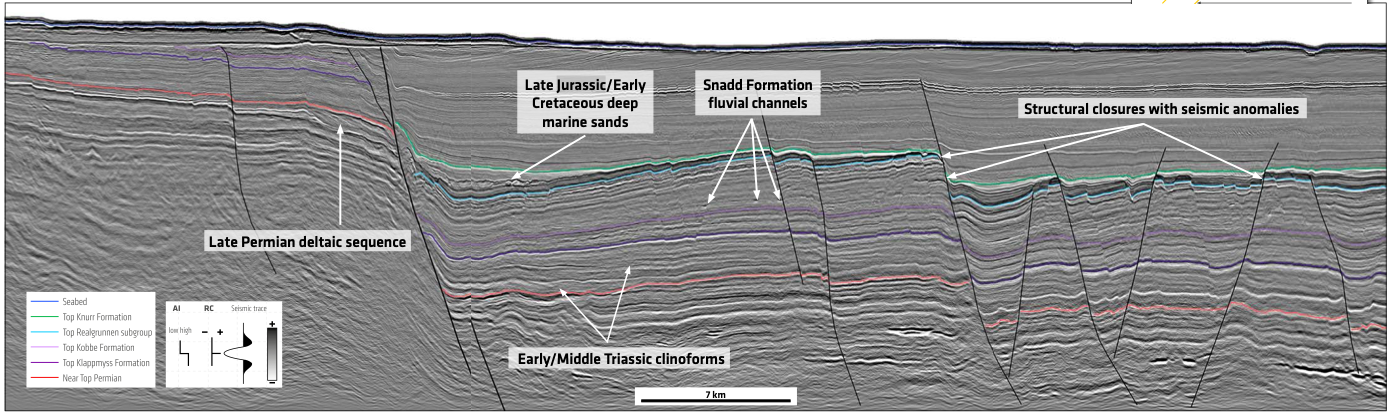
The Finnmark Platform is delineated from the Hammerfest Basin by the heavily displaced Troms-Finnmark Fault Complex, giving rise to large lateral velocity changes. On the Finnmark Platform a thick succession of Late Permian Tempelfjorden Group was deposited, consisting of alternating beds of sandstone/siltstone/claystone (Ørret Formation) and cherty limestone (Røye Formation). On the southern margin of the Hammerfest Basin there is evidence of a continuation of this Late Permian succession pinching out further north into the basin where a more carbonate-rich depositional environment is evident. Early and Middle Triassic clinoform beds and Late Triassic fluvial channel deposition are present, along with shallow marine sandstones of the Early to Middle Jurassic. There are also potential Late Jurassic and Early Cretaceous deep marine sandstones deposited along the margin of the Hammerfest Basin.
The stratigraphic units that have been identified as the key target areas for hydrocarbon plays are the shallow Kapp Toscana Group sandstones, and the deeper, potentially karstified, carbonates of Carboniferous/Permian age. Proven discoveries made in both geological regimes show the great potential of this area in the south-western Barents Sea. Nevertheless, a complex, heterogeneous geology and different target depths demand an appropriate acquisition solution. In order to produce an accurate, high-resolution image of the subsurface which reveals small-scale geological features and improves understanding of the geology, an accurate velocity model for pre-stack depth migration is required.
Refraction FWI for detailed velocity models
In the Barents Sea, the combination of relatively shallow water depths and a hard, rugose sea floor creates a tremendous amount of noise. This complicates the use of reflections in FWI for velocity updates. On the other hand, this geological setting generates particularly strong and stable refractions (diving waves) and refraction-based FWI has been widely used to create detailed velocity models in the Barents Sea. However, model updates were limited to shallow depths due to the lack of recorded long offsets. With the unique, long offset streamer configuration deployed for this survey, a sufficient number of diving waves from deeper geological layers were recorded, which resulted in an extension of the model update depth from approximately 2.5 to 4 km depth. With a maximum frequency of 15 Hz for the FWI, a large amount of detail is included in the velocity model.
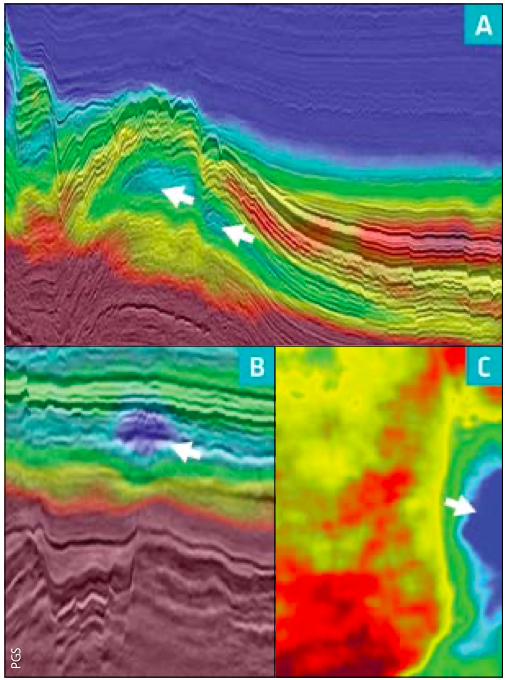
An example of the FWI velocity model around the Goliat oil field is shown in Figure 2. At the reservoir level, the model shows a clear low velocity anomaly, potentially indicating a porous and hydrocarbon-filled sand body. In the shallow overburden above the reservoir, a gas cloud can be clearly identified in the velocity model correlating well with an amplitude brightening on the underlying stack. On the velocity depth slice, it is obvious how FWI clearly delineates the actual extent of the gas cloud above parts of the Goliat field. The details and large velocity contrasts captured in the depth velocity model allow accurate imaging of the subsurface without being biased by distortion effects caused by the shallow heterogeneous overburden. Both the velocities and the resulting imaging provide further insight into the reservoir.
Detecting potential hydrocarbon plays in the Barents Sea
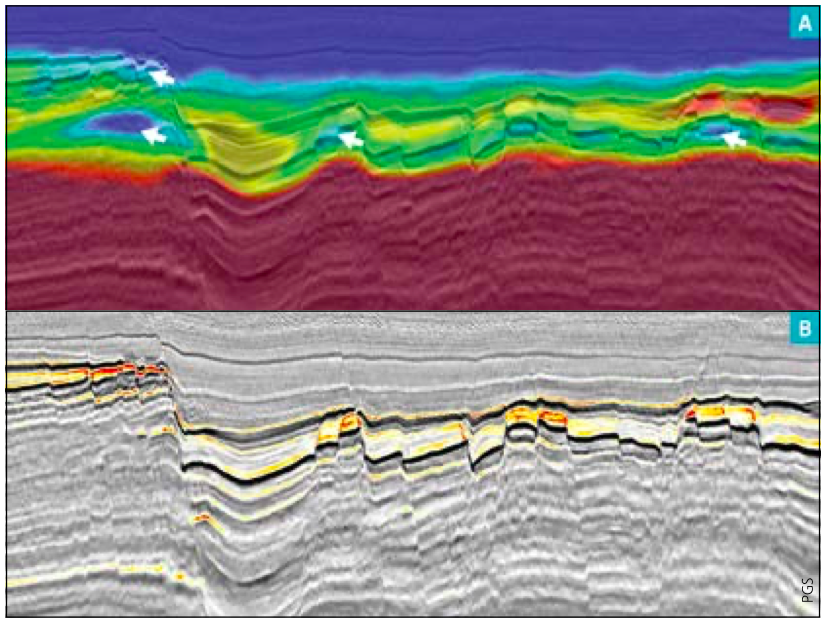
FWI velocity updates do not just provide a migration velocity model to enable accurate imaging of the subsurface; the results around the Goliat field demonstrate the ability of FWI to capture small scale velocity anomalies which are potentially associated with hydrocarbon accumulations. Figure 3 highlights a section around Top Realgrunnen at a depth of around 2.5 km (zoom of foldout line on previous pages). Within each fault block, low velocity zones are present at the top of the structure. These anomalous velocities correlate well with the seismic amplitude brightening and highlight areas of a potential increase in fluid accumulation.
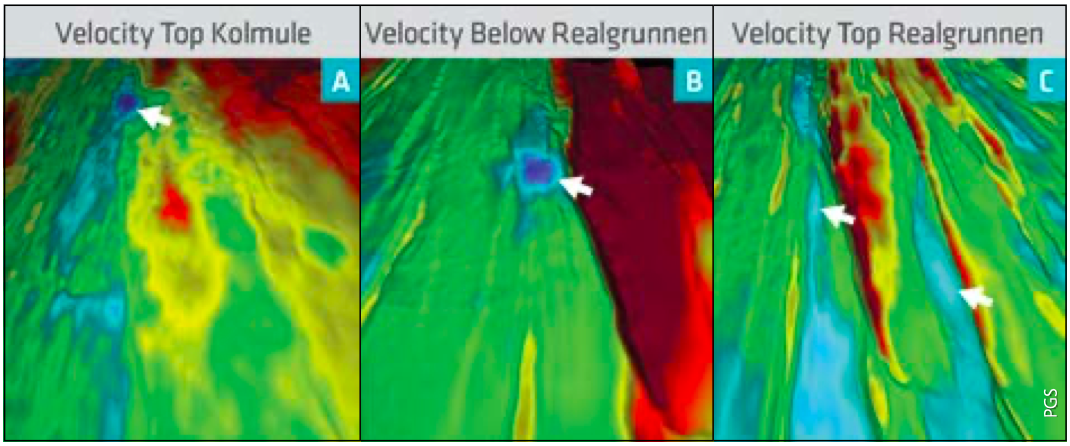
Figure 4 shows velocity extractions at different stratigraphic units, including Top Kolmule and Top Realgrunnen. These velocity attribute maps highlight the spatial velocity distribution and, in combination with the topographic relief, several areas of anomalous low velocity zones can be identified which correlate well with potential structural closures. The detail the FWI velocity model provides can assist in identifying new hydrocarbon plays. Thanks to the additional long offset streamers and therefore increased model depth, detailed attribute maps can be extracted for both shallow and deep target horizons.
Deriving attributes from FWI velocities
To improve the understanding of a potential reservoir, the FWI results can be incorporated into a quantitative interpretation (QI) workflow. In the absence of any direct well information, the detailed FWI velocity model can be utilised as a low frequency model within a seismic acoustic inversion scheme. The long tails in the acquisition configuration enable deeper refraction FWI, filling the gap between 0 Hz and the lowest frequencies provided by conventional seismic, and allows the performance of absolute acoustic impedance inversion.
Furthermore, the velocities derived from FWI include valuable information in terms of reservoir characterisation. Low velocities can be an indication for porous sands, karstified carbonates, hydrocarbons or high porosity areas in general.
PGS considered imaging needs when designing this acquisition configuration so that the best solution was provided to resolve the challenges of the Barents Sea using an innovative combination of streamer setup and advanced imaging technologies.
Further reading
Some recommended GEO ExPro articles relating to seismic acquisition in the Barents Sea by PGS:
First Look at High Resolution 3D Multicomponent Seismic Data from the Barents Sea
Rune Sakariassen, Nicola O’Dowd and Sören Naumann; PGS
Brand new, high resolution, 3D multicomponent seismic data from PGS has enhanced the geological understanding of one of the last remaining frontier basins in the far south-west Barents Sea.