In recent years, more oil and gas reserves have been added to the world’s proven hydrocarbon endowment through reserves growth than through discovery. Opportunities for significant discoveries in simple geological settings or hospitable locales have greatly diminished.
With the consequent greater emphasis on improving oil and gas recovery rates in existing fields, it is more critical than ever to obtain a clear picture of the subsurface to optimize oil and gas reservoir management. The key parameters in imaging the subsurface are the quality of resolution and the diversity of measurement methods.
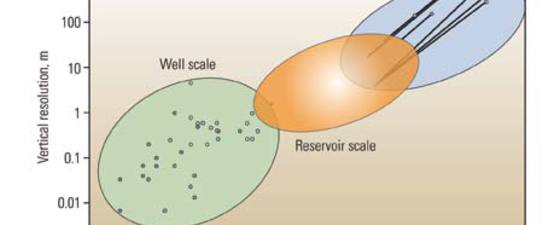
Well log data provide a variety of high-resolution measurements of the formation but only in close proximity to the wellbore. Surface seismic, gravity, and electromagnetics technologies are measurements that can image large lateral areas between wells but with limited vertical resolution compared with well log data. To close this “deep-reading gap” by providing subsurface data between the two groups of existing measurements, the oil and gas industry requires technologies that can provide higher-resolution measurements than surface data and deeper investigation than well logs
Vertical seismic profiling (VSP), borehole gravity, cross-well pressure pulses, tracers, cross-well seismic technology, cross-well electromagnetics, and microseismicity are among the technologies under consideration that may provide information to close the deep-reading gap. However, the first four approaches have their own limitations:
• VSP entails gathering seismic data by placing receivers in a borehole at several successive depths and directing source energy to it from a fixed point on the surface. VSP is a mature technology that can provide greater resolution than surface seismic data can and deeper formation penetration than well logs can but is still limited to the wellbore vicinity.
• Cross-well pressure pulses is a mature technology for determining reservoir connectivity and compartmentalization but less applicable for fluid front monitoring between wells.
• Tracers have been used in the oil and gas industry for decades—whether radioactive or chemical, gas or liquid—to determine residual oil saturation. A limitation common to all conventional tracer methods is that they don’t yield direct information until detected in production wells, which could take months or even years after injection.
Cross-well electromagnetics, cross-well seismic and microseismic technologies are three relatively new commercial technologies that have seen marked improvement in recent years, generating increasingly robust results in imaging the subsurface.
This article will outline the technologies, data acquisition methods, and application of these three promising deep-reading technologies in respective case studies. The integration of the technologies and how they complement each other for enhanced reservoir description in the interwell space also will be described.
Cross-well Seismic
 Cross-well seismic data acquisition. The source is moved at regular intervals and then re-leased at each position. The signal is recorded by an array of receivers placed in another well. © SchlumbergerGathering, processing and analyzing surface seismic data is a proven, key technology for imaging the subsurface in hydrocarbon exploration and production. The vertical subsurface resolution is, however, limited. VSP acquisition improves vertical seismic resolution by placing the receivers in the wellbore. Shortening the ray path and limiting the signal attenuation greatly improves resolution, but the subsurface coverage is limited to the wellbore vicinity.
However, placing both receivers and source energy in multiple individual wells to image the interwell space can significantly enhance both vertical resolution and horizontal subsurface coverage.
Cross-well seismic data provide vertical resolution imaging of the reservoir layers of up to 100 times better than surface seismic data. Both direct arrival and reflected information can be processed to provide a detailed subsurface image of the reservoir or zone of interest. The cross-well seismic data improve the understanding of the reservoir geometry and rock properties from the reflection seismogram and details of fluid migration, including steam chambers, from both the velocity tomography and reflection seismogram. By repeating acquisition of cross-well seismic data, it is possible to map in detail fluid migration over time.
Source
 Comparison of cross-well seismic data and surface seismic data. The comparison illustrates the substantially increased cross-well seismic resolution. © SchlumbergerThe source for acquiring cross-well seismic data can be piezoelectric or magnetically clamped. Piezoelectric source technology has been in use for more than a decade and continues to be a very good source for generating high frequencies (100 Hz–2,500 Hz). This approach uses multiple piezoceramic radiator elements coupled into several radiating arrays that are swept by surface-programmable source controllers. These arrays have radiation patterns optimized for cross-well seismic usage. Its high duty-cycle rates and the fact that the piezoelectric source does not require clamping in the wellbore mean that data can be acquired rapidly without having to stop the source at each acquisition level.
A more recent design for a magnetically clamped source is intended specifically for greater-attenuating formations and longer well offsets. Operating at a lower frequency range (30 Hz–800 Hz), this source produces about 20 dB more amplitude than the piezoelectric source. It also produces direct compressional and shear energy waves, allowing for advanced wavefield analysis. Both sources are borehole friendly and distribute the energy produced over an area in the wellbore that is large enough not to cause damage to the casing or cement.
The cross-well seismic data acquisition is conducted by deploying an array of receivers in one well and a source in another well. The source is moved up at regular intervals, emitting a controlled pulse measured by the receiver array in the other well and then moved to the next location. The goal is to illuminate as much of the subsurface as possible through the aperture of the source locations and range of receiver locations. In a typical acquisition both source and receivers are placed at the base of the reservoir or zone of interest. The source is raised and pulsed until the entire zone is imaged at that receiver station. The receivers are raised to the next station, the source is lowered to the base of the reservoir, and the pulsing process is repeated. Once complete, several fans of raw data are acquired and processed. The base of the reservoir image is filled in using reflection tomography.
Case Study
 Cross-well electromagnetics data acquisition. The transmitter traverses the logging interval while continuously propagating the primary electromagnetic field. The receiver collects the primary and secondary (formation) fields. © SchlumbergerIn a case study involving the Cretaceous McMurray formation in the Western Canadian Sedimentary Basin, efforts were made to identify thin shale laminations that were potential permeability barriers in the reservoir and to provide time-lapse evaluation of steam movement in a steam-assisted gravity drainage project.
Six cross-well seismic sections were acquired to provide a high-resolution characterization of the McMurray reservoir. The processed data provided reflection images at a resolution of 2 meters or better in the McMurray formation, detected lateral and vertical facies changes and shale stringers, and indicated severe reservoir heterogeneities, all of which helped to more accurately characterize the reservoir and better predict reservoir performance under thermal operations. A comparison with conventional seismic data shows the substantial improvement of the cross-well seismic data resolution that makes it possible to interpret previously unknown faults.
Cross-well Electromagnetics
 Time-lapse pilot results. The time-lapse cross-well electromagnetic surveys clearly image a low-resistivity volume associated with the water injection. The cross-well electromagnetic images indicate that the injected water has spread approximately halfway between the wells but has largely remained within the injected reservoir units. © SchlumbergerUntil now, logging has measured only within the borehole and near-well environment, imaging only the rock surface in terms of providing detailed reservoir information. Seismic imaging provides guidance for interpolating information between and beyond wells, but it delivers relatively low vertical resolution, and there are often uncertainties in the tie between surface seismic and well data. Cross-well electromagnetics expands the scale investigated by resistivity logging to the reservoir level for monitoring fluid distribution and movement, which are critical factors for successful reservoir management.
The cross-well electromagnetics acquisition system consists of a transmitter tool deployed in one well and a receiver tool deployed in a second well.
With such a system, the two wells can be located up to 1,000 meters apart, depending on how the wells were completed and the formation and resistivity contrasts. A global positioning system is used for synchronized communication of the tools, which are conveyed on standard wireline equipment.
The 9.88-meter transmitter antenna used in the source borehole is a vertical-axis, magnetically permeable core wrapped with several hundred turns of wire and driven to broadcast a continuous sinusoidal signal at user-defined frequencies that depend on the particular borehole environment. The transmitter signal induces electrical currents to flow in the formation between the wells. The currents, in turn, induce a secondary magnetic field related to the electrical resistivity of the rock where they are flowing.
At the receiver borehole, induction coil receivers detect the electromagnetic field generated by the transmitter (primary field) as well as the magnetic field from the induced currents (secondary field). The receiver tool comprises an array of four receiver coils, which reduce logging time by simultaneously recording the signals.
For each receiver station, the transmitter in the other well is moved between the depths of interest while continuously broadcasting. To reduce noise, the incoming signals are averaged several hundred times per station. Depending on the amount of averaging and frequency of operation, the transmitter logging speed ranges from 600 to 1,520 meters per hour. Once a complete transmitter traverse, or profile, is collected for a receiver position, the receiver tool is repositioned and the process repeated.
Logging is conducted at the locations of the moving transmitter. The operation is controlled via laptop computer at a logging surface station and requires a wireline field unit and mast or crane at each of the two wells.
Inversion of cross-well electromagnetic data to generate interwell resistivity images follows a workflow that integrates existing reservoir information. The field data is compiled in a seismic-to-simulation workflow to create a field model of possible fluid movement scenarios. Simulation based on the scenarios then ensures that the appropriate measurement sensitivity is applied.
Following the cross-well electromagnetic survey, the interwell resistivity distributions are exported back to the reservoir model for data integration and interpretation to provide critical insight for tracking fluids such as water and steam, detecting bypassed pay and characterizing the reservoir.
Pilot study
 The final processed microseismic events in relation to the well trajectory. The red dots are the first phase of the well stimulation, the green dots are the second phase, and the yellow dots are the third and final phase. © Schlumberger
 A model of the microseismic array design. © Schlumberger
 Deployment methods for microseismic sensing systems. © SchlumbergerPeripheral waterflooding at a large onshore oil field in the United Arab Emirates has typically bypassed layers with lower permeability. To address this issue and develop a more optimized reservoir management strategy, a pilot was established in 2007 to design and test strategies for recovering any remaining oil.
The pilot features three chrome-cased observation wells surrounding a horizontal water injector, which was completed in a number of reservoir units. Five thousand barrels of high-salinity brine are injected into this formation daily with the expectation that breakthrough will occur in the producers within seven years. The pilot’s objectives are to determine sweep and conformance in the reservoir to estimate recovery and improve waterflood design. The benefits of cross-well electromagnetics monitoring are that the fluid movement can be tracked between wells and the flow observed within months, or long before it would be observed in any wells. This allows adjusting parameters to optimize performance during the pilot operation.
Baseline field data were collected in 2007, and time-lapse data sets were collected in June and December 2008, corresponding to six months and one year, respectively, after the initiation of water injection. The pilot’s injected brine as of time lapse 2 has not broken out of the section as peripheral flooding seems to have done in the past and continues to do so even now.
The results are being used to develop a static and dynamic simulation model of the pilot area. The dynamic models will be used to predict the pilot behavior and to help develop designs for other pattern waterflood pilots within the field.
Microseismicity
Microseismicity provides continuous real-time information about the stress changes in the reservoir away from and between wells that are caused by injection and production operations. Induced fractures can be mapped, and these changes in both space and time provide a unique insight into the effect of pressure change on the lithologic framework and associated movement of reservoir fluids.
In connection with the injection of proppants for hydraulic fracture monitoring, microseismicity is used to monitor the induced fractures in real time. To monitor the reservoir when injecting H2S or CO2, induced microseismicity can potentially indicate if the cap rock is being breached or faults are being reactivated that would create a leakage path to the surface. When hydrocarbons are being produced from a reservoir, induced microseismicity may indicate which part of the reservoir has pressure communication and is producing and thus may highlight potential areas of bypassed hydrocarbons.
Microseismic events generally have low magnitude (Mw) from 1 to –4. Recording microseismicity requires a microseismic sensing system that can consistently record high-fidelity, low-noise data and maximize the located event population. Surface acquisition using sensors on the surface and buried in shallow holes is possible, especially onshore. However, issues with a noisy surface environment and with too great a distance to the reservoir to record the low-magnitude microseismic events may limit the application of these two deployment methods.
To bring the sensors closer to the reservoir to better record the low-magnitude microseismic events, the sensors can be positioned in a well. But this requires placement of a microseimic sensing system that does not interfere with field operations and that mitigates any risk to well integrity. When monitor wells are available for installing microseismic sensing systems, this is not an issue. The microseismic sensing system can either be cemented in place for abandoned wells or left for short- or long-term monitoring and then retrieved. It is also possible to locate the sensors behind casing, which will influence the well completion because the casing diameter increases and the casing size has to be constant down to the sensor deployment depth.
The limited availability of monitoring wells, especially in the oil field environment and particularly offshore, has meant that without an active monitoring well solution, microseismic monitoring most likely will remain a niche technology for reservoir management. However, a tubing-deployed device, released downhole to clamp against the casing for the sensors to be decoupled from the flow noise, makes recording microseismicity during well operation possible. Furthermore, a new design of geophones with a tetrahedral arrangement of four sensors at a 109° angle provides both improved signal fidelity and long-term reliability if one sensor fails. Deployment methods are therefore now available for all types of microseismic acquisitions. To design the microseismic sensing system, the array design is modeled to ensure that the induced microseismicity is recorded.
Case study
To calculate the location of the recorded microseismic events, source and magnitude, a velocity model also was developed for both compressional (Vp) and shear wave (Vs) parameters using available velocity information from well logs, surface seismic, and other data sources.
Microseismicity was recorded during a three-step acid stimulation job, and the data were processed. A single well was used for monitoring during the acid stimulation, which at the reservoir depth of about 15,000 ft was highly deviated. A two-level, tubing-deployed system that clamped the sensors to the casing recorded microseismicity during flow in the tubing. Good-quality microseismic events were detected and located with effective sensor coupling to the casing and a low noise floor providing reliable results and interpretable microseismic events.
The development over time of the microseismic events associated with the well stimulation indicates a pathway for the acid fluids away from the reservoir section, reducing the impact of the well stimulation. After 2 months the microseismic sensing system was successfully retrieved, and a new stimulation strategy is being considered. The microseismicity highlighted a previously unknown permeable zone, which has been included in the fracture network model and static model.
Imaging the Interwell Space
 Measurement integration overview. Results from the three deep-reading technologies complement each other and provide important input to improving reservoir management. © SchlumbergerBecause the acquisition equipment is deployed in the well and is more focused on the reservoir than other techniques, deep-reading technologies image the interwell space at higher resolution and provide a new scale of characterization that previously was not possible. Each of the deep-reading technologies can be used to populate the static reservoir model by adding reservoir properties understood at a higher resolution.
Cross-well seismic sections provide calibration points for the reservoir geometry, highlighting smaller faults and internal heterogeneities that control the flow of reservoir fluids. Both the fracture network and static model become more accurate. With the acquisition of time-lapse cross-well seismic data, the tomographic velocity model can in many cases be related to fluid changes and used to monitor the fluid front movement and to identify bypassed hydrocarbons. The time-lapse data can be used to update the dynamic reservoir model.
Cross-well electromagnetics sections provide am apparent saturation measurement, which, with the acquisition of time-lapse data, can be used to directly monitor the fluid front. The electromagnetics saturation measurement is more direct than what is derived from the cross-well seismic images, but it requires sufficient resistivity differences between the hydrocarbons and formation water.
Microseismic data provide insight into the geomechanical behavior of the reservoir due to production and injection. The microseismic events can provide information about the fractures and be used to update the fracture network model. Pore pressure changes from moving reservoir fluids may also provide insight into the moving fluid front.
The deep-reading results are complementary. A velocity model is required to accurately locate microseismic events. Velocity tomography from the cross-well seismic may provide additional velocity information in the interwell space that is not available from other sources. Microseismic events could indicate fracturing or the activation of smaller faults that may be visible only on high-resolution cross-well seismic sections. The interpretation of the fluid front from any of the three deep-reading technologies becomes more accurate with the detailed reservoir geometry provided by the cross-well seismic section.
Fluid front monitoring is important to optimize reservoir production and locate bypassed oil. Cross-well electromagnetics provides a direct means of calculating apparent fluid saturation changes, which can be better understood in terms of structurally guided flow and verified by the tomographic velocity changes from the cross-well seismic method and potentially the induced microseismicity through changes in pore pressure.
If time-lapse cross-well seismic and cross-well electromagnetics data are acquired, both direct and indirect monitoring of the fluid front is possible, allowing an update of a dynamic reservoir model. The technologies provide important information individually, but the technologies can also reinforce each other through integration both during data processing and interpretation. The final results become more accurate and reliable and can be better verified.
Improving Reservoir Management
The three deep-reading technologies covered in this article—cross-well seismic, cross-well electromagnetics, and microseismicity—are varied in their maturity and commercial use. Through recent developments, all three technologies may now provide both new measurements and higher subsurface resolution. Even though the measurements are different, they can be related to the same reservoir model, complement each other, and improve subsurface understanding. With a better understanding of how to interpret and apply these measurements, improved reservoir management is possible.
Acknowledgments
ENI SpA has kindly allowed the publication of the microseismic data.