In September 2024, Fervo made public a pre-print containing plots and analyses for their Cape Station project in Utah. Although not nearly as detailed as the Blue Mountain dataset released in 2023, this Cape Station data allows for a critical look at the results.
The Fervo project in Utah, on the periphery of the Roosevelt Springs geothermal field, entails the drilling of multiple horizontal producer and injector wells into basement rocks, after which the rock is hydraulically fractured to create flow paths between the injectors and producers. In this case, the test results are from a “Triplet” – two injection wells and one production well.
Fervo states that the production rate was “levelling out at approximately 93 kg/s after the first day of production”. However, a close look at the plot suggests that this is not the case; the rate declines from about 97 to 93 kg/s over the last 12 hours shown. Importantly, this declining trend is continuing at the end of the plot.
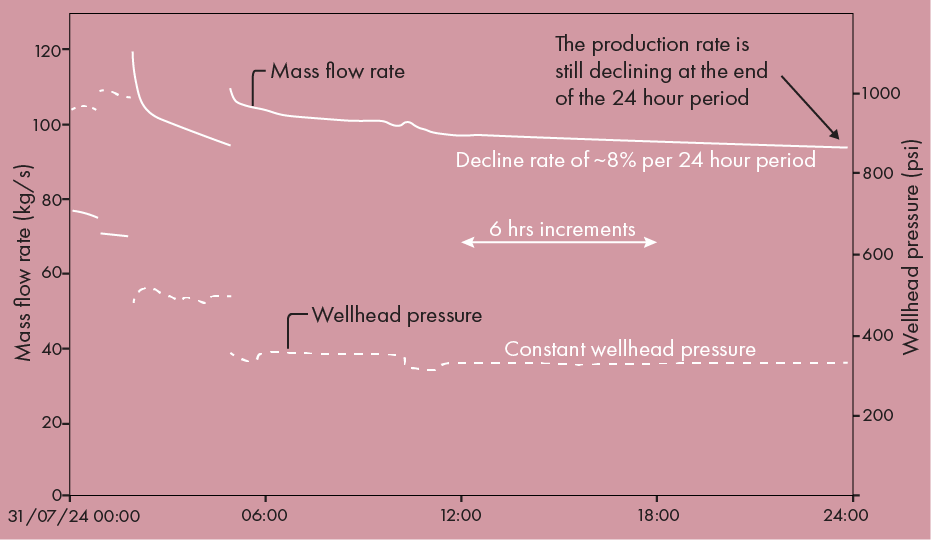
This has obvious implications for the consistency and sustainability of production, the bread and butter of geothermal projects. If the production rate levels out at 93 kg/s as stated, why not show this? The Cape station paper presents only 24 hours of data, versus 37 days for the test in Blue Mountain, Nevada.
Also, no injection rate data is presented, so it is difficult to judge if the higher production rates at Cape Station were a result of more efficient fracking or a higher injection/production ratio.
Gross and net power
Fervo states that the first Cape Station production well “sustained an output of 8-10 MW”. However, net power should take into account the power required for the injection pumps. This is a function of the pressure differential between production and injection and the injection rate. We are told that the injection pressure is between 2,000 and 2,300 psi, and the wellhead pressure at the end of the 24-hour period looks to be about 350 psi.
The injection rate is not given, but if we assume 120% of the production rate, the pump power can be estimated at about 2.5 MW, making the net power 6.2 MW at the end of the 24-hour period. If the production decline continues at a rate observed in the Blue Mountain test during its longest period of constant injection – an average of 2.5% per 24-hour period – the net power at the end of 7 days would be 4.8 MW. Net power of 4.8 MW is a fair way off from the “sustained 8-10 MW” stated by Fervo in their white paper.
As for Blue Mountain, it has been almost two years since the pilot production well has been “flowing to the plant”, so there has been ample opportunity to document the sustainability of EGS injection/production rates. In an earlier article, we raised questions for Blue Mountain that have not yet been answered. For Cape Station, the stakes are much higher, but the questions are still the same.