The answer, my friend, is hiding in the waves, the answer is hiding in the waves (with apologies to Bob Dylan, and thanks to our colleagues in Lundin Norway)
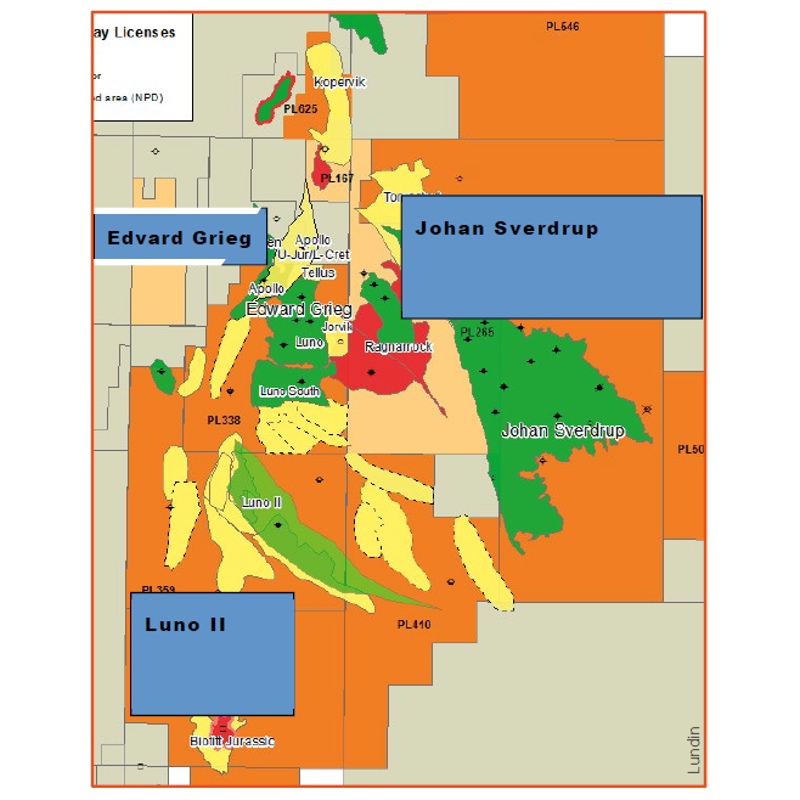 The Utsira High area, including the giant Johan Sverdrup field, Edvard Grieg field and the Luno II field. (Source: Lundin)In previous articles the focus has been on various broadband technologies and the principles behind them. Technical progress is vital and highly desirable, but how should the users choose between these technologies to find the best technology for a given field or exploration target? Lundin Norway has decided to use the Utsira High area offshore Norway as a broadband seismic field laboratory.
The same 2D line has been shot several times using various technologies, different shapes of the streamer and so on. Using these alternative set-ups, Lundin’s geophysicists have tried to find what is hidden in the waves, including seismic waves, ocean waves, and the wave-shaped streamer. Their ambition is to prove that Bob Dylan is a genuine rocking geophysicist.
Filling Frequency Gaps at Utsira High
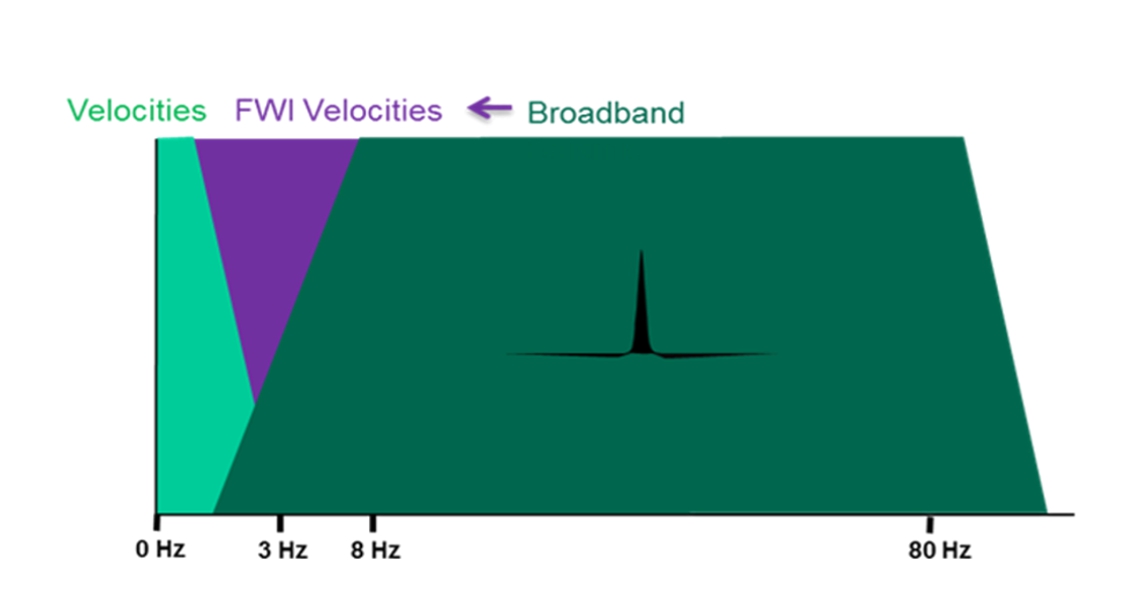
The major objectives for broadband seismic data acquisition and processing are to increase both the low and high frequency content of the data. This is illustrated in the figure below, where the pre-broadband situation is sketched together with an idealised version of the broadband frequency response.
We observe from this figure that the low frequency improvement is probably more critical and thus plays a more important role compared to the improvements on the high frequency end. This is because it is crucial to fill the gap between stacking velocities, well log data and seismic data.
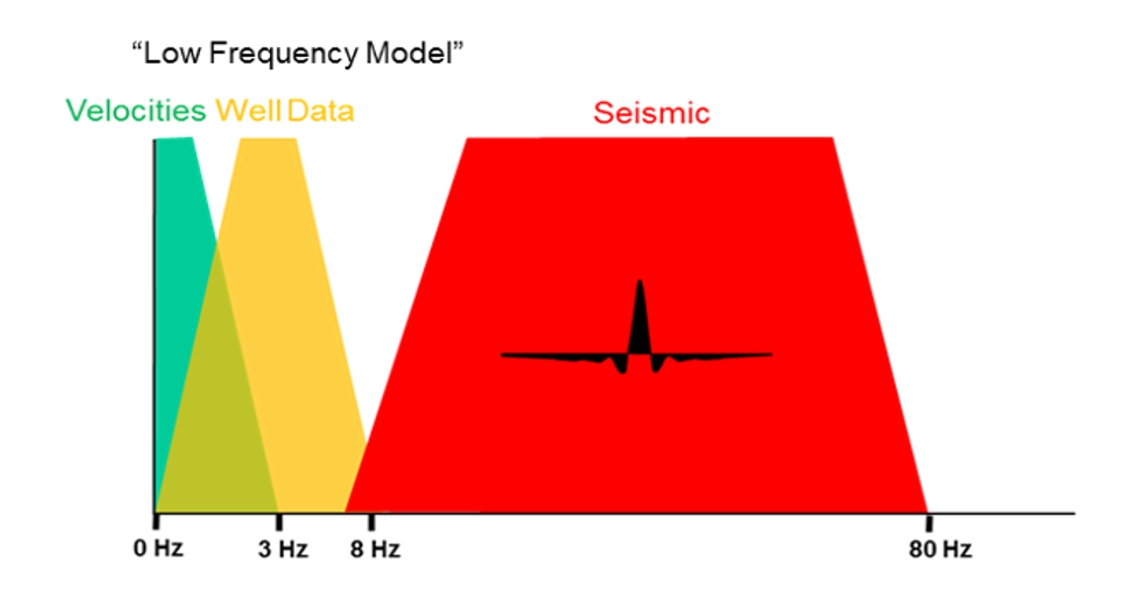
Schematic view demonstrating the focus in broadband seismic acquisition and processing: filling the low frequency gap between 1 and 8 Hz and pushing the high frequency response above 80 Hz. (Source: Lundin)
Schematic view demonstrating the focus in broadband seismic acquisition and processing: filling the low frequency gap between 1 and 8 Hz and pushing the high frequency response above 80 Hz. (Source: Lundin)
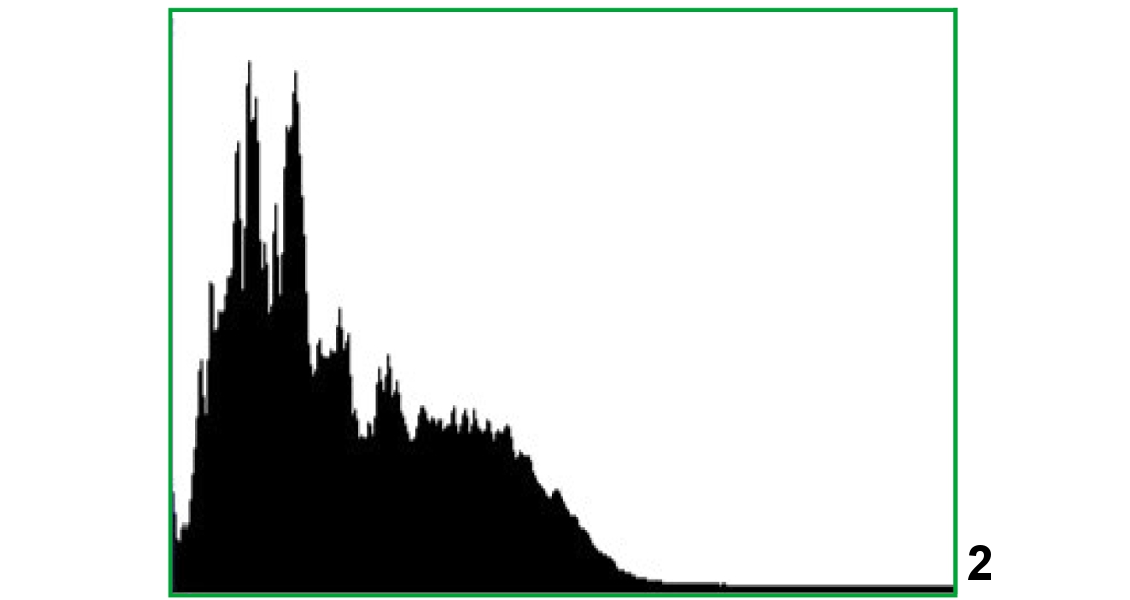
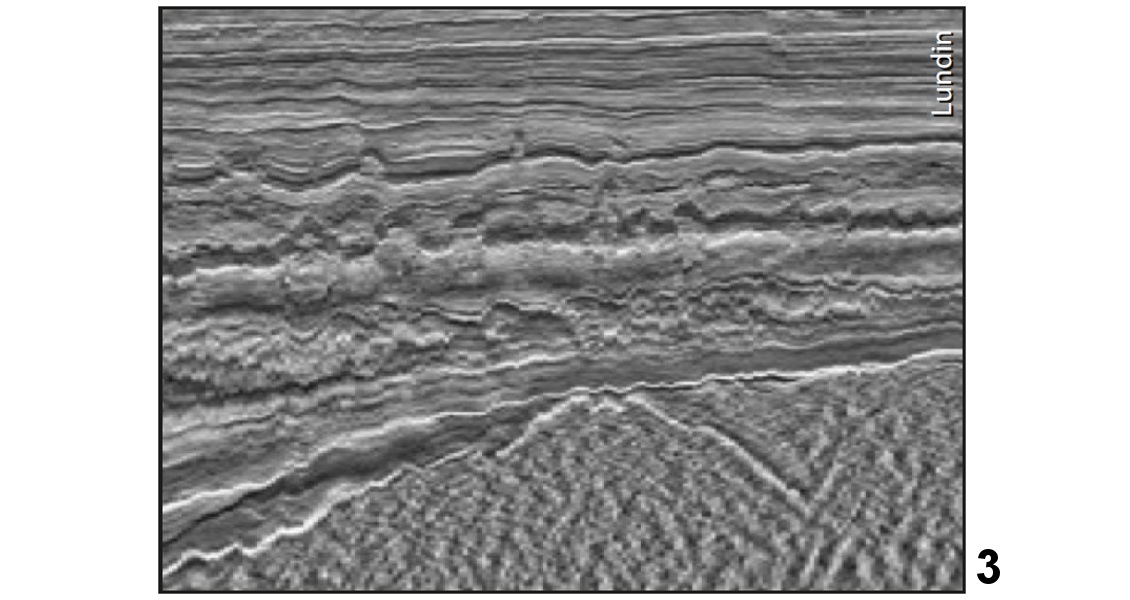
At the Utsira High both these challenges are important and early in the exploration phase Lundin’s geophysicists embarked on a project aiming at understanding how these frontiers (low and high frequency content) could be met and actually measured and controlled. There are several challenges related to establishing a field laboratory like this. First of all, the technology is rapidly expanding and therefore it will never be fair to compare the results obtained by one contractor with those obtained by another contractor two years later. Furthermore, different contractors have different processing algorithms, causing different end results when the same data are used as input. Finally, weather conditions will always change between various acquisitions. Despite this, the main conclusion is clear and crisp: broadband seismic data is better than old conventional data. This is demonstrated in the figure below where amplitude spectra from four types of acquisition are compared for the same 2D line at the Utsira High area.
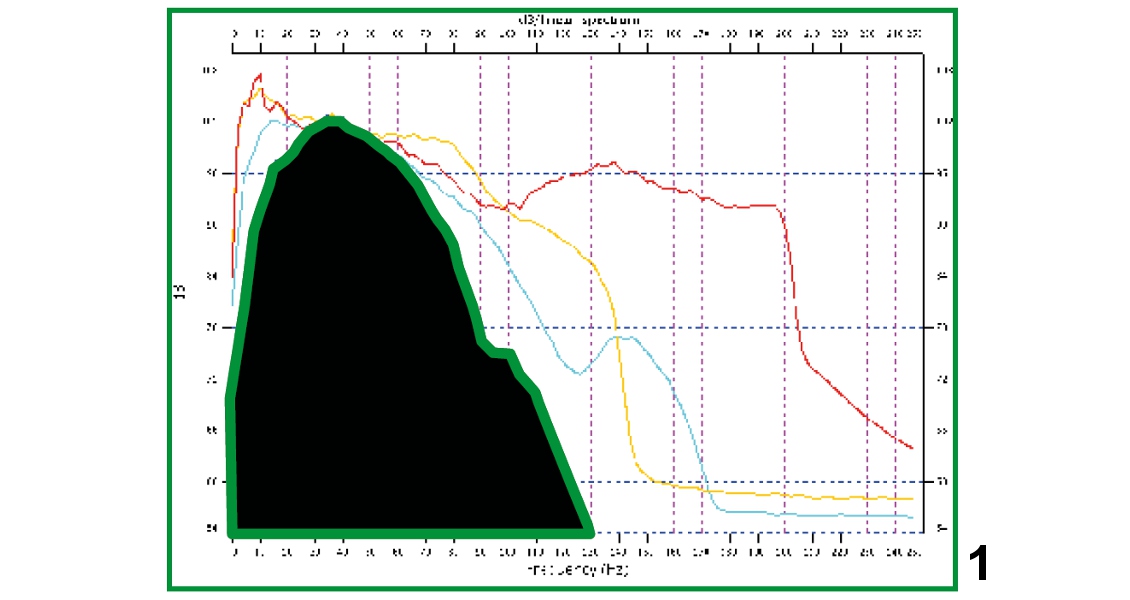
Amplitude spectra of seismic data acquired using various acquisition systems: 1) conventional streamer (2007), 2) OBC data (2008), 3) Geostreamer (2009) and 4) Broadseis/Broadsource (2012). (Source: Lundin)
Amplitude spectra of seismic data acquired using various acquisition systems: 1) conventional streamer (2007), 2) OBC data (2008), 3) Geostreamer (2009) and 4) Broadseis/Broadsource (2012). (Source: Lundin)
Amplitude spectra of seismic data acquired using various acquisition systems: 1) conventional streamer (2007), 2) OBC data (2008), 3) Geostreamer (2009) and 4) Broadseis/Broadsource (2012). (Source: Lundin)
Amplitude spectra of seismic data acquired using various acquisition systems: 1) conventional streamer (2007), 2) OBC data (2008), 3) Geostreamer (2009) and 4) Broadseis/Broadsource (2012). (Source: Lundin)
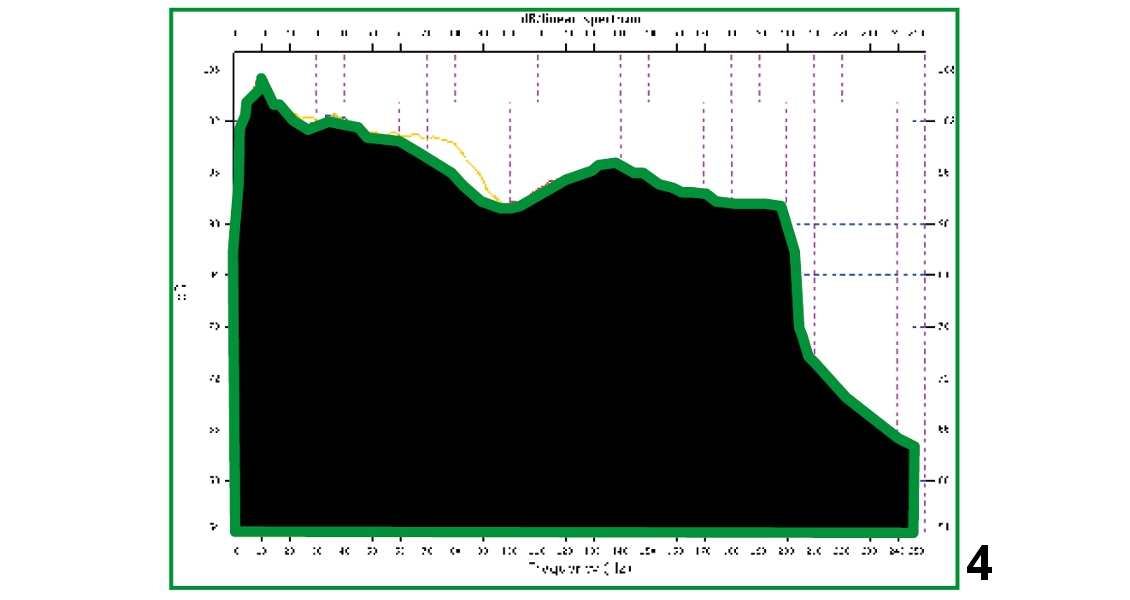
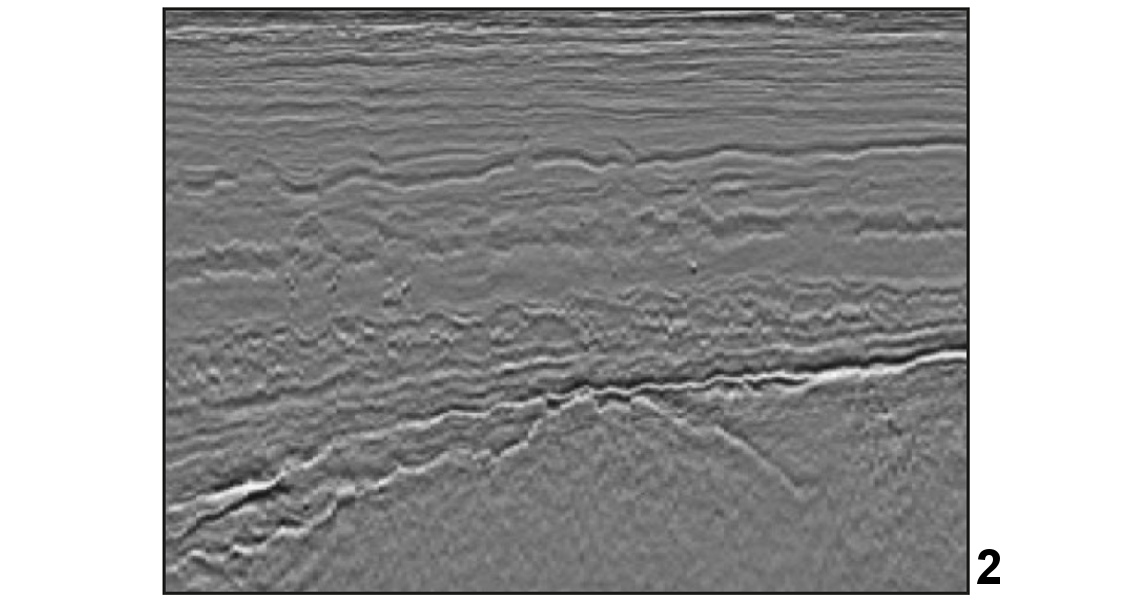
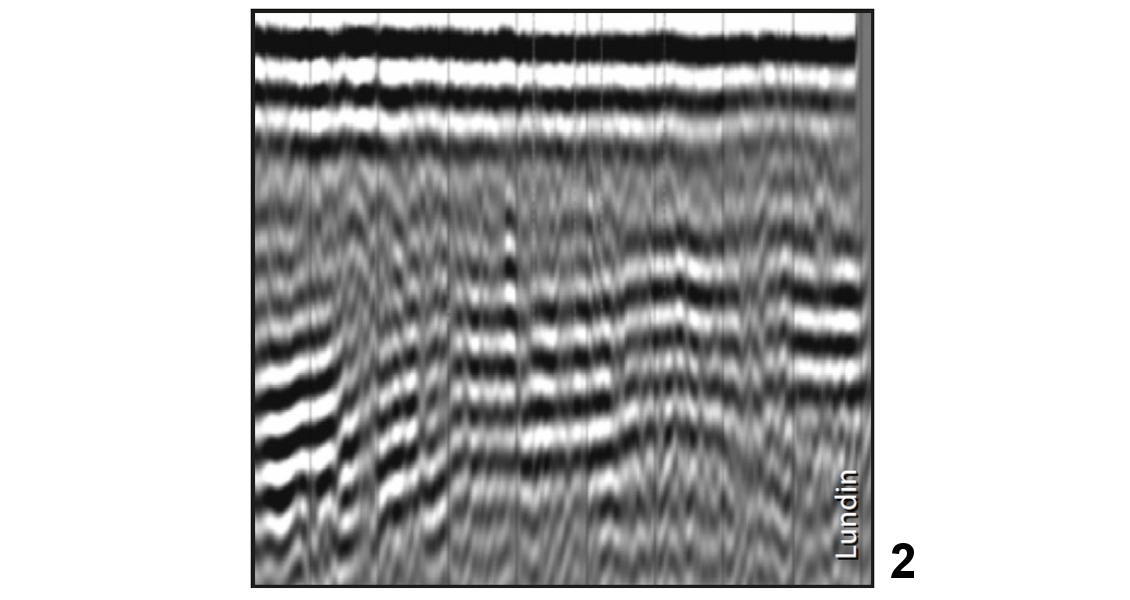
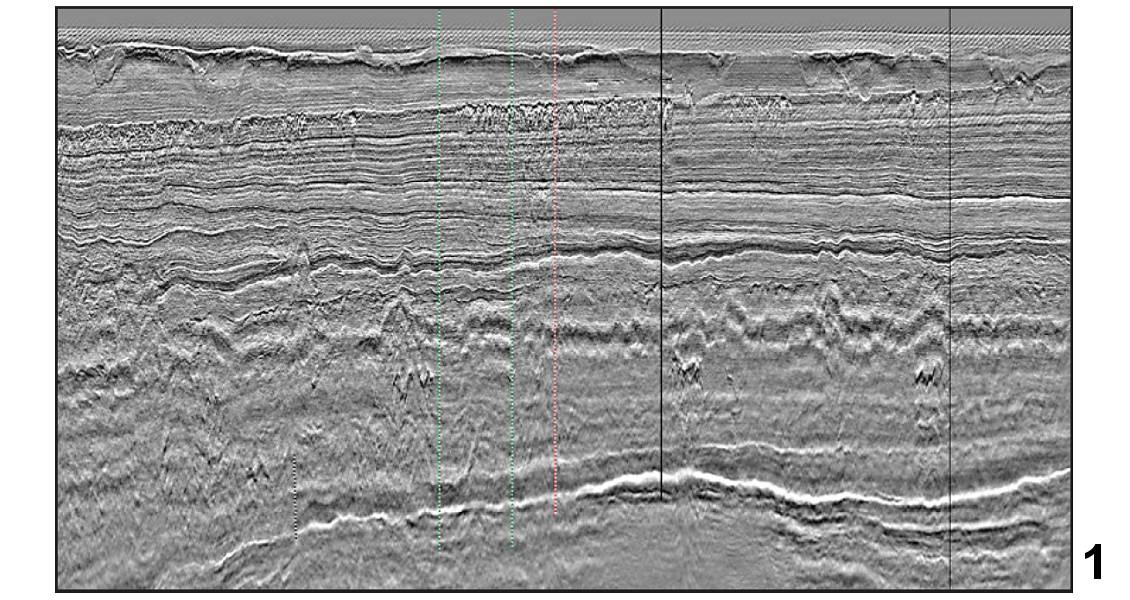
Another example illustrating the progress in broadband seismic is shown below, where we can observe distinct improvements in seismic imaging from 1995 to 2009 and finally 2012. We notice especially that the imaging of top basement (the lowermost clear reflector seen on these images) is significantly improved from 1995 to 2012.
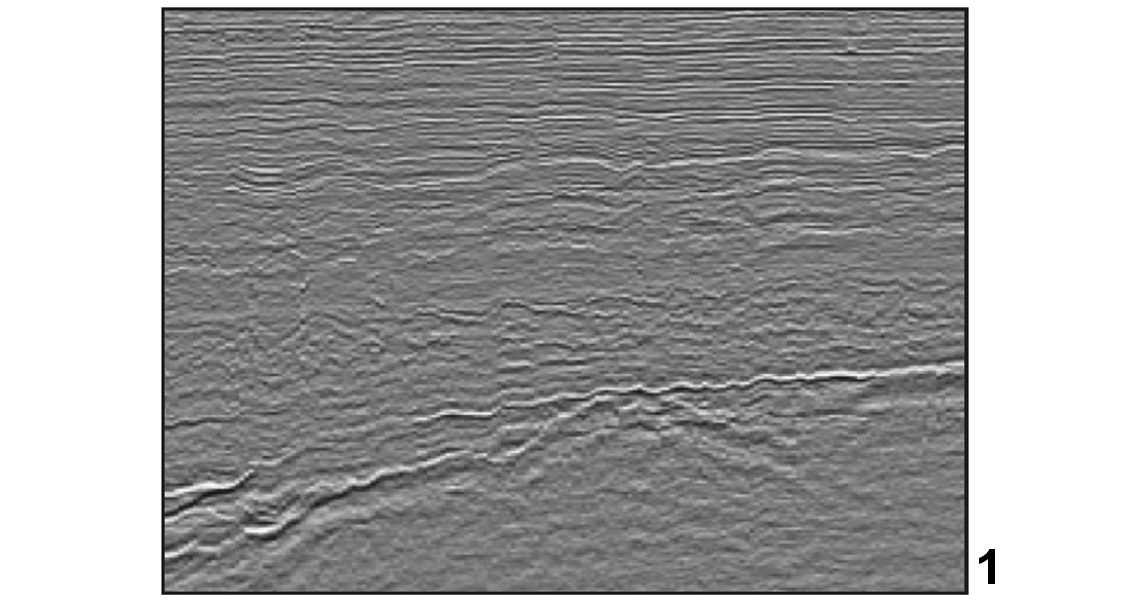
Conventional streamer data from 1995 (1), Geostreamer data from 2009 (2) and BroadSeis data from 2012 (3). (Source: Lundin)
Conventional streamer data from 1995 (1), Geostreamer data from 2009 (2) and BroadSeis data from 2012 (3). (Source: Lundin)
Conventional streamer data from 1995 (1), Geostreamer data from 2009 (2) and BroadSeis data from 2012 (3). (Source: Lundin)
Testing Streamer Configurations
In 2013 Lundin initiated a huge practical experiment to be conducted at the Utsira High. Together with a seismic contractor, they tested 11 different streamer configurations at the same time. The same 2D line was shot over and over again using the same source configuration but with different shapes of the streamer.
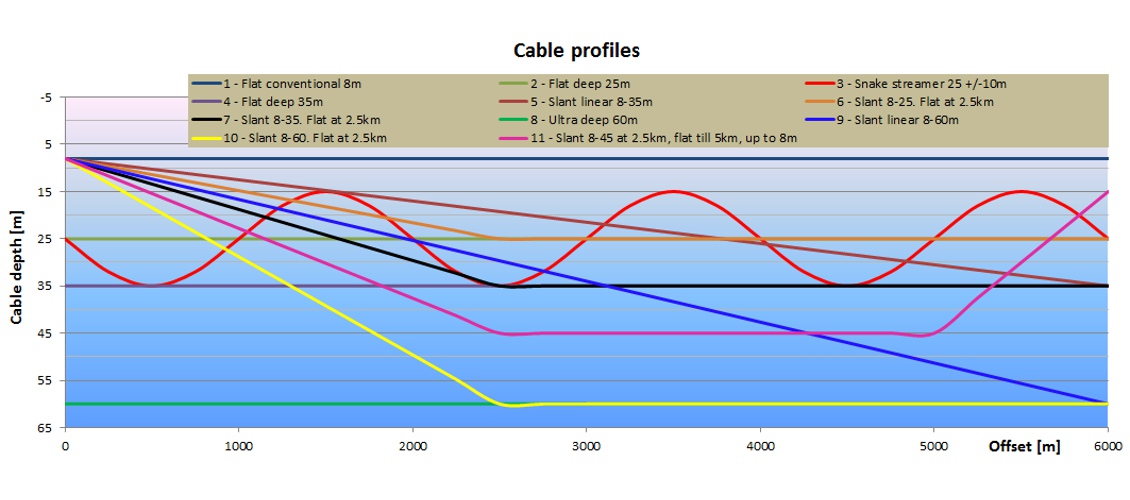
Various streamer configurations (11 in total) were tested. (Source: Lundin)
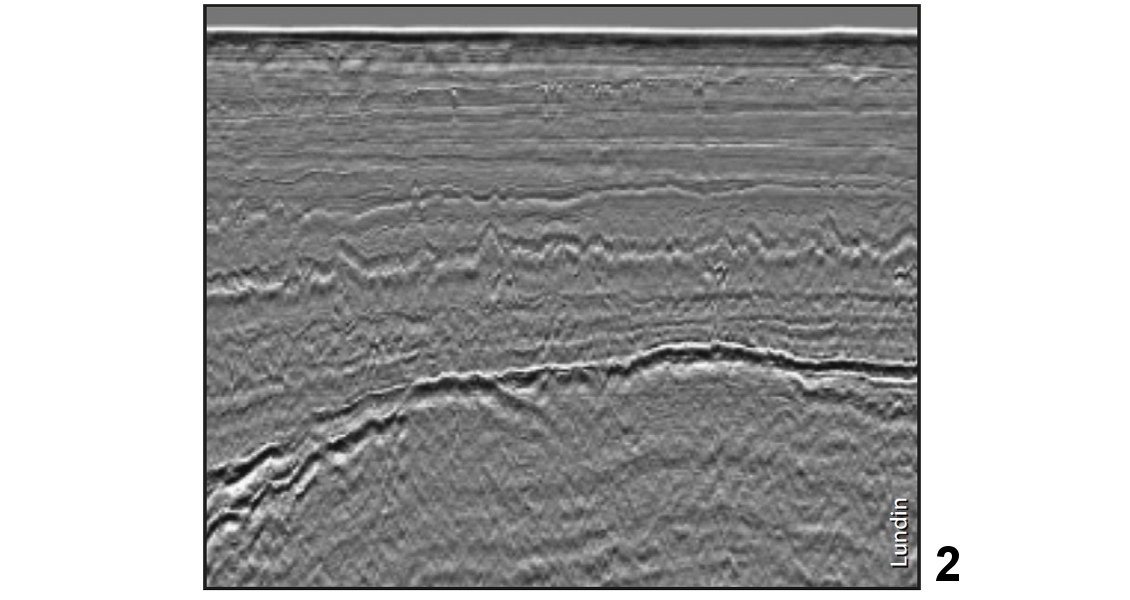
Maybe the most spectacular (and the most difficult for the contractor to achieve) is the ‘snake’ configuration, where the streamer has a sinusoidal shape varying from 15 to 35m. This extensive experiment gives a unique insight into how various towing configurations might impact the final imaging result. A comparison between the snake configuration and a conventional streamer towed at 8m depth is shown below, and it is actually hard to spot any major differences.
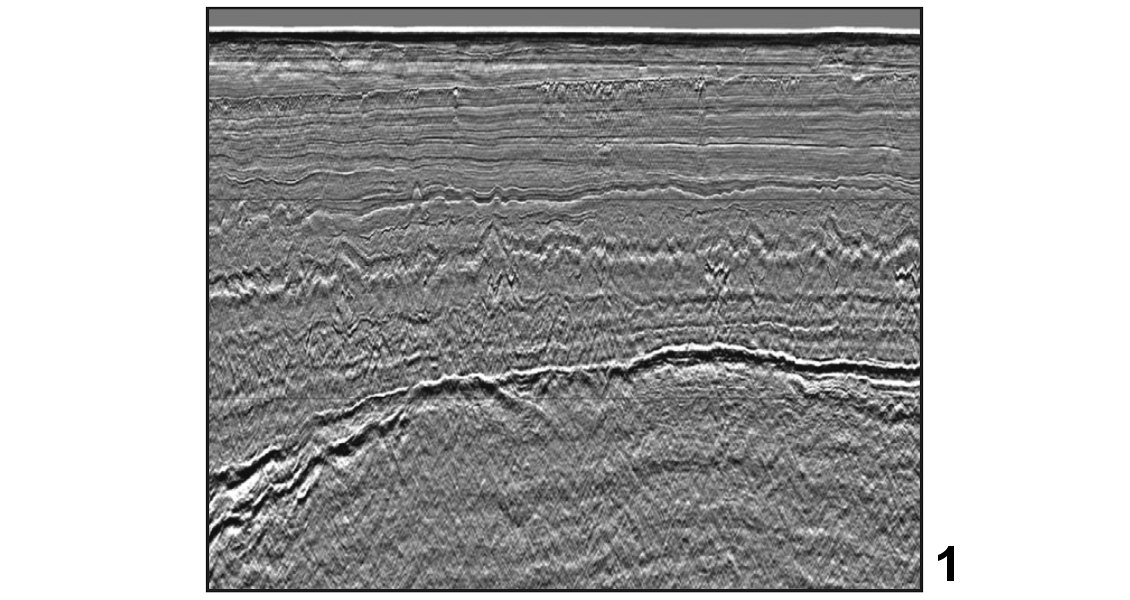
Comparison of the ‘snake’ streamer configuration (1) and a streamer towed at 8m depth (2). It is hard to spot any major differences between the two seismic profiles. (Source: Lundin)
Comparison of the ‘snake’ streamer configuration (1) and a streamer towed at 8m depth (2). It is hard to spot any major differences between the two seismic profiles. (Source: Lundin)
A clear difference is observed, however, when the low frequency response is considered. It is evident from this test that a streamer deployed at 60m depth gives a far better low frequency response compared to a streamer towed at 8m depth. For more advanced use of seismic data, as for example Full Waveform Inversion (FWI), this advantage is crucial.
Another benefit demonstrated with this comprehensive test is that a slanted streamer configuration with more notch diversity is preferred over a flat or less slanted cable.
Comparison of 8m (1) and 60m (2) streamer depth for the low frequency response (0-1-3-4 Hz bandpass filter has been applied). A more continuous and stronger response is observed for the deeptowed streamer data. (Source: Lundin)
Comparison of 8m (1) and 60m (2) streamer depth for the low frequency response (0-1-3-4 Hz bandpass filter has been applied). A more continuous and stronger response is observed for the deeptowed streamer data. (Source: Lundin)
Processing Developments
Alongside the rapid developments in seismic acquisition, major improvements have also been achieved on the processing side. When the acquisition deviates from the conventional flat streamer into, for instance, a slanted configuration, there is need for adjustments and modifications of the processing algorithms, simply to correct for the fact that the streamer depth is changing with offset.
However, the major and most certainly the most important new processing step that is a must in broadband seismic processing is de-ghosting. As described in earlier articles in GEO ExPro (see Part II), the receiver ghost notch frequency depends on the streamer depth (f=c/2z; f = frequency, c =sound velocity in water and z = streamer depth). For old data this receiver ghost notch was not harmful, since a streamer depth of 8m corresponds to 94 Hz, which is normally outside the frequency band of interest. However, when the streamer depth is changed to, for instance, 25m, this ghost notch occurs at 30 Hz, which is in the middle of the useful seismic spectrum.
Therefore, there is a strong need for effective and accurate ways to remove the ghosts from data acquired using a deep towed streamer. Since different vendors prefer to use different streamer configurations and some vendors measure particle velocities in addition to pressure, the de-hosting algorithms used will also differ.
There has also been a significant research effort aiming at increased understanding of ghost effects in seismic data and especially on developing robust and effective de-ghosting algorithms. The example shown below probably demonstrated this time evolution more than differences between various vendors in processing skills. It is, however, interesting to notice major differences especially for the deeper data when it comes to image quality.
Same input data (8m streamer depth) and different de-ghosting schemes from different vendors compared. Note that the processing has been done at different times, demonstrating that de-ghosting algorithms have developed significantly over the past 5-10 years. (Source: Lundin)
Same input data (8m streamer depth) and different de-ghosting schemes from different vendors compared. Note that the processing has been done at different times, demonstrating that de-ghosting algorithms have developed significantly over the past 5-10 years. (Source: Lundin)
The Answer is Hiding in the Waves
There is no doubt – the marine seismic industry has changed significantly over the last decade. Today more and more marine seismic streamers are towed at between 20 and 40m. This is a huge change, and it might actually be the beginning of a new era in marine seismic. As technology is improving, new efficient ways of towing both source arrays and streamers will be found. The oil industry is facing severe changes in the years to come, and cost savings and other challenges might slow down the broadband revolution. Despite this, there is a huge reward waiting for the organisations that are capable of understanding and exploiting information that is still hidden in the waves.
One thing is sure: geophysics rocks, and the waves will continue to propagate. We just need to understand how and why.