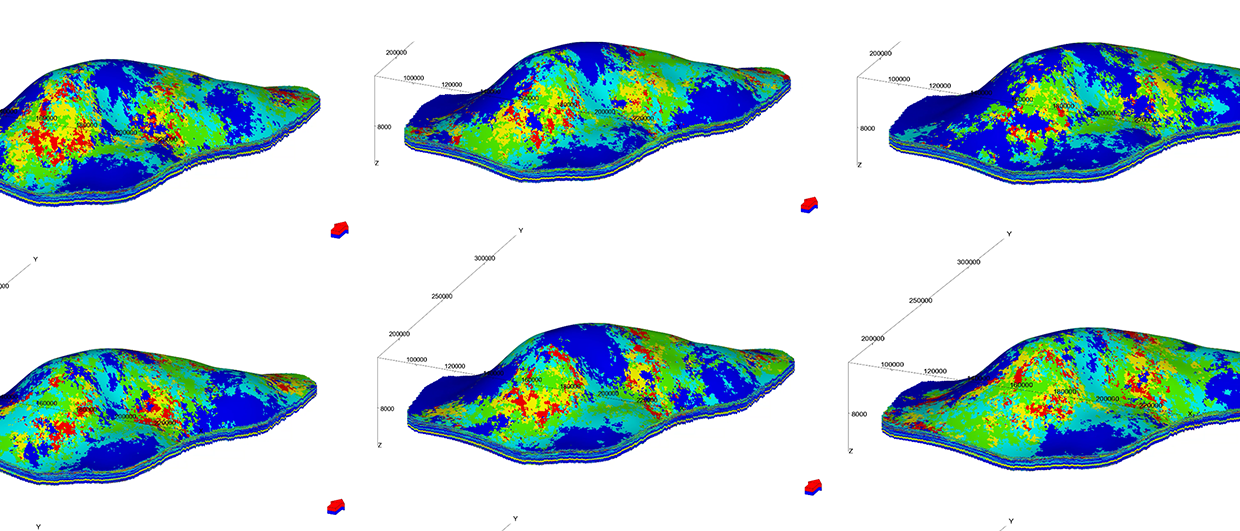
The Gullfaks area is in Block 34/10 on the western flank of the Viking Graben in the Norwegian North Sea (Figure 1). The main reservoirs are located below the Base Cretaceous Unconformity (BCU) in the Brent Group and the Cook and Statfjord formations and production from those levels started in 1986. The younger secondary reservoirs, in the Shetland Group and the Lista Formation, came into production in 2012.
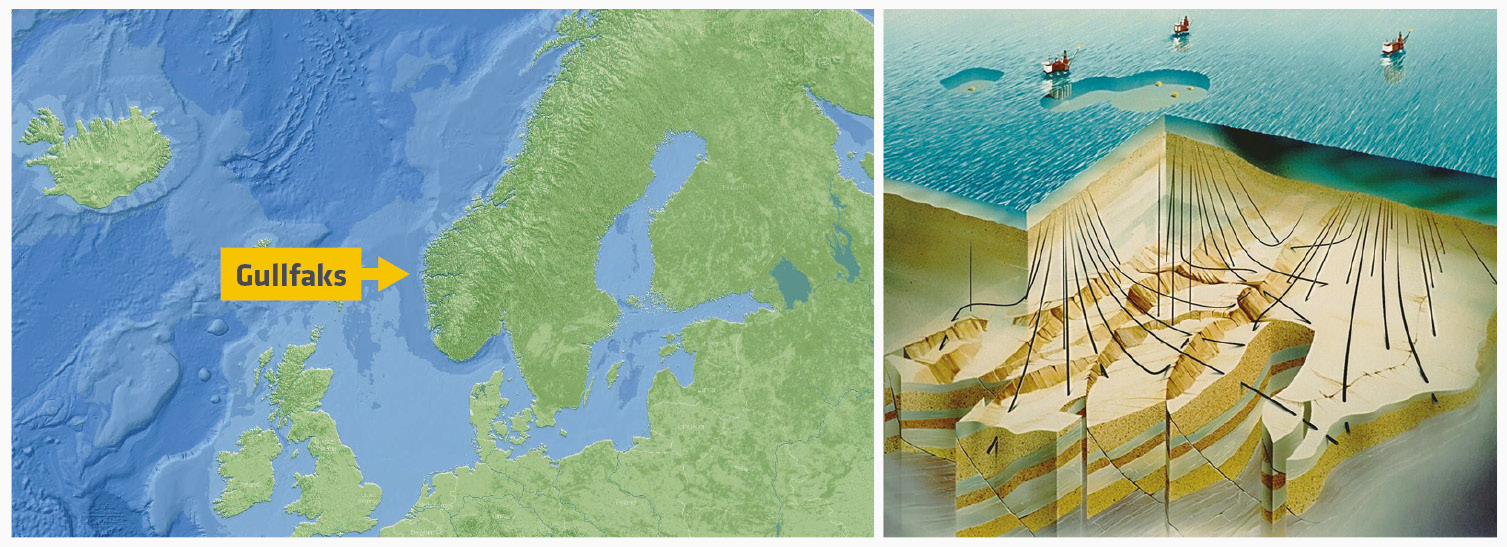
Figure 1: The location of the Gullfaks Main Field and a 3D view through the reservoir, below BCU. © PGS/Equinor.
Time-lapse seismic monitoring is a key technology to secure future field production, with a 4D strategy defined by various needs and targets. The Gullfaks asset has been running a successful seismic monitoring programme for decades. Since 1995, eight vintages of streamer data and nine Ocean Bottom Seismic (OBS) surveys have been acquired at regular intervals.
The 4D repeatability and data quality have directly benefitted from the evolving technology. Recent broadband multisensor streamer solutions have delivered better, clearer images with a higher level of detail than conventional seismic. While broadband has become a standard for 3D seismic interpretation, its application is still new for time-lapse seismic and the number of case studies is limited.
In 2019 Equinor ran a time-lapse broadband proof of concept, using the latest 2016 and 2019 GeoStreamer surveys, which together with Ocean Bottom Cable (OBC) seismic data, provides an extensive dataset for interpretation and strengthens our understanding of the potential broadband 4D uplifts for future application.
The area of interest underwent several development stages between 2016 and 2019. Gas injection was already underway when the 2016 4D monitoring survey was acquired. Near wellbore pressure increased between 2016 and 2019 and a gas saturation effect was visible in the reservoir on both the 2016 and the 2019 4D seismic. A pressure depletion during this period is expected.
Two Comparative Datasets
Two datasets were acquired and used in this study. The broadband multisensor streamer dataset was used for the main analysis, while the OBC seismic was used as a reference dataset.
In 2016, the upgrade from conventional hydrophone-only streamers to GeoStreamer multisensor streamer technology set a new milestone in the Gullfaks monitoring programme, and this technology was used to provide the analysis dataset. A high-density streamer spread (17 × 50m), using multisensor streamer technology and sophisticated source and streamer steering systems, allowed for high geometrical repeatability and deeper towing depths. This resulted in improved signal-to-noise ratio and acquisition efficiency without compromising the bandwidth. In 2019 a similar acquisition setup was used which enabled a unique opportunity to quantify the uplift of 4D broadband.
The two latest GeoStreamer surveys were processed in two ways:
- conventional non-deghosted (H-REC),
- and broadband fully deghosted (P-UP).
Both H-REC and P-UP were processed using similar, though not identical, processing sequences. Free of the receiver ghost, the P-UP data only requires full source deghosting. For H-REC, both source and receiver ghosts are not compensated for; however, the H-REC data still carries the multisensor deep tow acquisition benefits of reduced noise level, better recording and higher signal-to-noise ratio on low frequencies.
The reference Ocean Bottom Cable dataset, covering the same time interval (2016–2019), was processed as part of an OBS monitoring programme by a different contractor. OBC acquisition has continuous seismic coverage below rig holes in the area of interest and was used as additional input. This allowed cross-validation of the various streamer scenarios and strengthened understanding of the broadband 4D uplifts.
Comparing the Datasets
In the context of 4D interpretation, isolating the 4D signal from background noise is key in defining the applicability of the monitoring programme, as accurate positioning and delineation of the signal may become critical in determining the next development step in the life of the reservoir. Figure 2 illustrates that the 4D difference obtained using conventional seismic maximum amplitude than the one from broadband seismic. This might lead to very different conclusions about the state of the reserves in place or difficulties in matching the observed effects with the production/injection history.
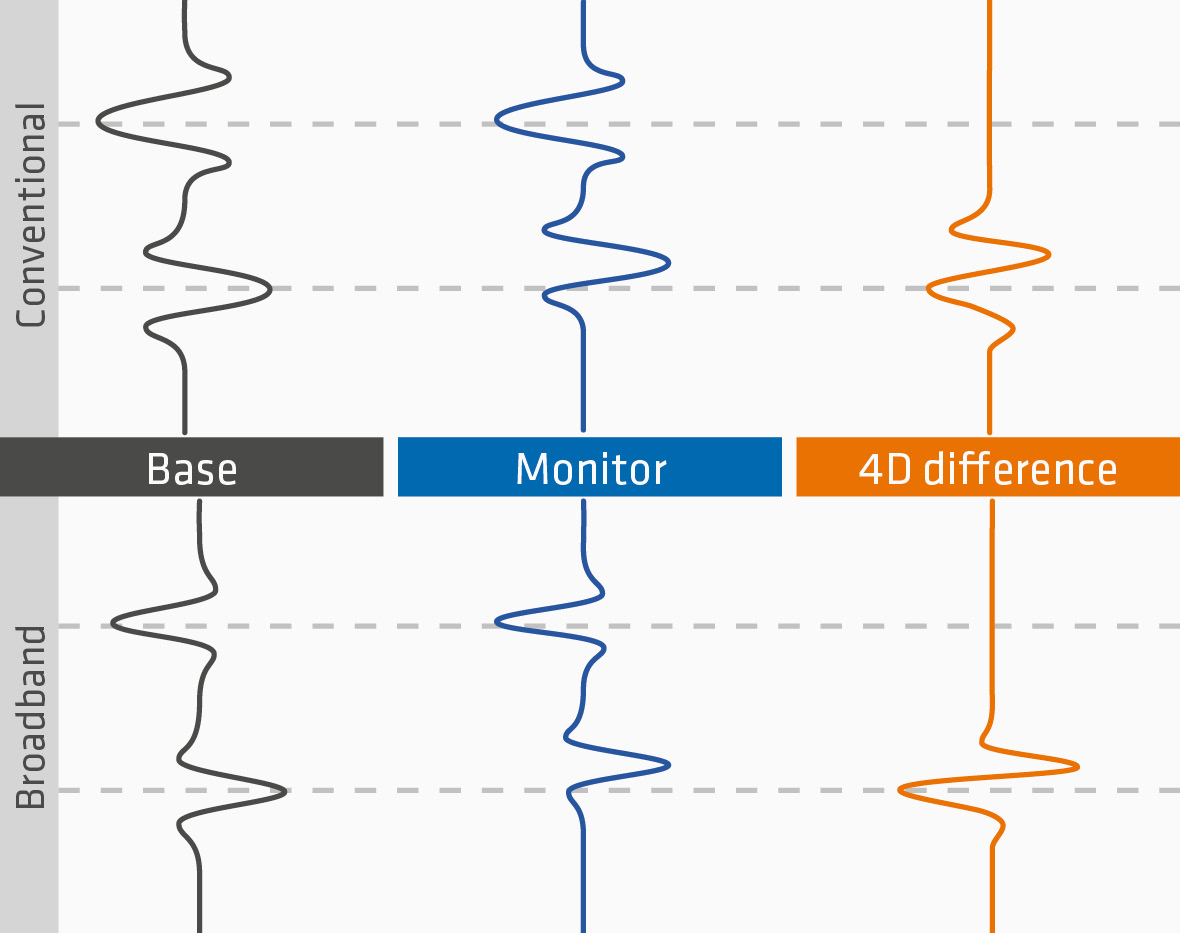
Figure 2: Modelling of 4D response for broadband and non-deghosted datasets. Broadband seismic is much more focused and has stronger maximum amplitude than the conventional seismic. © PGS/Equinor.
The expectations from the broadband dataset were broader bandwidth, a consistent level of detail with at least the same amount of information as non-deghosted streamer data, and a consistent interpretation result between non-deghosted and deghosted broadband and the OBC data.
The bandwidth of broadband deghosted data is wider than conventional non-deghosted data. To make the deghosted dataset more comparable to the non-deghosted one, an extra version of the data was produced, applying additional amplitude balancing to the final stack (P-UP amplitude scaling).
Figure 3 shows 3D stack seismic sections that are zoomed in on the target area from the 2019 vintage. Corresponding amplitude spectra are also shown. GeoStreamer broadband data has considerably higher amplitudes at 0–16 Hz, but all spectra converge at higher frequencies. Amplitude balancing boosts the high frequency end of spectra and scales down the area of 10–15 Hz to make it more comparable to non-deghosted streamer. However, when assessing the 4D differences (Figure 4), the amplitude scaling did not add useful information but boosted the background noise.
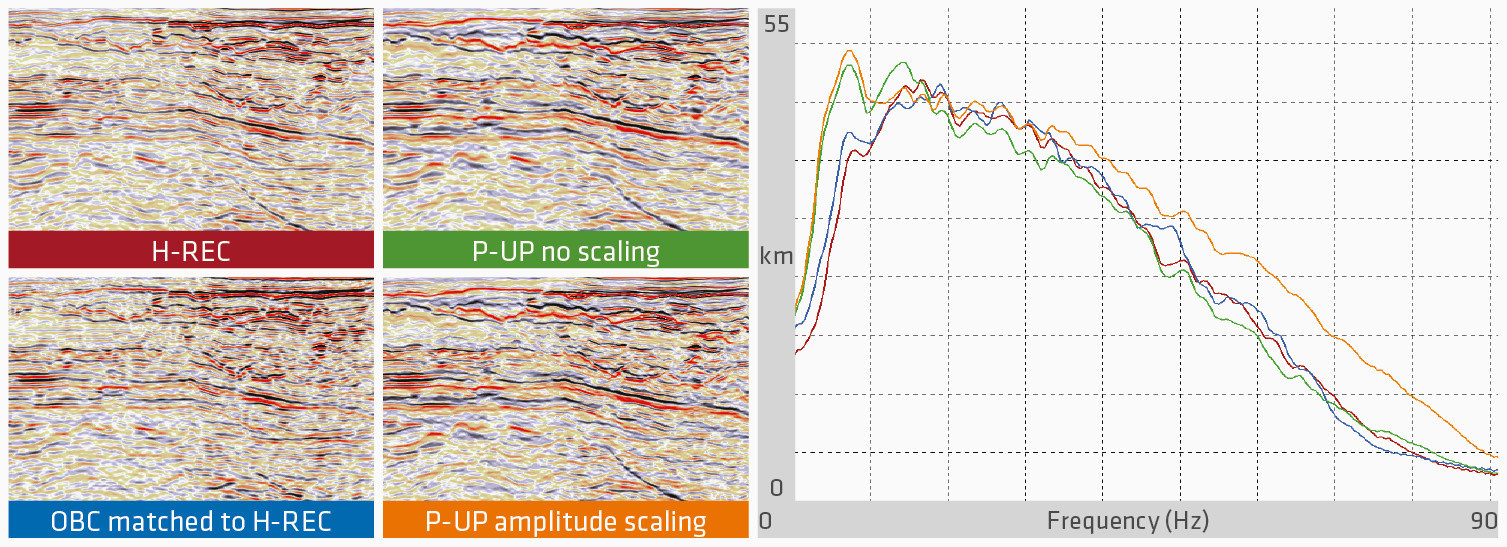
Figure 3: 3D stack of target sections (2019 monitor, zoomed to target area) and corresponding amplitude spectra of the datasets: (a) non-deghosted streamer (H-REC); (b) broadband streamer (P-UP) without amplitude scaling; (c) OBC matched to non-deghosted streamer; (d) broadband (P-UP) with amplitude scaling. © PGS/Equinor.
Figure 4 shows 4D differences in inline and crossline sections through the target area. Overall, 4D effects in each comparison are similar and match the well production history: the Shetland Formation (light green) near wellbore pressure build-up effect between 2016 and 2019 results in acoustic softening. This 4D effect, positioned slightly on the side of the well, is mainly observed in the inline direction. The 4D effect in the Cook Formation (white) is dominated by a pressure reduction with expected hardening of the 4D signal. This can be seen in both inline and crossline directions.
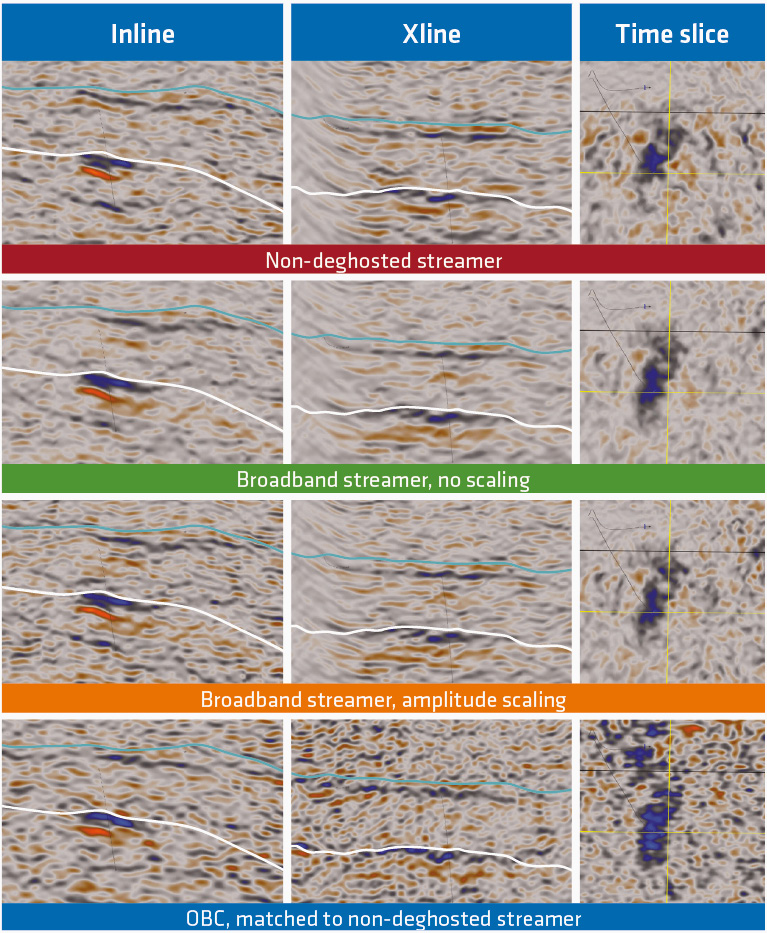
Figure 4: 4D differences in inline, crossline, and timeslice dimension, zoomed to target area. The left side of the crossline images on the streamer data is influenced by migration aperture from the platform hole. Broadband and OBC dataset show better continuity and amplitude discrimination of the 4D effect than the nondeghosted data. © PGS/Equinor.
When comparing 4D signal in the crossline direction between the OBC and streamer data (Figure 4), we observe the expected contribution of the platform hole. The OBC 4D effect is more continuous and coherent than the streamer data. However, the broadband data (Figure 4, rows 2 and 3) show better continuity, similar to the OBC extent of the hardening at the Cook level, than on the non-deghosted streamer data (Figure 4, row 1). The broadband dataset without additional amplitude scaling (Figure 4, row 2) gives better amplitude discrimination of the 4D effect, lower background noise, and brighter and more isolated amplitudes of the 4D effects on the Cook Formation. This is also supported by the NRMS and amplitude scaler target window attributes, shown on Figure 5. The 4D signal in the inline display also looks more continuous on the broadband data at the Shetland level and is comparable to the OBC data.
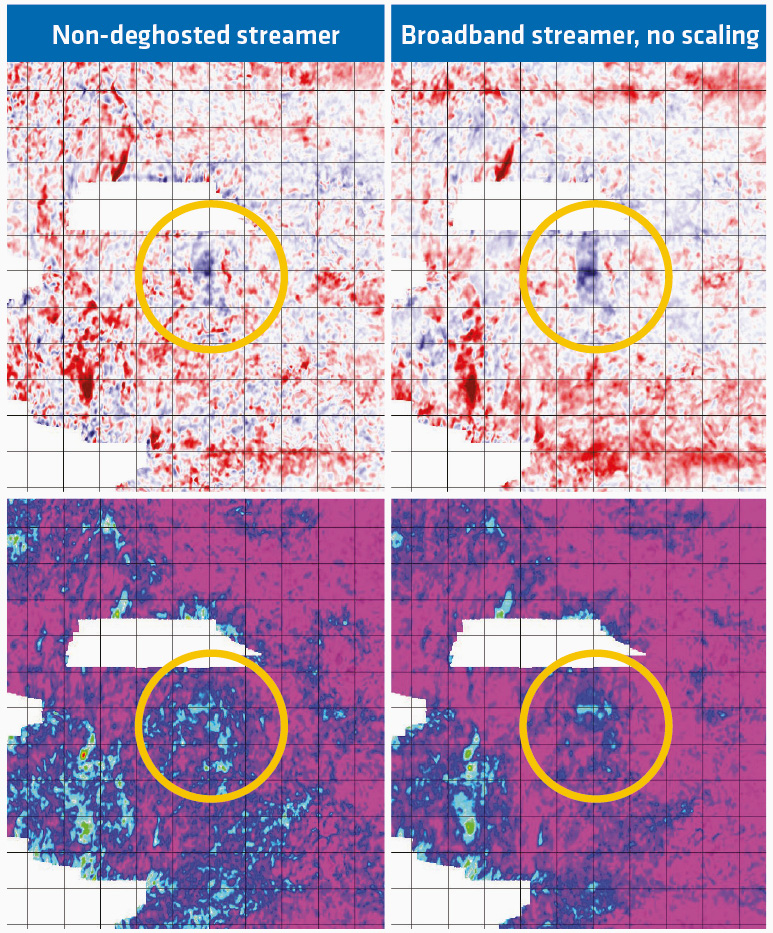
Figure 5: RMS scaler and NRMS for non-deghosted and broadband dataset, showing the broadband dataset gives lower background noise and brighter and more isolated amplitudes of the 4D effect. © PGS/Equinor.
Overall, at this stage, we observe good continuity and improved resolution in the broadband data. Improvement of the fine details and reduction in the 4D noise increases confidence in the 4D results. Minimising the uncertainty of the reservoir models can help to improve the production plan.
Future Strategy
The current Gullfaks licence period continues to 2036. Future field plans include further development and maturation of the gas and oil reserves. The Gullfaks 4D strategy aims to acquire a new seismic survey every three years, to validate and monitor the existing reservoirs and to find new targets or bypassed hydrocarbons.
More work is needed to fully understand the benefits and take advantage of the broadband 4D data on the Gullfaks field. However, a conclusion can be made that availability of modern, high quality seismic data enables more thorough analysis and provides new insights into this established area. Employing up-to-date acquisition and processing technologies, including broadband solutions, sets a path towards future high-resolution 4D projects.