In the November 2015 issue of the AAPG Explorer, Zweidler et al. reviewed the value potential from embedding 3D Controlled-Source Electromagnetic (CSEM) information into a seismically-driven exploration portfolio. The interpretation method followed is broadly applicable and non-disruptive to standard exploration processes. An understanding of the rock physics of CSEM-measured resistivity is implicitly needed in order to draw appropriate conclusions from the data, although a detailed reservoir rock physics model is not. This makes the CSEM information particularly valuable in high-uncertainty exploration settings. Here we describe the relationship between the CSEM measurement and reservoir rock properties, and provide a framework for interpretation, applicable from frontier exploration through to appraisal.
Measuring Sub-surface Resistivity
CSEM allows for a low-resolution reconstruction of sub-surface resistivity, both parallel (Rp) and normal (Rn) to the bedding, in contrast to conventional resistivity-logging tools, which are mostly sensitive to Rp resistivity. Such tools provide a harmonically averaged reconstruction of the resistivity structure, thereby biasing the measurement to the lowest-resistivity layers present below the tool’s resolution. This is the source of many instances of ‘low resistivity pay’: pay that would be evaluated as high water saturation from the measured resistivity but that can show high hydrocarbon productivity with very low water saturation in production tests (Worthington, 2000). This has also been a strong motivator for the development of multi-component resistivity logging tools.
Rn is a better indicator of accumulation quality (its horizontal permeability) than Rp. It scales linearly with hydrocarbon pore column height, so thinly-bedded but high-quality charged reservoirs therefore continue to exhibit high Rn long after they are below detection in Rp. This strength remains true even at the lower vertical resolution of the CSEM measurement.
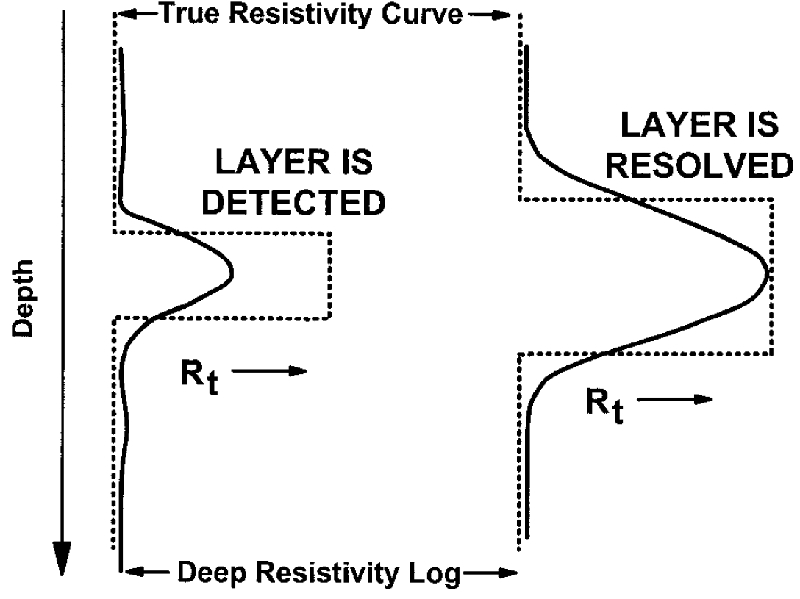 Taken from Worthington 2000, the peak Rp (continuous black curve) just provides a lower limit to the true resistivity, producing a large uncertainty on the evaluation of Rn.Classic rock physics models, such as Archie and its dispersed-shale variants, focus on translating Rp log measurements into hydrocarbon saturation estimates (Passey et al., 2006). As accurate Rn log measurements are less widely available, Rn rock physics is correspondingly less widely understood. We are therefore faced with a missing link in the interpretation of low-resolution CSEM-derived Rn. Since Rp is typically lower than Rn, Rp can only provide a lower limit to the true value of Rn when high resistivity layers are involved (see figure opposite). This implies potentially large uncertainty in reservoir Rn (with the exception of extremely homogeneous and thick reservoirs, where Rn and Rp will tend to be more similar). Application of Rp models and measurements to CSEM can lead to an underestimation of CSEM value during survey planning, and a failure to realise its full potential during interpretation (for example, failing to understand the full implications of a low-resistivity reservoir interval, as measured by CSEM).
A Rock Physics Framework for CSEM
A rock physics framework for exploration CSEM needs to account for characteristics of the Rn measurement and the tool’s low vertical resolution, and also handle exploration-level uncertainties. High-resolution deterministic frameworks may be accurate, but will typically provide imprecise, or even wrong, predictions in such a setting. Instead, we have found low-resolution probabilistic approaches, which aim to constrain the average properties of an interval, to be more suited to the task. Such approaches are well documented for addressing the hydrocarbon pore column uncertainty from log Rp measurements (Passey et al., 2006).
In order to characterise average Rn over the reservoir interval, and its uncertainty, we propose a low-resolution Monte Carlo method, analogous to that described by Passey et al., 2006, but augmented with additional parameters which have a negligible effect on hydrocarbon pore column calculations, but a major effect on average Rn. These are the hydrocarbon saturation variability between laminations within the reservoir interval (e.g., due to grain size variability); and the maximum possible hydrocarbon saturation in any layer (or minimum irreducible water saturation).
The algorithm creates a number of sub-imaging resolution reservoir layers, along with laminar shales. Each reservoir layer is fluid-substituted (using Archie, or derivatives as appropriate), according to the fine-scale saturation distribution provided. For the models resulting from each iteration, the average Rp and Rn are then calculated. Once a few tens of thousands of models have been generated, stable probability distributions of Rn and Rp can be produced. Such results should include all existing Rn uncertainty (high-precision, even if low accuracy in a typical exploration setting).
Main Drivers of Difference Between Rp and Rn
To illustrate the different characteristics of the CSEM-derived Rn compared to the better understood Rp, a simulation has been generated with wide input-parameter distributions (the results of this exercise should not therefore be taken as representative of any specific real-life reservoir).
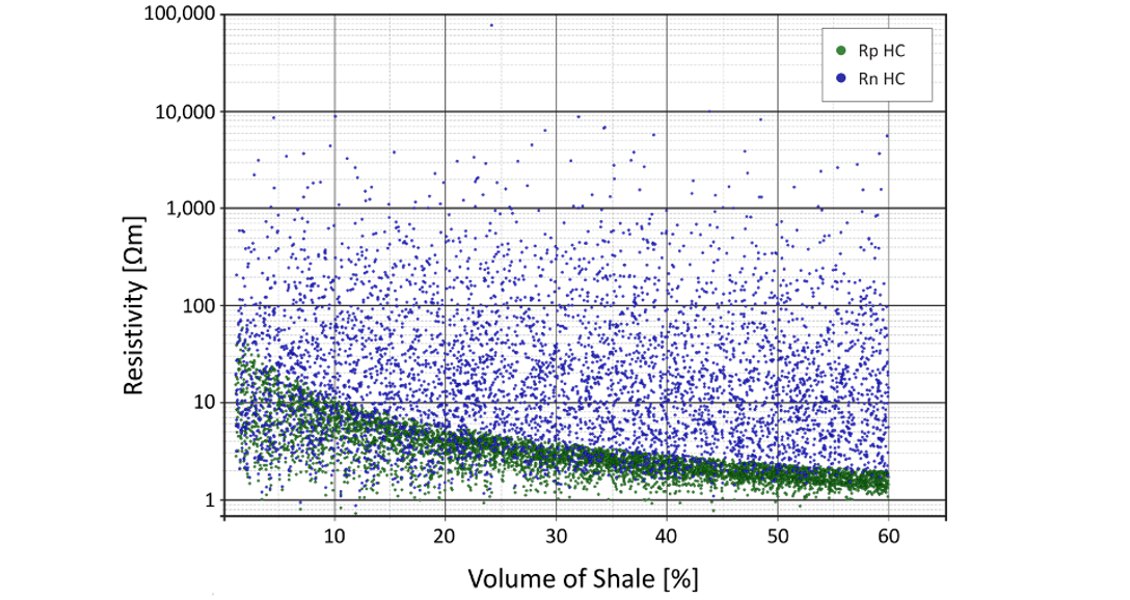
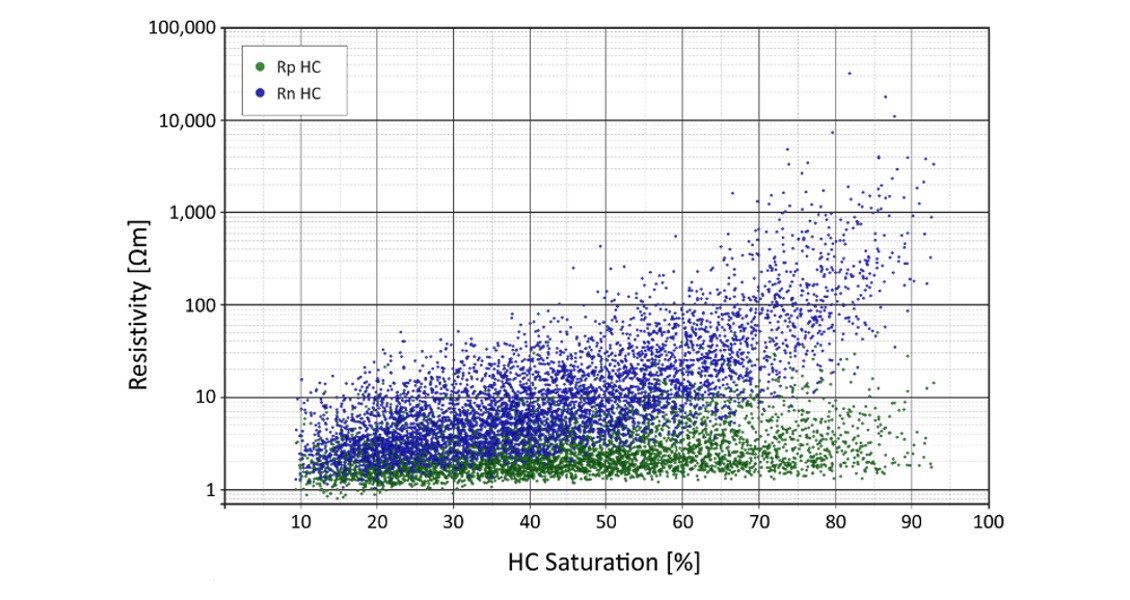
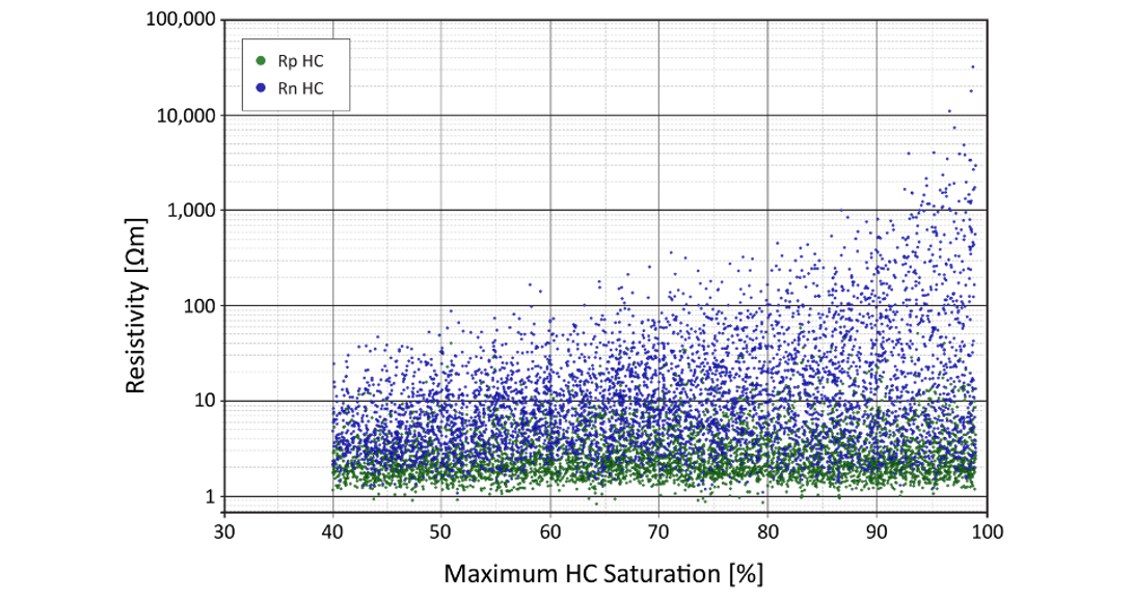
Primary drivers of reservoir-scale electrical anisotropy (differences between Rp and Rn), illustrated through a Monte Carlo reservoir simulation with broad input parameter ranges: (left) laminar shale volume, (middle) average HC saturation, (right) the maximum HC saturation present in any sand layer.
Primary drivers of reservoir-scale electrical anisotropy (differences between Rp and Rn), illustrated through a Monte Carlo reservoir simulation with broad input parameter ranges: (left) laminar shale volume, (middle) average HC saturation, (right) the maximum HC saturation present in any sand layer.
Primary drivers of reservoir-scale electrical anisotropy (differences between Rp and Rn), illustrated through a Monte Carlo reservoir simulation with broad input parameter ranges: (left) laminar shale volume, (middle) average HC saturation, (right) the maximum HC saturation present in any sand layer.
From the images shown above, it can be seen that large differences between Rp and Rn tend to arise when the volume of shale is moderate to high, the average hydrocarbon saturation is >60%, and the maximum hydrocarbon saturation is >85%. This maximum hydrocarbon saturation will be a function of the maximum reservoir permeability; if the permeability of some layers is high (due to coarse-grained sediment), the saturation of these layers will also be high. This is consistent with the aforementioned low-resistivity pay zones, characterised by low Rp (suppressed by the shales or low permeability/fine-grained water-filled sands), but high hydrocarbon productivity (coming from the coarse-grained parts of the reservoir, which are high permeability, high saturation, and drive-up the vertical resistivities).
The figure below shows results from a model with more realistic exploration-level parameter uncertainties: anisotropy ratios (Rn/Rp) of around 10 would be the norm in this case.
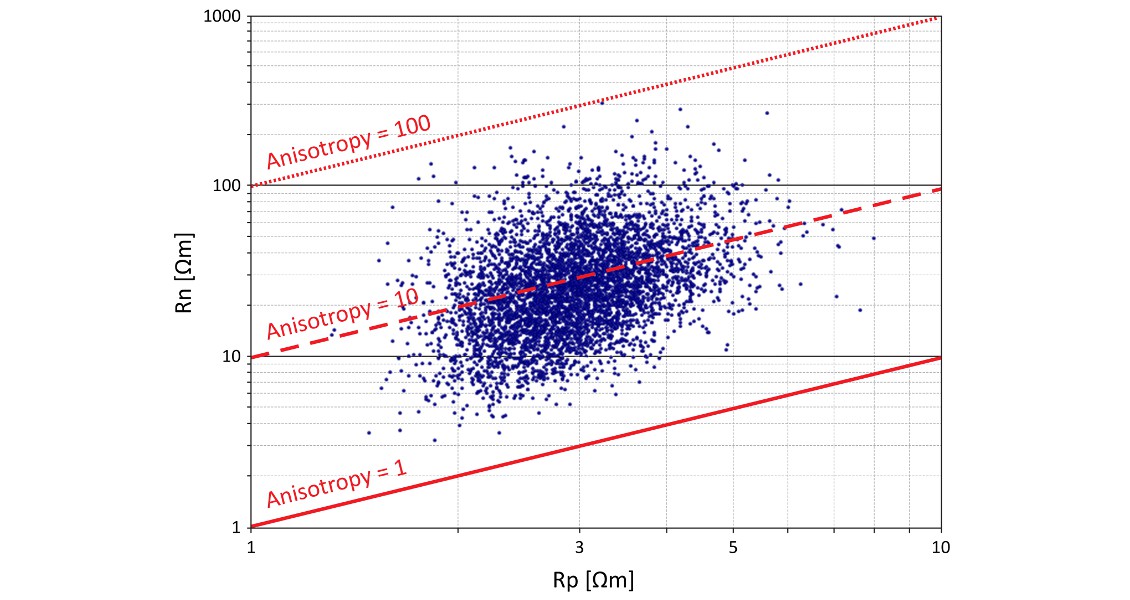
A realistic low-resistivity pay zone simulation. Left: Rn and Rp for each realisation of the Monte Carlo simulation; Right: the cumulative probability distribution for Rn and Rp with different fluids.
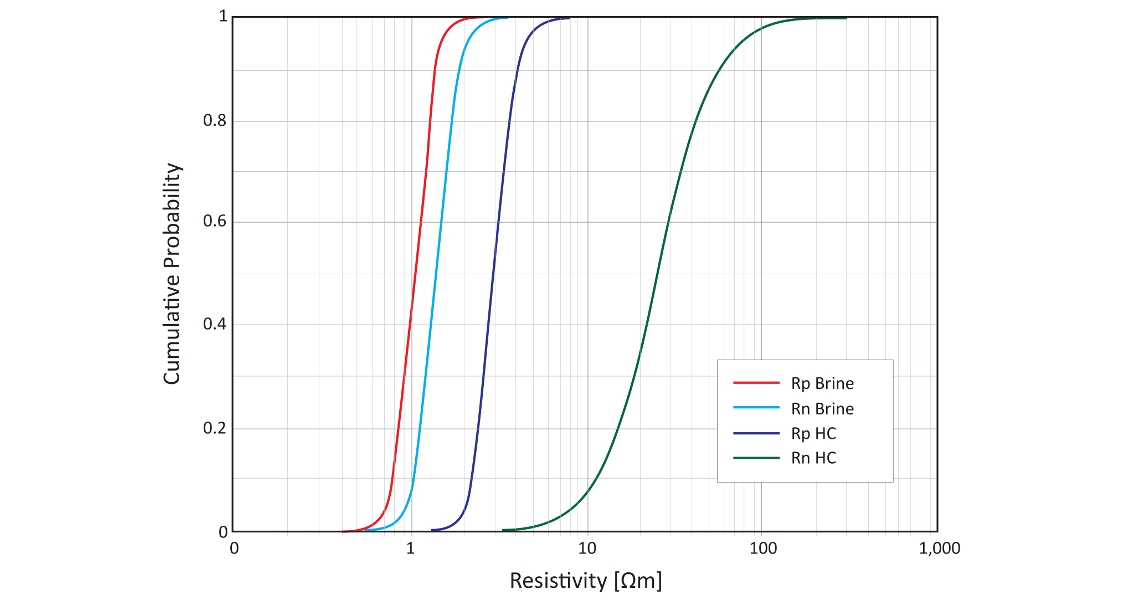
A realistic low-resistivity pay zone simulation. Left: Rn and Rp for each realisation of the Monte Carlo simulation; Right: the cumulative probability distribution for Rn and Rp with different fluids.
Aiding Interpretation
As can be seen, we have demonstrated here a low-resolution rock physics framework for relating CSEM-derived Rn measurements to reservoir properties, which can provide precise property estimates even in high-uncertainty settings. When additional calibration information is available, the same framework can be used to produce correspondingly more accurate constraints.
The synthetic simulation illustrates the power of the CSEM measurement for reservoir quality assessment in exploration: in contrast to the more widely used Rp log measurements, Rn remains high for a larger proportion of quality reservoir scenarios. For this reason, when faced with a low vertical resistivity from CSEM data, an interpreter is typically able to conclude that an exploration target has either an increased risk of thin reservoir, low saturation, or low horizontal permeability.