Reflection seismic is one of the fundamental ways of imaging the subsurface from a geological perspective. 2D and 3D seismic data are major sources of information in the oil industry for both onshore and offshore activities. Recently, this type of data has also been used in geothermal energy activities, carbon sequestration in geological reservoirs and wind energy, especially offshore. Other uses include mapping salt structures for their use as natural gas reservoirs (gas caverns), delimiting mineral deposits among other activities involving imaging of the subsurface.
In this short article we will cover the basics of seismic horizon interpretation and how this is used to obtain stratigraphic information.
Why are Some Reflectors Bright?
The amplitude of a seismic horizon will depend on the impedance contrast of the geological layers that define that horizon. When there is a large contrast of impedances, the absolute value of the amplitude of the corresponding reflector will be high; in other words, it will have a high absolute value of reflectivity. On a seismic trace this will correspond to a pronounced peak or trough. This type of reflector is called a hard event or a hard kick or a bright reflector. The best example is the seabed, where the low impedance of sea water and the much higher impedance of sediments will originate what is referred to as a ‘very bright’ reflector, with very high amplitudes.

(a) Variation of impedance, reflectivity and seismic profile according to various types of geological layers. (b) Example of a hard event, in this case the seabed. (Adapted from Virtual Seismic Atlas.) Source: SubSurfWiki.
Another example of very strong reflectors are igneous bodies (dykes, batholiths, etc.) intruded in sediments. The impedance of igneous rocks is much higher than that of most sediments, resulting in very bright contacts (i.e. seismic reflectors), with high reflectivity.
Mineralisations of various types are also often visible in seismic as bright reflectors because they have different characteristics to those of the surrounding rocks. In mineral exploration, if the regional geology is not a sedimentary basin, seismic quality is generally worse, but it can be very useful in identifying and characterising mineralisations, along with gravimetry and geomagnetic data.
Carbonate sediments, especially when they are compacted and lithified, generally have a higher impedance than other sediments like sandstones and shales, so they often appear as bright reflectors. Depending on whether they are reefs or more continuous structures (e.g. carbonate platforms) they can be discontinuous or continuous reflectors. Other examples of bright reflectors are those originating from layers of coal, where very low impedance results in a very low amplitude reflector.

Seismic line showing bright reflectors corresponding to the top of isolated reefs. Adapted from Virtual Seismic Atlas.
Diapirs and other bodies of mobile salt are very important in hydrocarbon exploration, in the storage of gas (and more recently hydrogen) and for some mineral resources. The salt, because it has high impedance, usually causes a bright positive reflector at the top, but the lateral and base limits of the salt are generally more difficult to identify.
Fluid Contacts and Hydrocarbon Reservoirs
Hydrocarbons in a reservoir will be arranged according to their density. Gas is at the top, followed by oil and associated water is at the bottom. The contacts between these fluids within the reservoir will be horizontal and in some cases they are visible in seismic. These contacts generally have limited lateral continuity, are horizontal (known as a flat spot) and have a different impedance to the layers above, below and laterally. This is a direct hydrocarbon indicator, or DHI. CO2 in carbon sequestration sites can also be monitored using seismic.

Example of a cross section (parallel to the coast) of a slope area, showing several sets of channels and an MTD. Left without interpretation, right with interpretation. Adapted from Virtual Seismic Atlas.
Horizon Interpretation Techniques
- Seismic horizons can be interpreted in 2D lines or in 3D volumes. There are numerous interpretation techniques that can be used, depending on the data and software available. However, after the initial quality control check of the data is made, the polarity noted and the existing wells displayed, the general steps are as follows:
- Define the horizon to be interpreted. This could be a top defined in the wells, based on lithostratigraphy or biostratigraphy; an unconformity; reservoir top or base; or another event that is visible on seismic. The definition of the concept of what is being interpreted is important when doubts arise on which reflector to follow in the interpretation, or whether the horizon’s extension is limited or not or similar issues.
- It is recommended that at least the main faults are interpreted. Small throws can be easily perceived and do not greatly affect the horizon mapping, but larger throws can originate mis-ties and erroneous interpretations.
- Start the interpretation from a point where you are sure of what you are interpreting – a top in a well or a seismic section with clear imaging and geometry.
- Define an interpretation spacing and interpret inlines and crosslines in a regular grid. The standard for 3D is to pick every 25 lines, but it can be tighter if more detailed mapping is needed or more spaced if you are working on a regional mapping project. In 2D data, all relevant lines should be mapped.
- Regular quality control checks should be carried out between inlines and crosslines, to avoid mis-ties.
- With 3D data the filling of the mapped grid spaces can be done by propagation or tracking; i.e., by getting the programme to automatically follow the mapped horizon, which all interpretation programmes allow. It can be undertaken in one go for the entire area, but it is recommended that it is done in portions to control the quality of the tracking. Seismic interpretation software has improved greatly over the years, with more ‘geological’ mapping algorithms, but human control is still key to ensuring reliable results.
- At the end of the propagation it is likely that there will still be spaces that are not interpreted, due to poor quality seismic, locally different seismic facies or other factors. Only in this situation, when it is impracticable to fill all spaces manually, should an interpolation (gridding) be made, which follows the mapped horizon rather than the seismic data. With 2D data, interpolation of the mapped horizon is the only way to obtain a 3D object.
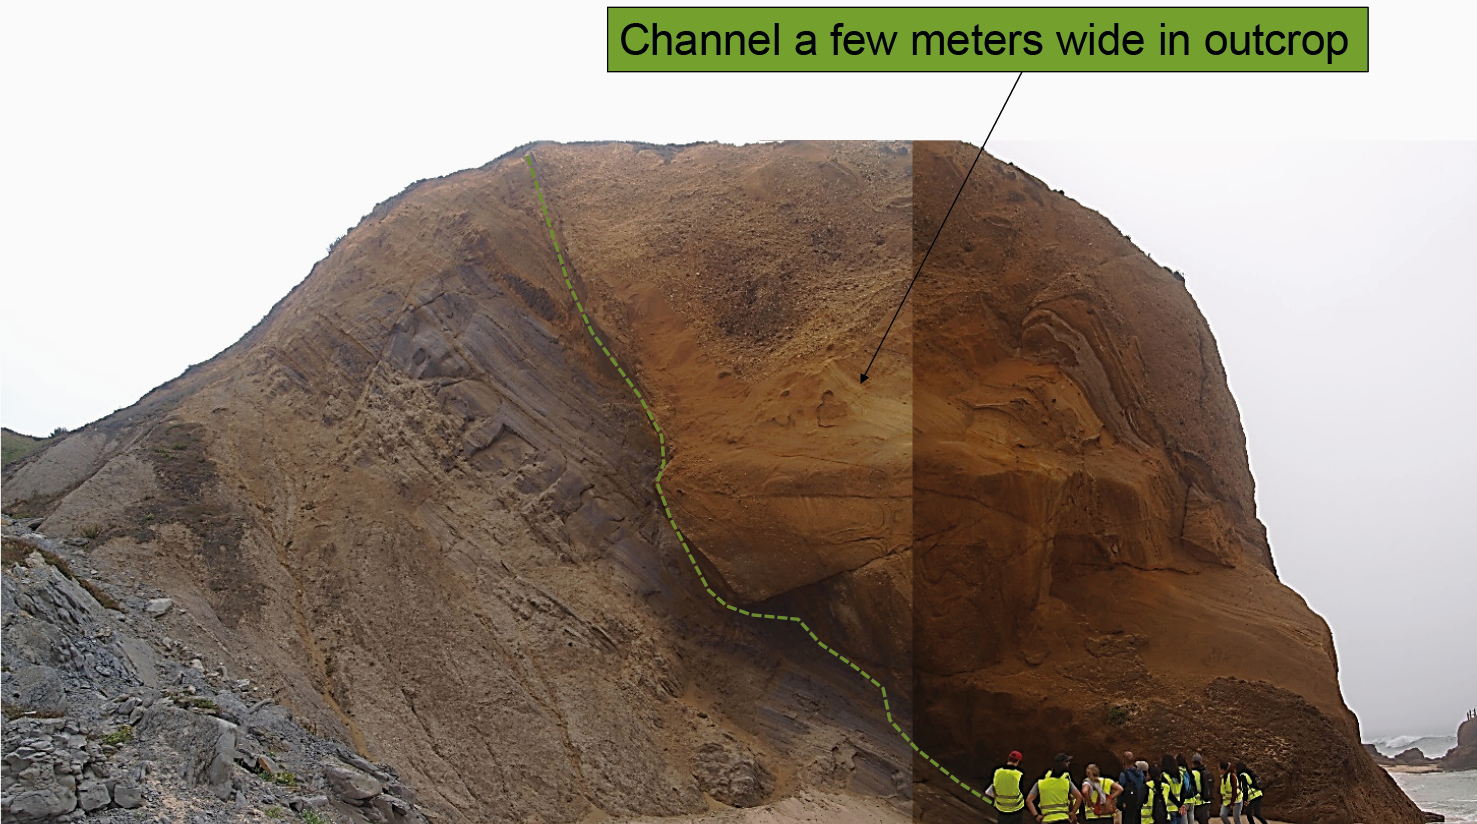
Example of a sandy channel outcrop cutting a clayey sequence in a slope area. Despite its apparent considerable size, on a seismic line it would be observed as a small point of higher amplitude. © Gil Machado.
Observing Scale and Continuity
The mapped horizons can extend laterally to occupy the entire seismic area or they can be found in only a part of it.
The principle of lateral continuity of strata was defined based on field observations, at the outcrop. This is valid across short distances, but at the seismic scale – kilometres – terminations of strata are observed. In fact, no stratum is truly continuous laterally; it always depends on the scale of observation. Similarly, the original horizontality principle is a good approximation for most observation scales, but in many cases, seismic horizons were not deposited in a manner that formed strictly horizontal features. The scale of observation at an outcrop rarely allows us to see stratal terminations, significant lateral variations or geometric relationships between strata, but on seismic data, due to its kilometric scale, these are often seen.

Scheme illustrating an unconformity (dashed red), putting in contact different lithologies and the expected seismic profile according to the impedance contrast. © Gil Machado.
One of the best examples of horizons with limited lateral extension (at the seismic scale) are internal channel reflectors. Longitudinally they can be very continuous, but in section they can be from several hundred metres to just a few metres wide, the latter being near the limit of the seismic resolution.
An example of sediments displaying lateral variations are mass transport deposits, which have internal chaotic facies such as discontinuous reflectors with different inclinations, but they can laterally grade to more continuous reflectors, corresponding to the terminal portion of the deposit. Other examples of discontinuous horizons are those that are eroded by more recent events. Often it is also possible to observe pinch-outs – lateral terminations of a reflector or set of reflectors. They can be channels, mass transport deposits, fans or other sedimentary mega-structures.
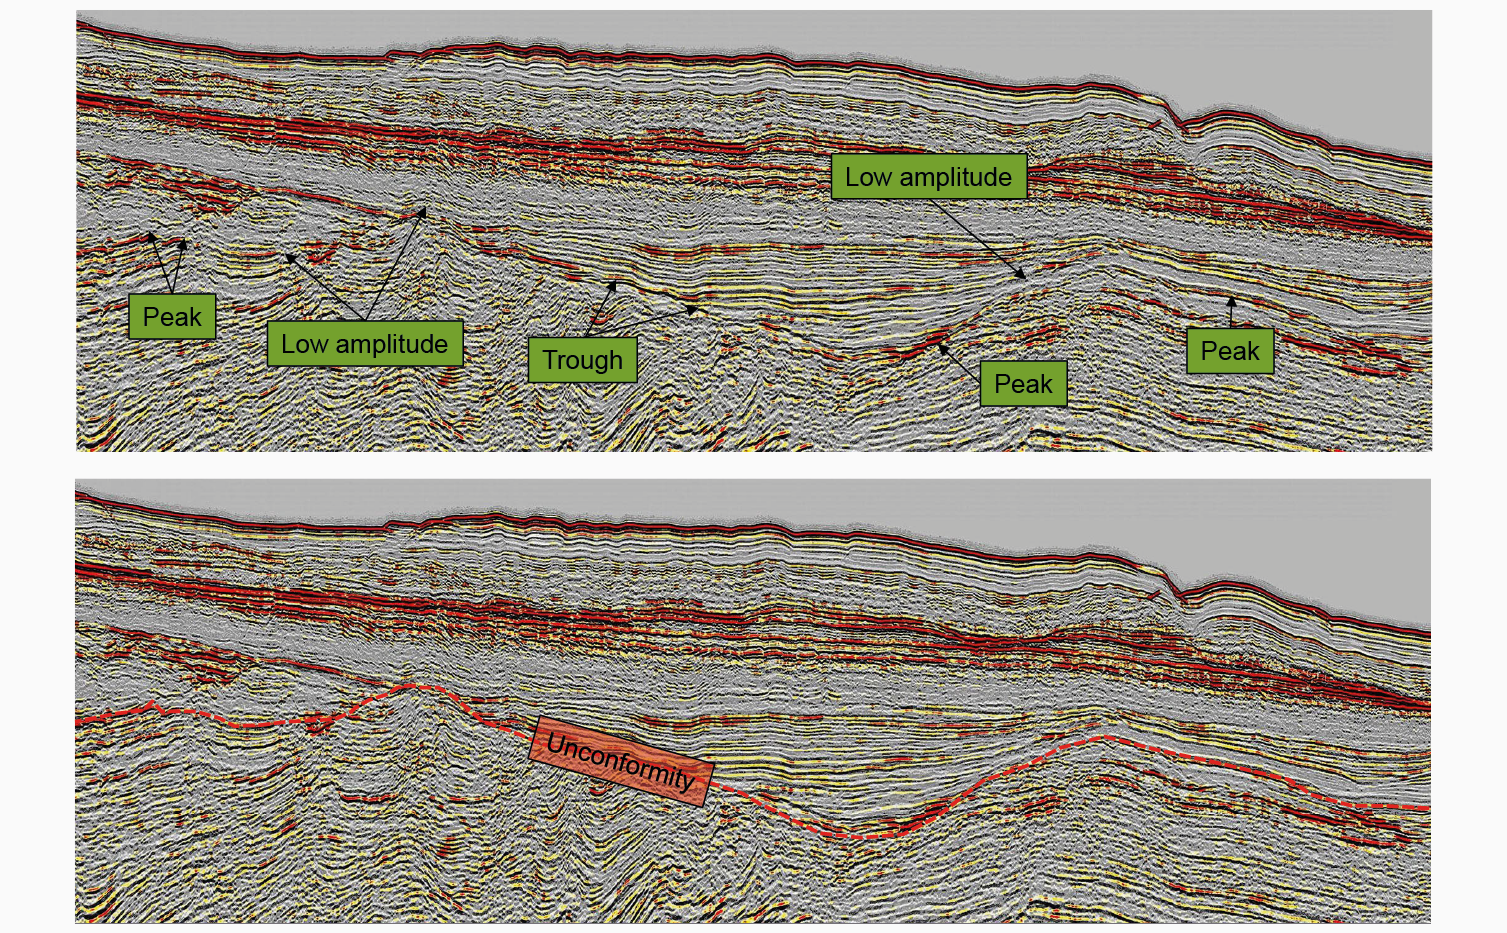
Example of a seismic line with an unconformity that puts different lithologies in contact. The horizon that corresponds to the unconformity will be positive (peak), negative (trough) or have a very low amplitude depending on the lithologies above and below. (Adapted from Virtual Seismic Atlas/ CGG.)
An unconformity, of either sedimentary or tectonic origin, puts different lithologies in contact. The seismic representation of an unconformity will depend on the impedance contrast at each point. If they are very similar lithologies (e.g. shale with shale) the contrast will be low and the reflector that marks the unconformity will be of low amplitude. However, if it is a limestone–shale contact, the contrast will be very high and the reflector will be a very pronounced trough. If it is a shale–limestone contact, the contrast will also be great, but marked by a pronounced peak. So the result of an unconformity on seismic is usually a horizon with changes in amplitude.
An Important Source
Seismic interpretation is a fantastic source of geological information for both commercial and academic work. Many other aspects can be explored, including seismic attributes, structural interpretation, quantitative geophysics and fluid flow, among others.