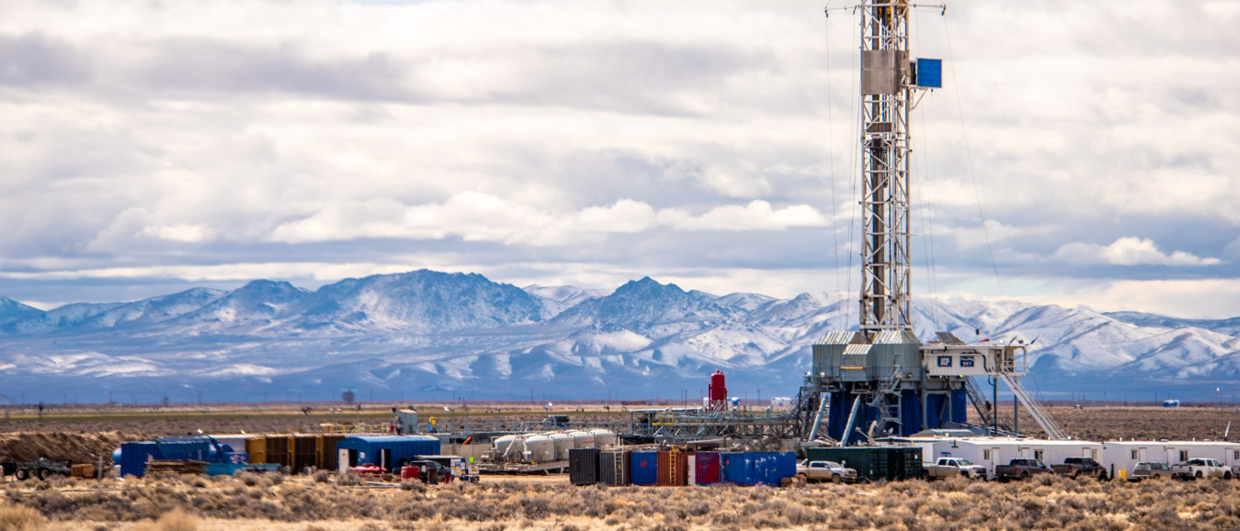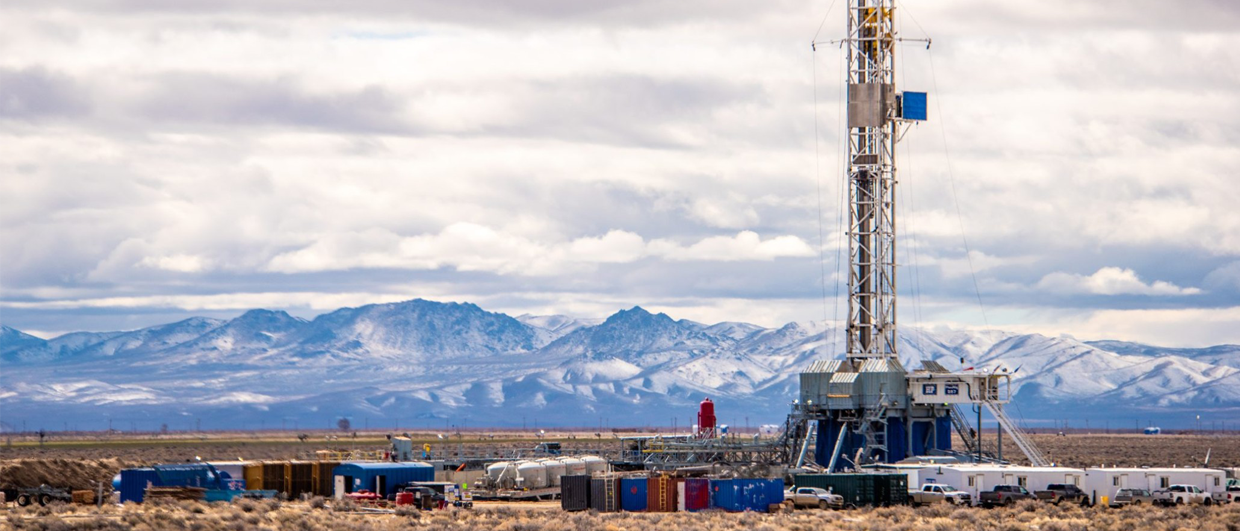
Nevada: land of geothermal potential. Photo: Nick_the_Photographer via Pixabay.
World’s largest geothermal reserves?
The Fervo Cape Station Enhanced Geothermal Systems (EGS) project in Utah has cited a reserves report by a petroleum consultant that claims the project can support over 5 GW of development. This would make it by far the largest geothermal project in the world. But how likely is this? Based on public domain information, Elliot Yearsley analyses the situation.
By convention, geothermal reserves are normally reported as net recoverable energy – usually as Megawatts of electrical generating power (MWe) for a specified period of time – 30 years is often used. It is also helpful to state the assumed capacity factor and internal power requirements. For example, geothermal facilities with an installed capacity of 100 MWe, a capacity factor of 90 %, and 5 % internal power use would deliver, on average, 85 MWe of net power sales. A 5 % internal power requirement, also called parasitic load, is an approximate average for many operating plants, but pumped well projects typically require 20-25 %. As we shall see, EGS projects would likely require an even higher parasitic load.
Guidelines for the estimation of geothermal reserves are outlined in a number of reporting codes, including the Australian Geothermal Reporting Code (2010). The Australian code mimics the SPE Petroleum Resources Management System (PRMS) in key ways, including the distinction between resources and reserves. Importantly, reserves require that deliverability must have been demonstrated and the thermal energy is economically recoverable. Typically, demonstrating deliverability requires either production history or well testing that establishes stable flow rates.
The Cape Station well test
The concept of EGS has been around for many years, but recent breakthroughs in drilling costs and hydraulic stimulation efficiency by Fervo Energy at their project in Cape Station, Utah, have brought EGS to the forefront again. Fervo has stated that Cape Station will deliver 100 MWe “to the grid” in 2026 and an additional 400 MWe in 2028.
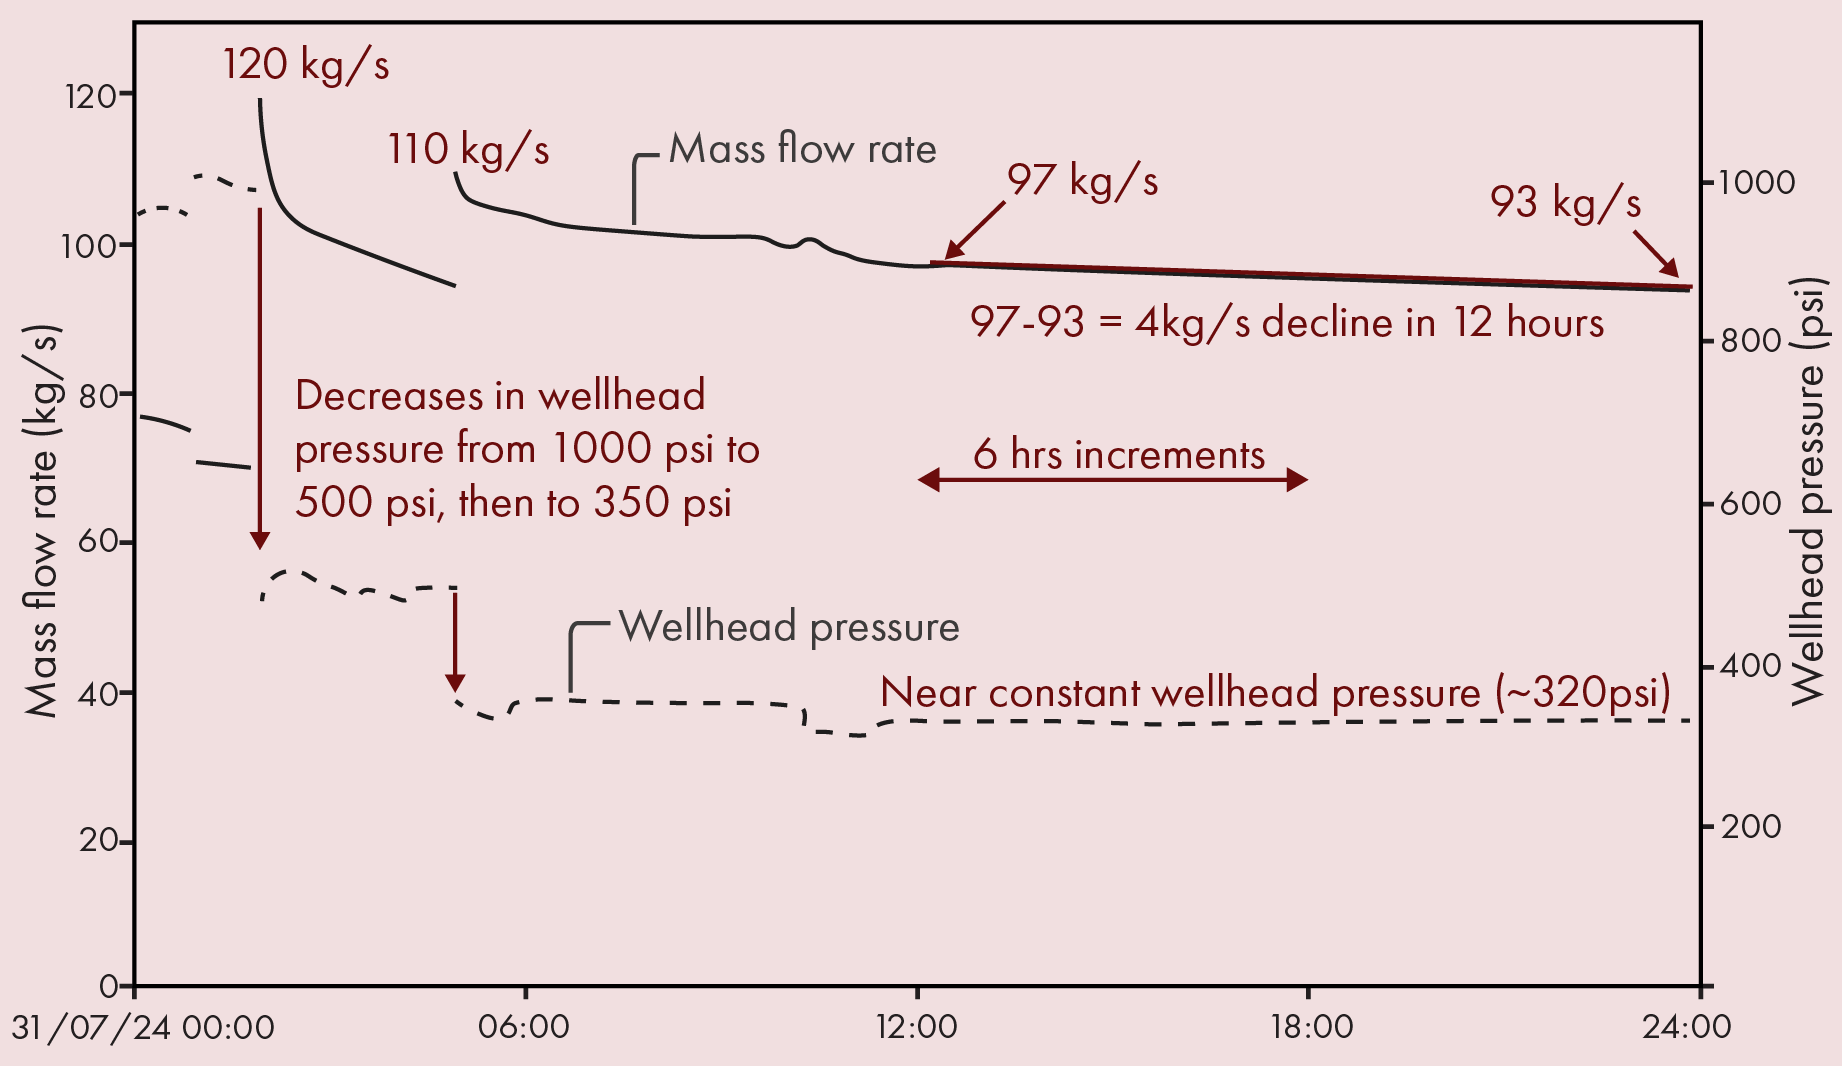
While Fervo has amply documented their breakthroughs in drilling costs and hydraulic stimulation efficiency, surprisingly little actual production or well test information on Cape Station is available in the public domain. Fervo published test results for the first production well on their website in September 2024. In that paper, Fervo states that the production rate was “levelling out at approximately 93 kilograms per second (kg/s) after the first day of production”. But a closer look at the plot provided by Fervo suggests that this is not the case; the rate is shown to decline from about 97 kg/s to 93 kg/s over the last 12 hours shown, and this decline trend appears to be continuing at the end of the plot.
Deliverability
In geothermal lexicon, deliverability is the capability of production wells to reliably flow at stable rates and wellhead pressures for the forecast period – usually years. Flow rate is generally a function of wellhead pressure, and as can be seen in the figure, the production rate is temporarily increased each time the wellhead pressure is reduced. At some point, the wellhead pressure must be held constant as stable deliverability requires stable wellhead pressures. The minimum wellhead pressure for the production temperature of 383° F specified by Fervo is about 225 psi.
It’s not unusual for conventional geothermal wells to go through a transient period during testing – declining in rate before stabilizing. But these declines are generally modest – usually about 10-20 % over an initial period of 30 days, often settling into a long term decline of 3-6 % per year. The declines observed in the figure are 10-20 % in a matter of hours after each wellhead pressure adjustment, settling into an 8 % per day decline trend in the last 12 hours. We don’t know what the production rate does after the 24 hour period shown – perhaps it does “level out”, but if so, why not show this? Other key data not shown is the injection rate required to maintain production.
Well test results from Fervo’s EGS project in Nevada show 37 days of data. The longest period of constant wellhead pressure and injection during this test lasts about 7 days, during which the production rate declines 17 %, or an average of about 2.5 % per day. The net power output is shown by Fervo to decline from about 2.1 MWe to 1.7 MWe during that 7-day time period.
The Cape Station reserves report
Fervo refers to a reserves report obtained from Degolyer and MacNaughton (D&M), which D&M state is in accordance with the SPE-PRMS. In that case, they would be aware of the difference between reserves and resources; the former require that production come from commercially established technology, whereas resources are potentially recoverable and can come from unproven production technology. In other words – still needs to be proven. It’s difficult to see how the reserves criteria could have been met for Cape Station prior to commercial production. D&M may have been convinced by Fervo’s project in Nevada, which is advertised as a “commercial scale demonstration”. But there is no production history for this project that is available in the public domain, and is shown to deliver only about 2 MWe, or less.
Fervo states that the D&M reserves report provides external verification of the ability of the Cape Station project to deliver contracted power to customers and support over 5 GW (5,000 MW) of development. D&M are not known for their geothermal experience, and even bona fide geothermal experts would likely express their estimates of resources or reserves as opinion, not verification.
D&M use the heat-in-place method, also known as stored heat, and state that Fervo’s enhanced geothermal system “successfully unlocks thermal recovery factors ranging from 50 to 60%, tripling the amount of useful thermal energy reserves compared to conventional geothermal technology”. For context, and a cautionary tale, a useful summary of conventional geothermal recovery factors comes from Malcom Grant, who found that recovery factors depend strongly on the definition of volume and reference temperature. For a wide definition of volume, i.e. one that includes undrilled, untested volumes and an ambient reference temperature of 20°C, Grant found that the average recovery factor was about 5 %. The power technology proposed for Cape Station is a binary heat exchange system with reference temperatures significantly above 20° C ambient, which would reduce this recovery factor.
Parasitic load
Fervo states that the production well with data shown in the figure had a sustained output of 8-10 MW, and indicates that the brine effectiveness is 94 kWe per kg/s flow rate. Fervo does not say if this is net or gross, but this appears to be gross, so before deducting parasitic load. If so, the last flow rate shown in the figure of 93 kg/s corresponds to 8.7 MWe (gross), but as noted above it is not clear that this is “sustained” beyond the 24-hour period shown.
To deduct parasitic load, we will have to estimate the re-injection pump power. Fervo does not include the re-injection pump rate, but data provided for the Nevada well test suggests that about 120 % of the production rate is a reasonable guess. Fervo includes a range of injection pressures of 2,000-2,300 psi and we know the wellhead pressure. Using this approximate pump pressure and injection rate, the re-injection pump power can be estimated at about 2.5 MW*, making the net output roughly 6.2 MWe at a production flow rate of 93 kg/s. This corresponds to a parasitic load of about 30 %; an important consideration for determining net power delivered to the grid.
Raising questions
Fervo have made breakthroughs in drilling costs and hydraulic stimulation efficiency, but a close look at the actual well test results available in the public domain raises questions about the sustainability of the production flow rates. The decline trends observed in the Cape Station (and Nevada) well tests make it difficult to describe these tests as having demonstrated deliverability in the sense of stable flow rates at constant wellhead pressures over meaningful periods of time.
There are also questions on gross versus net power output – which Fervo doesn’t address. The company also doesn’t mention capacity factor. The actual thermal recovery factor is unknown, but the 50-60 % used for the reserves report has no historical analogy and is an order of magnitude higher than the average of documented conventional geothermal recovery factors. Only time will tell, but that’s a key point – this unprecedented recovery factor claim is unproven through production.
The meaning of deliverability and reserves versus resources is more than just a matter of semantics. These are the underpinnings of reservoir engineering standards developed over decades – seemingly forgotten in the enthusiasm of the moment. But this could be more of a Wile E. Coyote moment than a Mitchell moment**.
*Methodology for calculating pump power is given in the Appendix of Common Characteristics of Pumped Wells in Geothermal Power Projects, Yearsley, E.N., New Zealand Geothermal Workshop (2019).
**Mitchell is credited with pioneering oil & gas hydraulic fracturing. EGS cheerleaders like to say that Fervo has experienced a “Mitchell moment”. But rather than a moment, Mitchell Energy spent the better part of 20 years proving their production technology. See for example: George P. Mitchell and the Barnett Shale, Journal of Petroleum Technology (2013). A telling excerpt from that paper: “Since no productive analogs could be identified, extended production histories were required to determine estimated ultimate recoveries (EURs). Initially after a well was stimulated and brought on production, a minimal amount of reserves would be attributed to it and when production surpassed that booking, the reserves would be revised upward.”
More from Elliot Yearsley:
Critical look at Fervo Cape Station data raises questions over sustainability – GeoExpro
Pumped geothermal power projects – a global overview – GeoExpro