Ohaaki geothermal power plant, New Zealand. Photography Joshua Daniels via Adobe Stock.
Building a reservoir model for a geothermal field
A different kettle of fish compared to an oilfield model
The first well in the Ohaaki geothermal field in New Zealand was drilled in 1965. However, it lasted until 1989 before power production really started, even though large-scale testing of wells had taken place before the commissioning of the 116 MWe power plant.
Over time, different models have been built of the subsurface with the aim to better understand the decline in steam production, and therefore allowing a better forecast of what was still to be produced. This seems like a useful exercise, because the decline rates were quite high, immediately from the start of production, as a new paper published in Geothermics describes.
The first model of the Ohaaki field published in 1977 consisted of just one single reservoir block – or grid cell – that matched pressure drop by recharge flow. This also allowed making guided estimates of total reservoir volume. Subsequent models also included the CO2 component, which is quite high in the field.
From 2001 onwards, the first more advanced 3D models started to make an appearance, culminating in a model consisting of 35,446 blocks in 2015. Soon after, though, it was realised that the model had to be deepened, as some of the more recent wells were getting too close to the base of the model that was used at the time. This added about 3,000 more blocks to it.
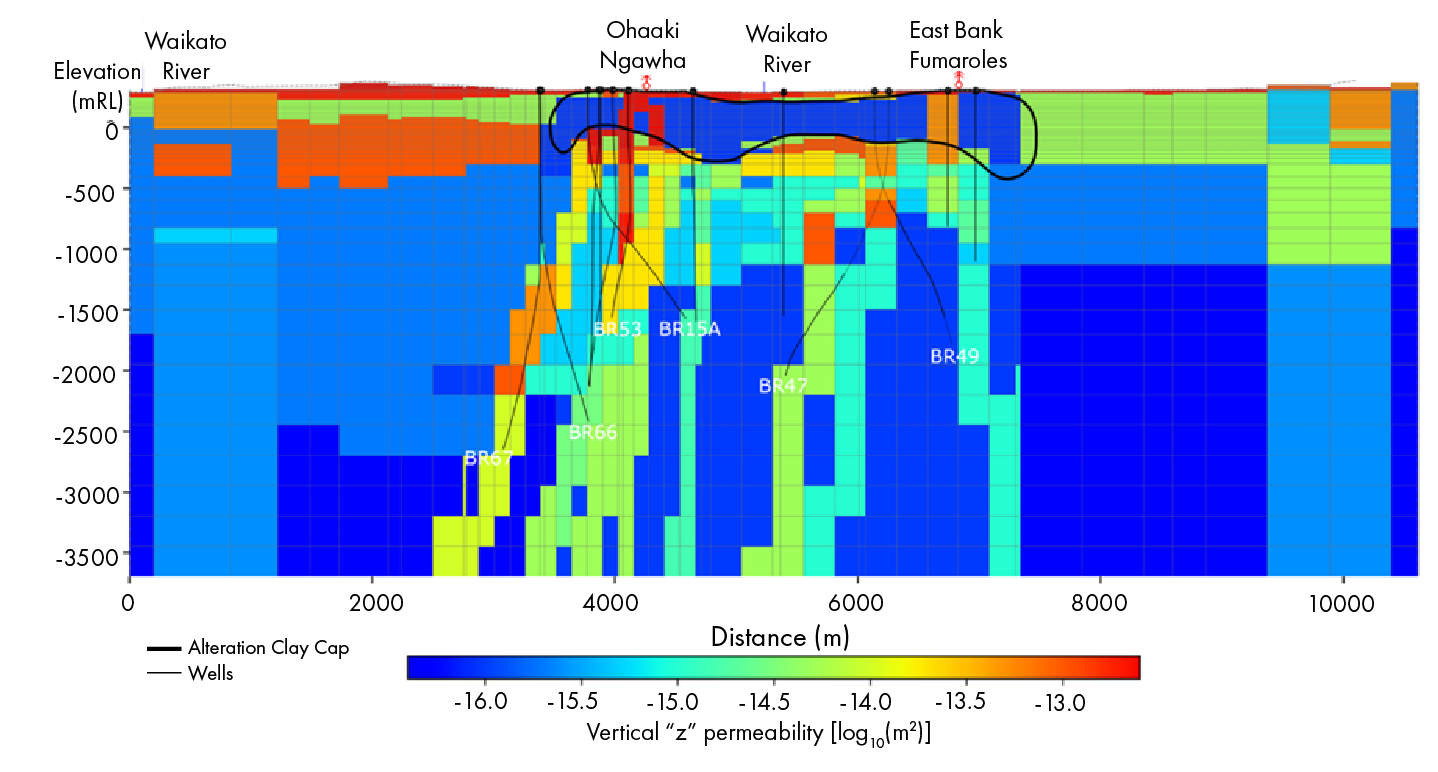
It is only in recent years that some geological features that have been known for a long time have been explicitly incorporated into the model of the geothermal field. The main features are the clay cap that is present at a shallow depth, forming an impermeable horizon for fluid migration from below, and the deep-seated faults that form important conduits for the heat. Combined with the porous nature in the shallow subsurface, another feature that was introduced is a dual porosity version that allows matrix and fault/fracture fluid flow.
The construction of the 3D model has been aided by magneto-telluric data, deeper wells, and the use of tracer technology to better understand fluid pathways.
It is interesting to see, when looking at the model cross-sections in the paper, how faults are represented. Rather than lines that offset reservoirs sections from each other, such as is the case in reservoir models in oil and gas, the faults are assigned grid blocks in this geothermal model too. It is no surprise, as it is the faults that support the fluid flow, much more than the surrounding rocks. The faults can nicely be recognised in the vertical permeability cross-section below.
The authors conclude that their model fits field data better than previous models, so the mission is completed. However, they do describe a misfit between model results and observed data from some deep wells, which required input from reservoir engineers to learn that the contribution from the deeper section in these wells had deteriorated immediately from the start of production. A good example of the benefit of talking to each other.