Normal faulting in sandstone. Photography: Molly Turko.
The structural risk of vertically exaggerated cross-sections
Structural geology can be predictable, and it’s often a geometry problem, until it isn’t
It is quite common for seismic lines to be displayed with high degrees of vertical exaggeration. However, vertically exaggerated sections can skew the true geometry of a basin and provide wrong hints to deciphering its structural style.
According to Andersonian Fault Theory, the angle at which faults form in relation to the principle stresses can be reasonably predicted for a given stress regime. As an example, we often expect normal faults to form at ~60° to horizontal and thrust faults at ~30° to horizontal.
However, when a cross-section is stretched, it can cause the dip of the faults to look very steep. The faults in the figures are shown at a 1:1 scale and at 1:4 vertical exaggeration. While the vertically exaggerated section highlights the stratigraphy, the high angle of the faulting may lead to inaccurate structural interpretations. For example, the bottom left illustration may appear like a strike-slip structure and a small pull-apart basin. However, the upper one-to-one cross-section is a clear example of normal faulting in a rift basin.
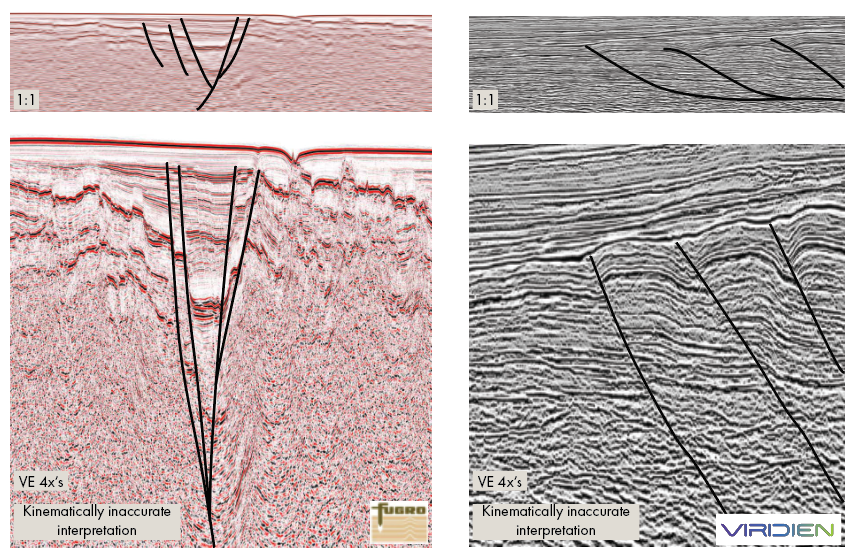
Another inaccurate interpretation is shown in the bottom right part of the figure. In the vertically exaggerated section, the faults look like high-angle reverse faults. Without additional information, one could look at this and assume these are basement-rooted faults, with the high angle indicating either strike-slip motion or possible inversion of earlier normal faults. However, when the section is displayed at a one-to-one scale, it becomes much clearer that these are typical low-angle thrust faults that sole out onto a decollement/detachment and are not basement rooted.
These examples are a reminder to look at seismic data at a one-to-one scale. They illustrate how structures, such as faults, can be skewed, posing a risk for kinematically inaccurate interpretations.