How to identify fluid migration with 1D models and temperature data
In my early days in basin modelling, I had a tendency to prefer complex 3D models, assuming the more equations and resolution in the model the better. I eventually learned to appreciate the power of simplicity and 1D models
One revealing experience occurred while I was working in a basin offshore Thailand. I only had temperature data from several wells. Once a 1D model was built for each of these wells in Genesis, I noticed that most of them could be calibrated with similar parameters for sediment base heatflow, assuming crustal thickness and radioactive heat generation. However, this did not work for a couple of wells.
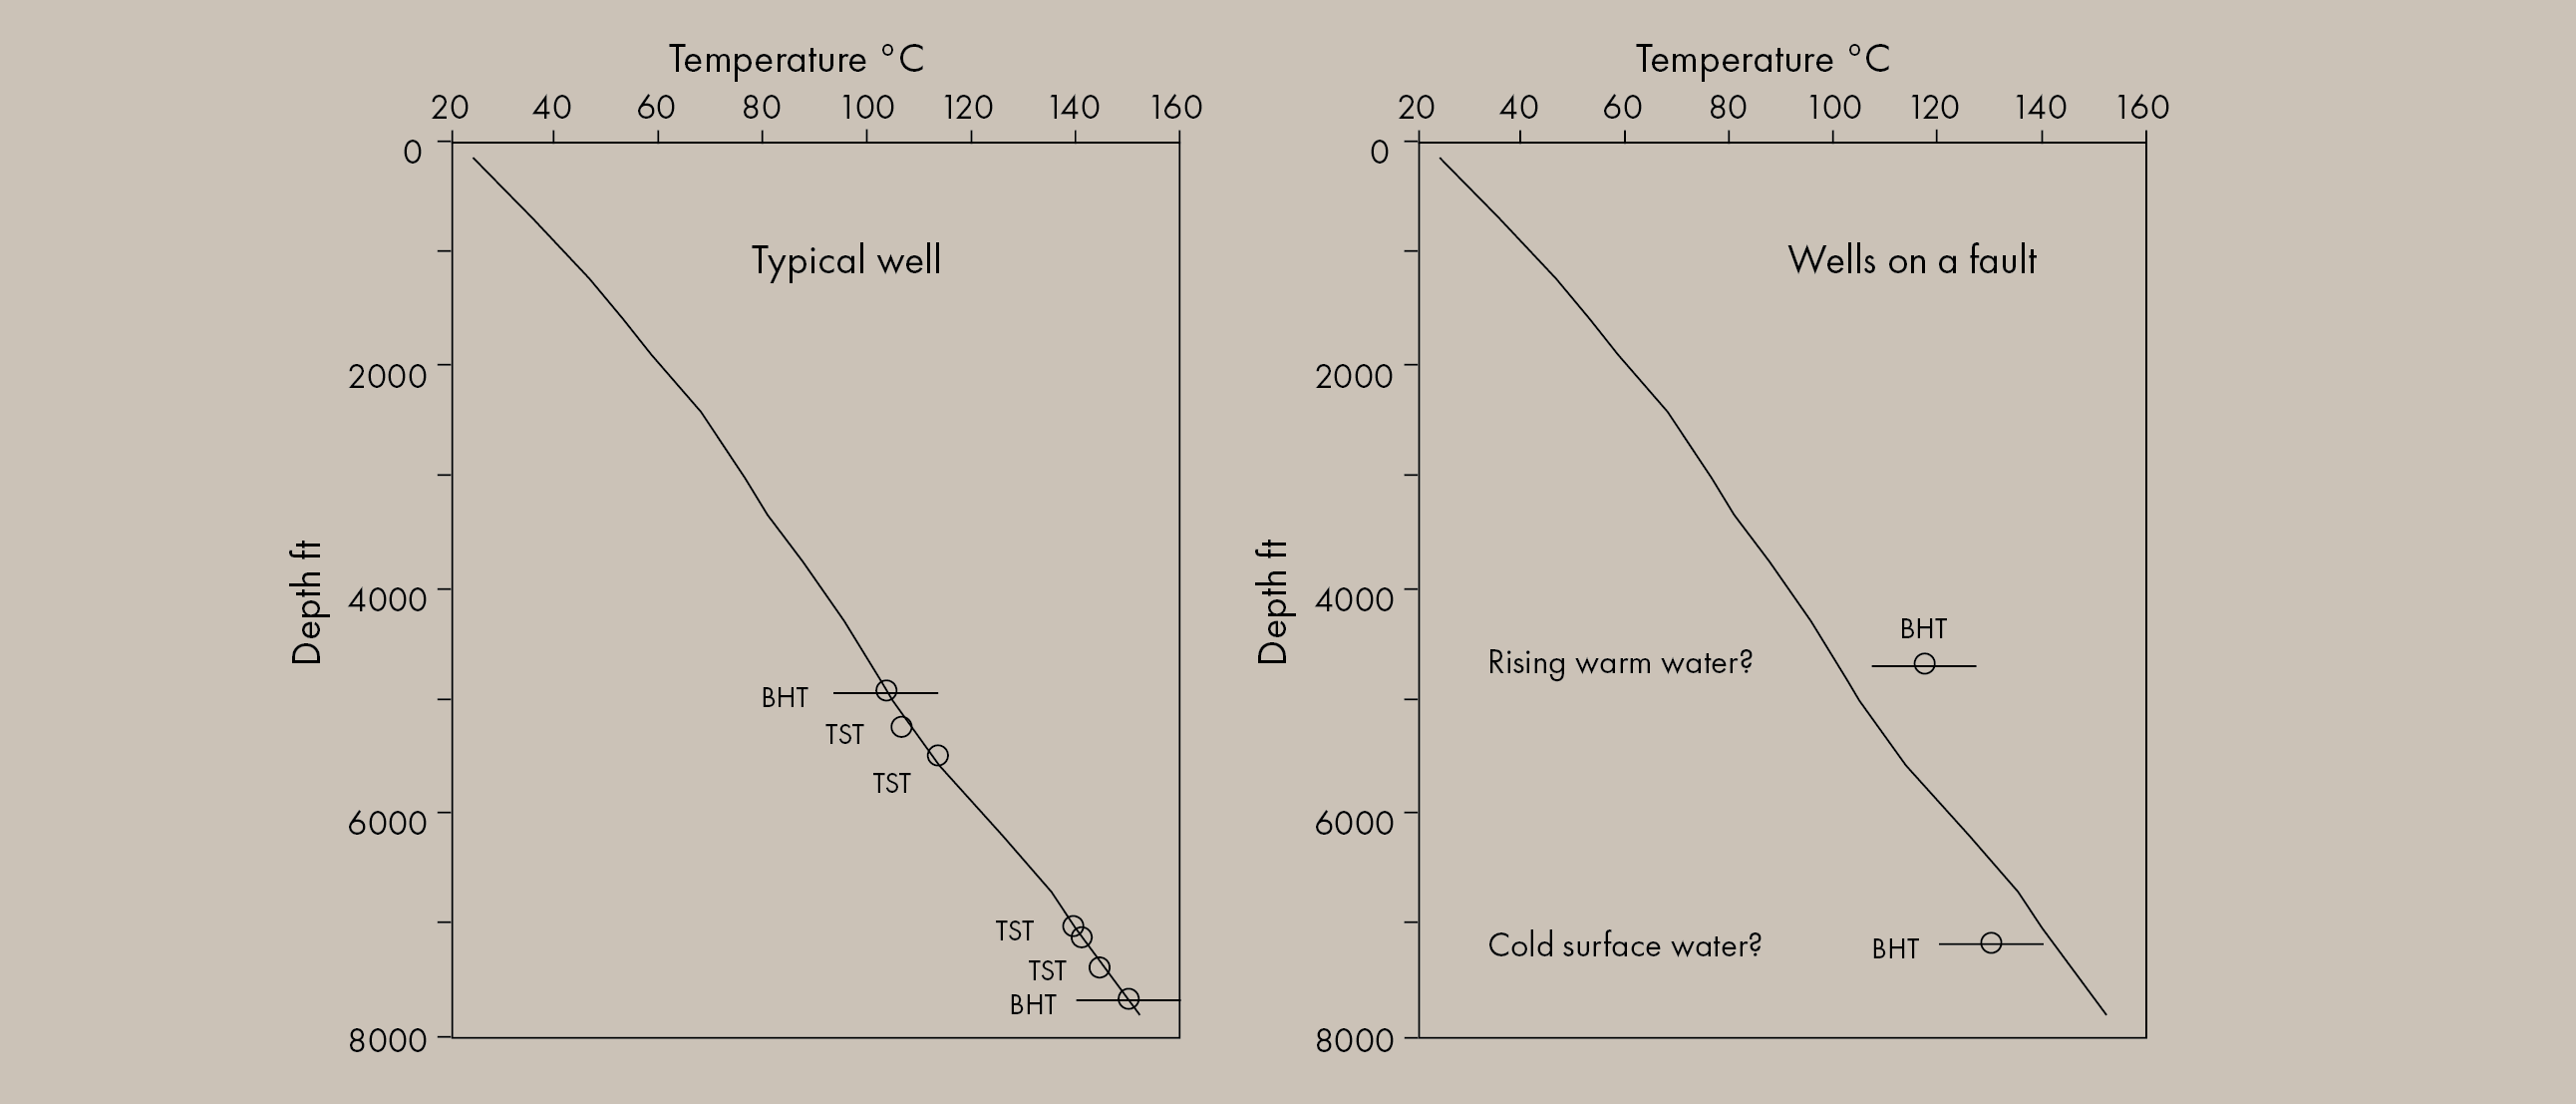
These two wells had two corrected borehole temperatures – the shallower one too high and the deeper one too low. I tried to explore the area in 3D using Trinity and to see if there was a relationship with basement morphology. I couldn’t see any. Various interpretations came to mind, the first being issues with the data quality. Unfortunately, I had limited information on the origin of the data, so I could not investigate the quality.
I did have a fault dataset though – a rather unique experience in my modelling career up to that point. It turned out that both of the problematic wells were located on a fault not too far from each other. The most straightforward explanation was a hydrothermal system along the fault where the deeper temperatures were suppressed by cool surface waters moving from nearby, and the upper temperatures were elevated by rising warm water.
A few years later, I encountered another example while working in a basin offshore South America. I had several wells calibrated with temperature and vitrinite reflectance data with excellent consistency and detail. One of the wells, though, had a few anomalous elevated temperature measurements in the shallow Cenozoic section. At the same time, the deeper temperature and vitrinite data could be perfectly fitted with a model following the same consistent parameters as in the other wells.
I did not have vitrinite data in the shallow section to cross-check the temperature signature, but the fact that a couple of data points consistently showed similar temperatures indicated the signal was likely real. The well was located on a shelf, and the best explanation was that the elevated temperatures recorded migrating fluids along a stratigraphic sequence from a deep basin up the shelf. Elsewhere in the basin, a similar migration route must have been active to fill a known major onshore oil field.
Basin modelling can provide valuable insights into detailed processes with unexpected resolution for such a large-scale model. It shows that every bit of data counts and that we need to invest in a detailed data analysis and understand individual well models in the context of the entire 3D model. Unfortunately, a typical client request for a “quick modelling study” often risks overlooking half of the potential insights these models can offer.