Northern North Sea: A decade of seismic acquisition and exploration success
How progressive uplift in seismic data quality has facilitated the de-risking of prospects across the busiest exploration hotspot of the Norwegian Continental Shelf
In this article, we go back more than ten years to 2013, when the area west and north of the giant Troll field experienced a sudden spike of renewed exploration interest. It was the year after the discovery of the Nova field (then named Skarfjell), following the discovery of Grosbeak in 2009, both by Wintershall.
It was a particular moment for the Norwegian Continental Shelf, mainly because the Grosbeak – Nova structure had been drilled before, in 1984. At the time, Mobil had concluded that the well was dry, despite elevated gas readings. It took a “missed-pay” analysis to flag that there may indeed be something more to go after. And that turned out to be the case, with the discoveries currently estimated to contain around 180 million barrels of oil equivalent.
Grosbeak and Nova were the starting shot for Viridien (then CGG) to come up with the plan to acquire new seismic data in the area. At the time, in 2013, only a patchwork of older 3D surveys was available and no broadband data existed at all. The company realized that Grosbeak and Nova may well trigger the area to be explored more, and better seismic data was needed to de-risk the prospects that are not anymore in the same league as the giants Statfjord or Troll. It was therefore paramount to get the seismic imaging correct when it comes to estimating the potential size of the targeted closures.
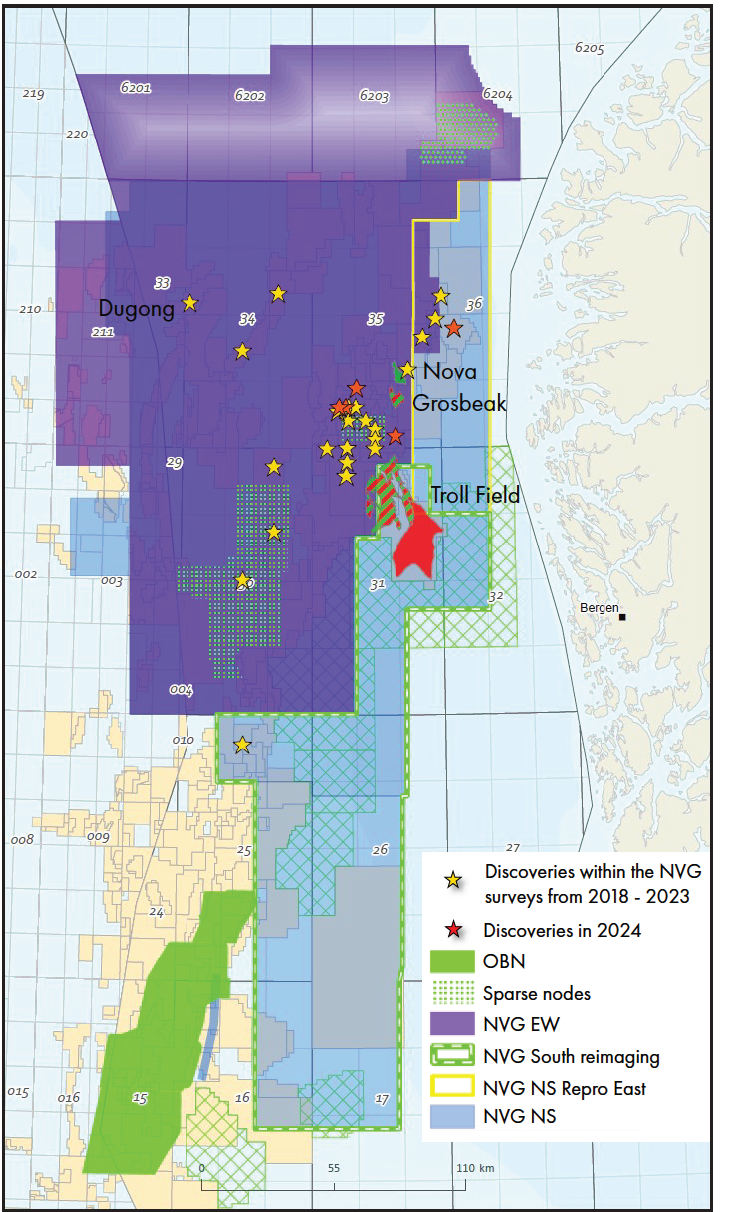
Over the course of three years, from 2014 to 2016, Viridien covered the entire Northern North Sea area with new broadband data in a north-south acquisition, resulting in an area of more than 36,000 km2 to be newly imaged.
This dataset contributed to many discoveries, as the new survey brought a regionally consistent dataset with high resolution and signal-to-noise ratio compared to the older and more patchy datasets. This facilitated the possibility to both perform detailed mapping of relatively small and complex structures as well as a consistent mapping of reservoir trends and fault patterns. Attribute analysis, such as AVO and frequency analysis through RGB colour blending, also became more reliable with the uniform dataset.
In the following years, from 2017 to 2024, a total of 21 potential economic discoveries have been made in the area, with the most recent announced in November this year.
Expanding footprints and purposes
Covering the Northern North Sea area with broadband seismic data was only the start. In subsequent years, more areas were added, and further processing was carried out.
In 2018, the Stord Basin and surrounding structural elements also entered the broadband age, with a further 8,900 km2 added. This survey was instrumental in the drilling of the Stovegolvet exploration well in 2021, which unfortunately turned out dry. However, a number of CCS licenses were awarded in this area recently, underpinning a complete re-imaging of the data set.
In addition to the acquisition of the Stord Basin survey, 2018 also saw the pre-stack depth migration imaging completed for the entire Northern Viking Graben survey.
From broadband to multi-azimuth
The year 2020 saw another phase in the imaging of the Northern North Sea area, which was again driven by exploration activity. In this case, it was the discovery of Dugong by Neptune Energy and partners in Quad 34 just west of the Snorre field. Dugong represents a typical example of near-field exploration success, in an area that is structurally more complex than most of the earlier and much larger Northern North Sea discoveries.
In order to better image the Rannoch Formation primary reservoir, which relies on truncation trapping and fault sealing, Viridien acquired a small east-west IsoMetrix pilot survey across the Dugong find. This resulted in the first Dual Azimuth coverage in the area when combined with the north-south broadband acquisition obtained earlier.
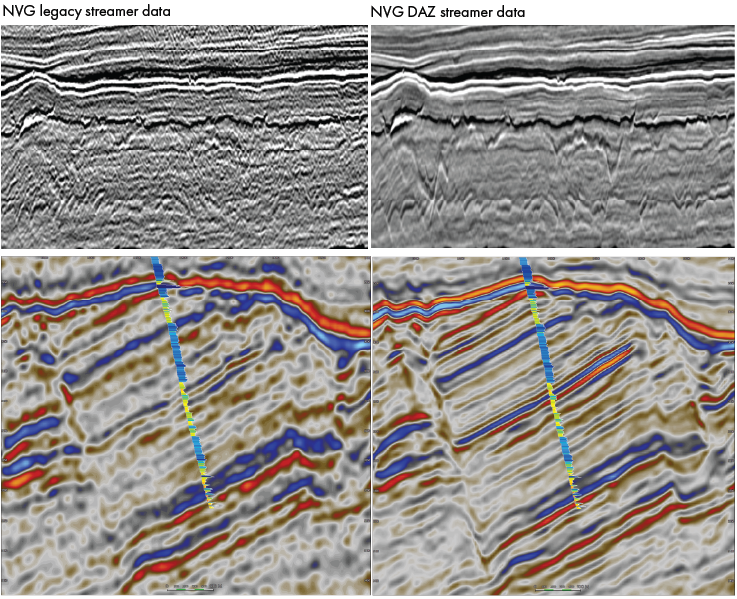
The uplift in imaging that resulted from the dual-azimuth dataset around Dugong provided the business case to expand the area of east-west acquisition in 2021 to 2023. The dual-azimuth provides superior data due to the improved illumination from perpendicular sampling, improved signal to noise by leveraging the second azimuth in the velocity model building and more optimal imaging.
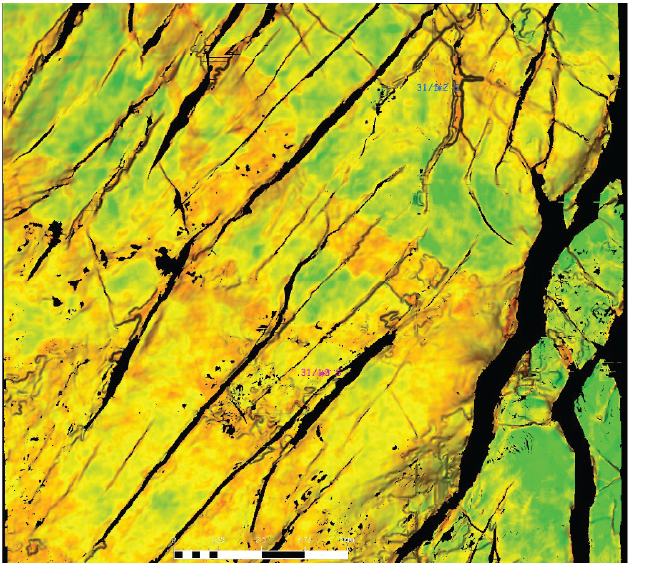
The improvement in the data quality is demonstrated in Figure 2 showing the Jurassic section in a rotated fault block with Cook Fm reservoir target and the Paleogene injectites play with steep dips in multiple directions. Figure 3 shows an example of frequency extraction and RGB blending of an interval in the Brent Group west of the Troll field where sedimentary trends and features can now be identified.
But that was not all. Around the Fram area, the company trialed its first hybrid Ocean Bottom Node acquisition during the same year, covering the Swisher discovery and undrilled fault blocks.
Unlocking FWI for deeper targets
The need for an OBN approach to build a more accurate high-resolution velocity model came from various directions: High-velocity injectites and re-mobilised sediments in the shallow section, a carbonate sequence with high velocities covering the targeted lower velocity mudstone and sandstone units, and extensively faulted Jurassic blocks. This challenge became even more significant because the targets typically occur at depths beyond the reach of diving waves for FWI when using streamer-based data with maximum offset of 8 km.
The improved velocity model that came with the OBN hybrid survey around Fram as shown in Figure 4 subsequently drove the call to acquire a hybrid sparse ocean bottom node survey in 2022, covering much larger areas than in the previous year. The areas around Oseberg were shortlisted first, driven by a need to better image deep targets. A total of 1,850 km2 was acquired.
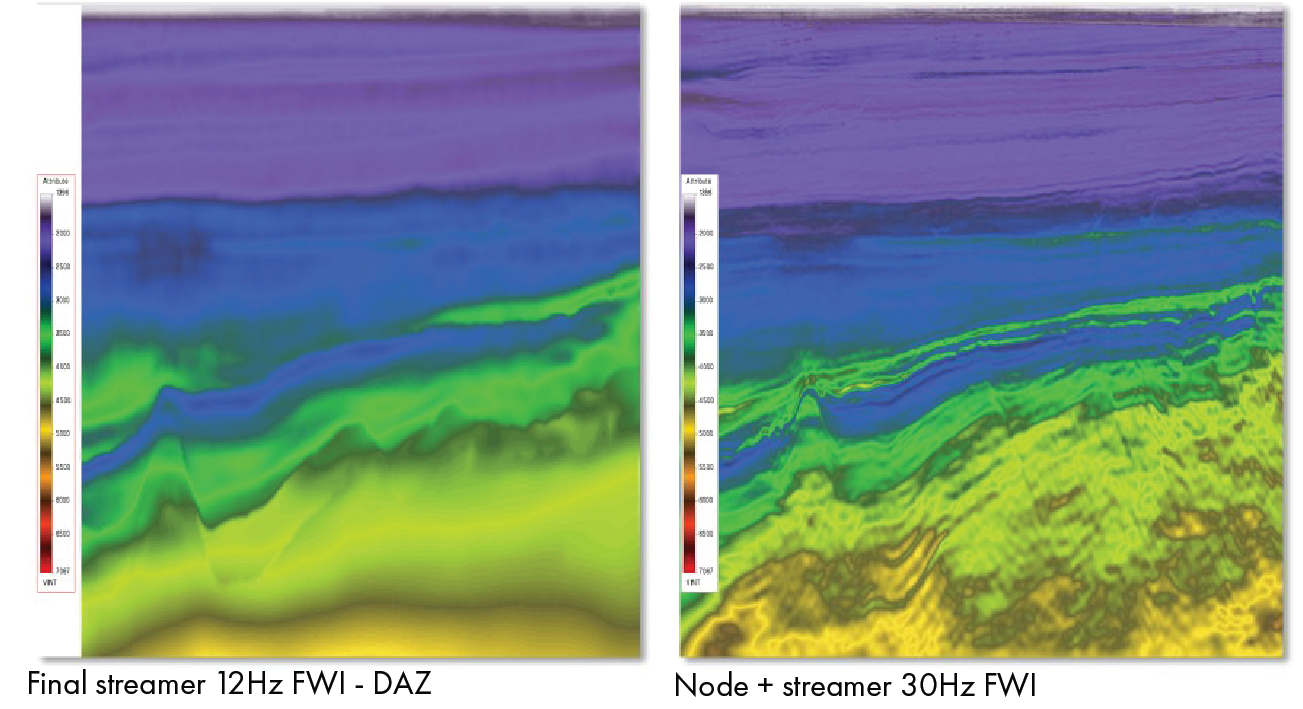
The node data provide the ultra-long offsets required to obtain a reliable low-wavenumber velocity update down to the Brent level and to capture the sharp impedance contrast and the velocity inversion below the BCU where the reservoirs are sitting. In addition, with long recorded offsets, the expected elastic effects induced by the large impedance contrast at this level can be observed and inverted for using elastic FWI, which results in a reliable long to mid wavelength update down to about 5 km and 12 km depth respectively for Fram and Oseberg surveys. This update subsequently unlocks the use of full wavefield FWI at the sub-BCU level.
In turn, the years 2023 and 2024 brought additional acquisition and re-imaging activity, with more OBN data derived from the areas around the Heimdal and Sleipner fields in cooperation with partner TGS, as well as re-imaging of the Utsira OBN with partners TGS and Aquila. In addition, a further east-west streamer survey was acquired covering the southern part of quadrants 6201 – 6204 to the north of the existing coverage.
What’s next?
All in all, within a timespan of 10 years, Viridien acquired over 53,700 km2 of contiguous 3D data, produced 25,500 km2 of Dual Azimuth data, and acquired or re-imaged around 3,700 km2 of dense OBN coverage. On the back of all this activity, a mix of operators, led by Equinor, made a total of 28 discoveries, clearly proving that the Norwegian Northern North Sea has been the exploration hotspot on the NCS for years.
And the story of the Northern North Sea is not over, as seen with the most recent Rhombi discovery.
“With a number of activity hotspots in the Northern North Sea, we see companies expanding out into less explored areas as shown by new licenses awarded in the 2024 acquisition area,” says Jaswinder Mann-Kalil, Director of Viridien’s Scandinavia Earth Data group.
“Therefore, Viridien will continue to invest in advancing seismic acquisition and re-imaging technology in the years to come”, says Erling Frantzen, SVP Earth Data EAME. “The many recent discoveries will need to be appraised and developed, combined with a desire to unlock additional resources. This provides the basis for even more and better data.”
“The benefits of dense OBN in combination with our advanced imaging techniques will ensure optimal location of development wells for an efficient drainage strategy of the relatively small structures as well as adding new and often subtle targets for additional resources”, Erling adds. “And these surveys can also be the baseline for subsequent 4D data as well. The story is not over for sure!”