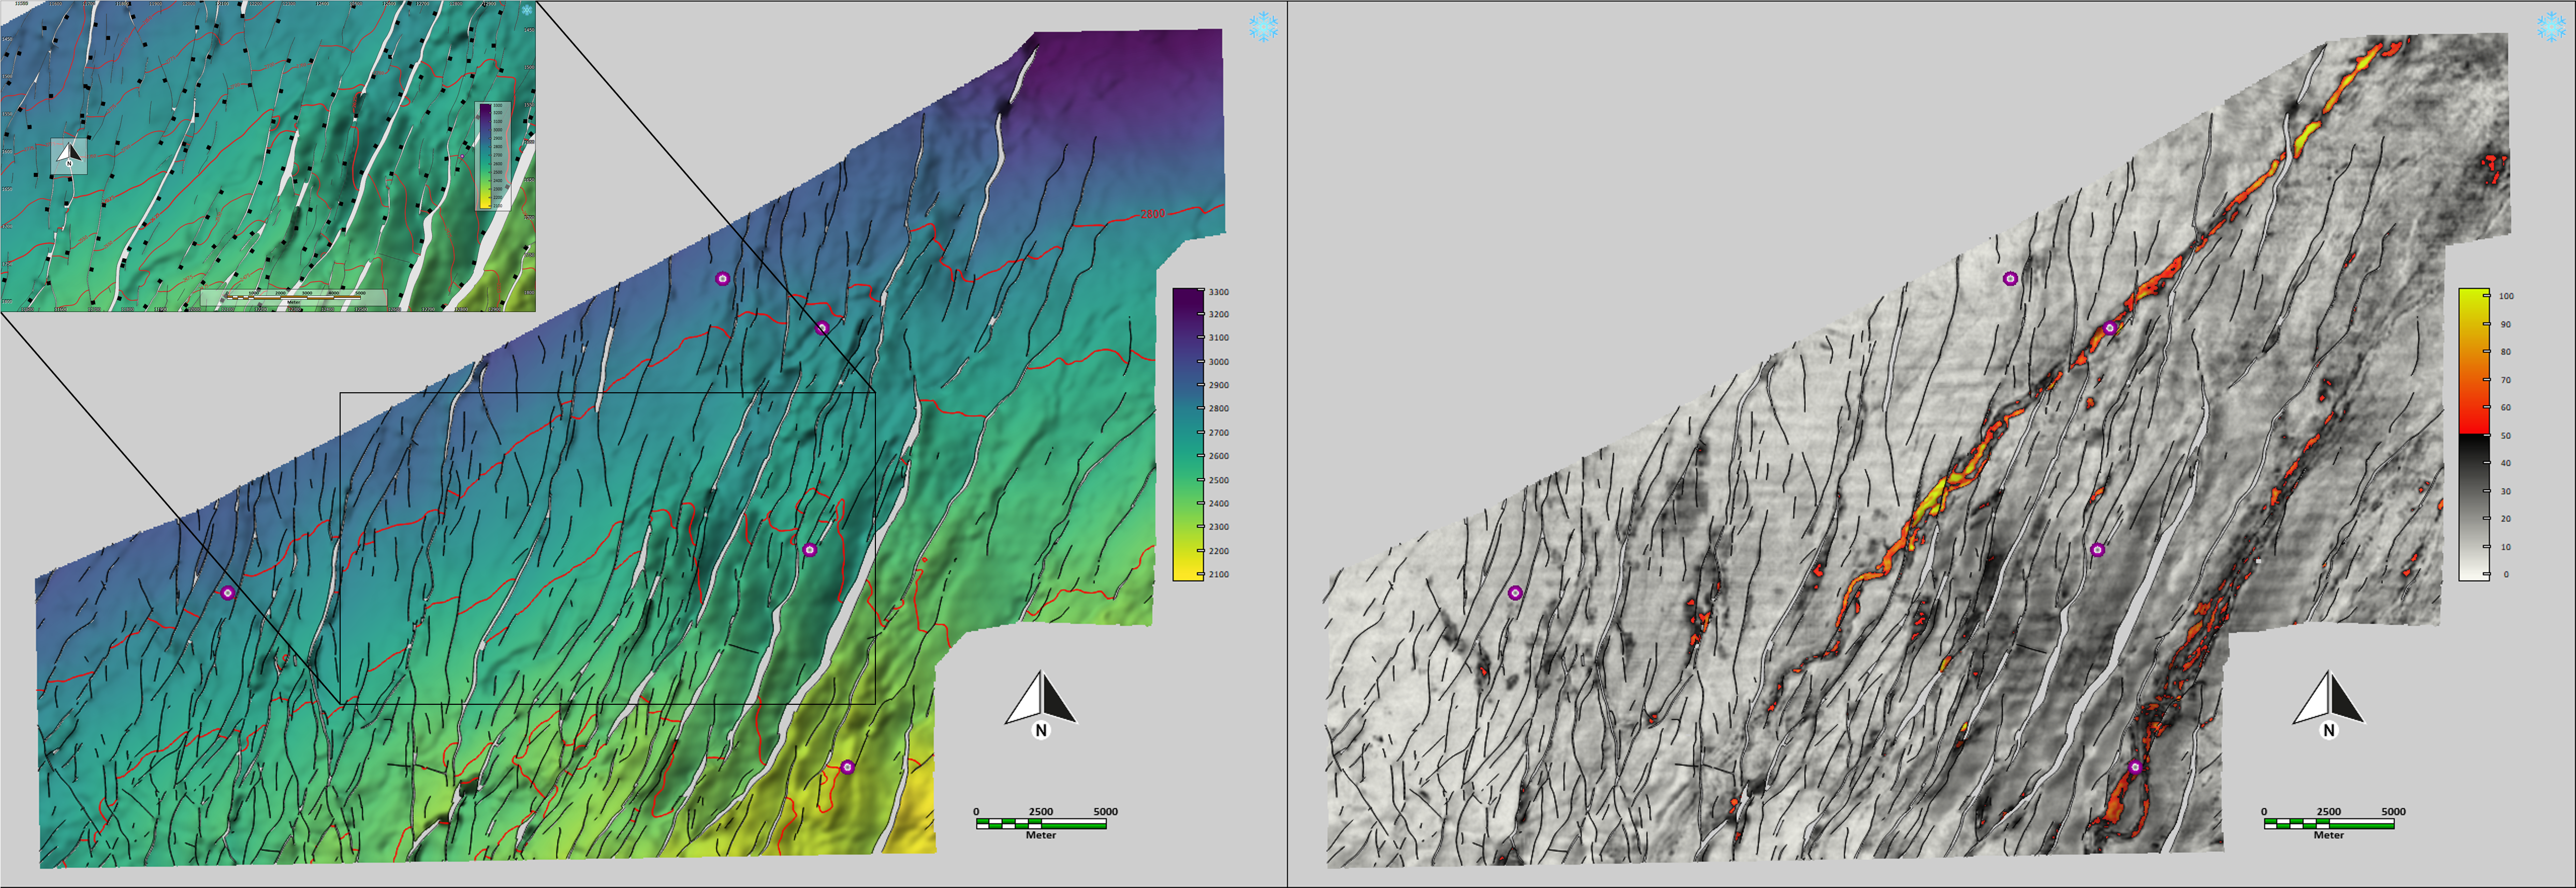
Figure 1: Mosaic of PaleoScanTM Fault Plane attribute, AI FaultAssist and RGT Gradient volumes on the Exmouth Seismic cube, and subsequent extracted fault network.
Integration of structural and stratigraphic data using automated workflows
An example from the Exmouth Sub-Basin, offshore Western Australia
Geoscientists rely on their pattern recognition ability every day, comparing already known sedimentary and structural fabrics with new ones when diving into new datasets. However, with the increase in size and availability of seismic surveys, it also becomes more important for interpreters to rely more on automated tools and artificial intelligence to ease the burden and shorten E&P workflows. Here, we discuss how new AI fault extraction algorithms, sophisticated automatic facies classification techniques and a new simplified workflow to create watertight zero-offset horizons can be integrated into an advanced seismic interpretation workflow.
Exmouth sub-basin
A case study was conducted in the Exmouth sub-basin, part of the Carnarvon Basin, which is situated 20 km offshore Western Australia. We used the Exmouth seismic block complemented by artificial well trajectories and empirically picked well tops for the purpose of the demonstration of our method. The seismic survey comprises a dense and complex fault network resulting from an extensional phase lasting from the latest Triassic to the Early Cretaceous. Hundreds of faults are visible in the seismic volume, striking mostly North-Northeast and extending over Triassic, Jurassic, and Lower Cretaceous intervals. The Upper Jurassic play of the Exmouth sub-basin includes two separate turbidite systems marked by erosive channels. These turbidite systems contain reservoir-grade sandstones and may be prospective in structural or stratigraphic traps.
AI FaultAssist
The ‘AI FaultAssist’ algorithm relies on a 3D deep learning neural network designed to detect fault probability. The model was trained on very large synthetic and labeled datasets representative of a diverse mix of geological settings. The synthetic training data incorporates seismic volumes of different frequencies, signal-to-noise ratios, and distinct fault types (normal, reverse, and transform) with distinct fault characteristics.
AI-driven fault extraction
The new AI-powered algorithm was applied to accurately and swiftly characterize the entirety of the North-Northeast striking faults of the Triassic, Jurassic, and Lower Cretaceous intervals to create an AI fault probability volume. The created AI fault probability volume accurately captures the faults visible in the seismic volume and, in comparison, matches with the fault signal derived by a standard vector field algorithm (Figure 1).
The resulting fault probability volume is displayed in binary values, with 1 representing the highest fault probability. To extract faults, this volume is then smoothed with a Gaussian function to retain only the maximum pixel value along the steepest gradient direction within a specific window size in time-slice. This latest step allows the production of a ‘skeleton’ made of only the fault probability extrema. The faults are finally extracted and filtered in the dip-azimuth filter to obtain the final QC’d fault set. This final fault set can then be used to constrain the subsequent stratigraphic interpretation and geo-modeling processes and can be integrated with key horizons to facilitate structural interpretation at the reservoir level.
Honouring well-tops and fault network
Now, we continue the workflow that will ultimately produce a clean fault-horizon intersection network while also respecting stratigraphic well tops. We rely on a dynamic horizon edition toolset to adjust the horizon’s lateral resolution, apply zero-offset fits between the horizon and well tops, and accurately align the horizon with the 3D faults to make it watertight. The workflow ideally derives data from chrono-stratigraphic stratal slices extracted from the Relative Geological Time (RGT) model.
In the first step of this workflow, the RGT model is used as input to extract the closest surface to a specified set of well tops via minimization methods, offering the smallest vertical mistie between a well top series and a value of the model. In the case of this study, we extract the nearest surface from the ‘Top Reservoir’ top from our RGT model, corresponding to the stratigraphic level containing the Upper Jurassic turbiditic system.
As a second step, the lateral resolution of the horizon is homogenized to 50 meters in the In-line and X-line directions since the Exmouth sub-basin survey resolution is laterally anisotropic.
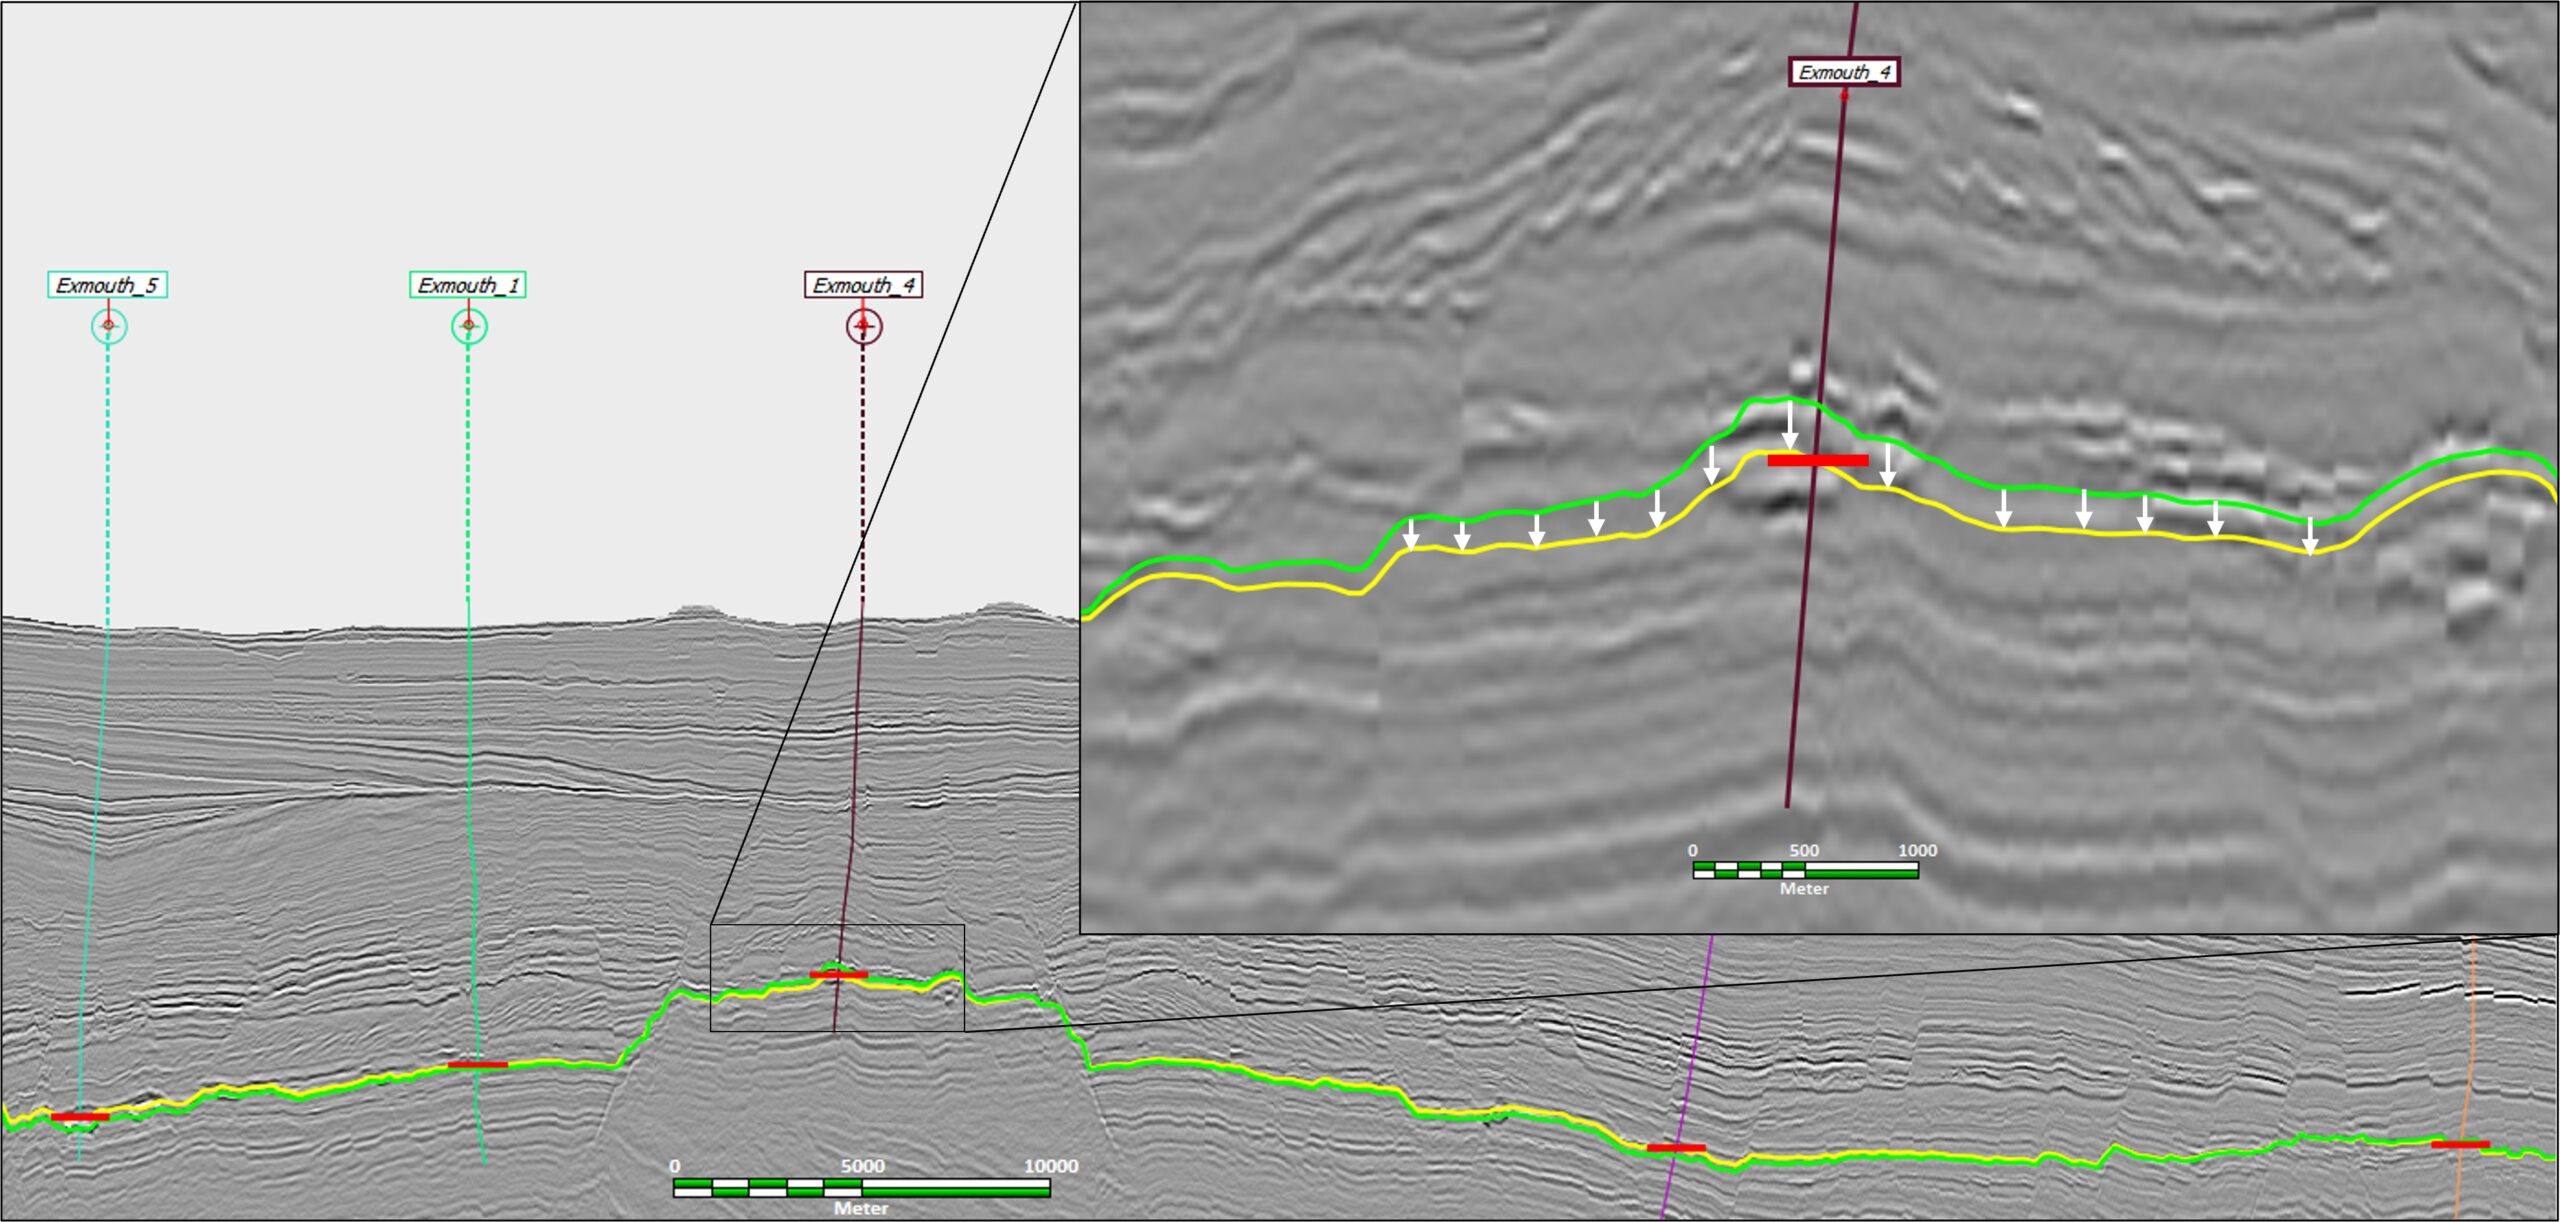
The third step involves fitting the horizon to the ‘Top Reservoir’ top: zero-offset horizon flexing is conducted by calculating the vertical offset between the horizon and the tops at well locations and then interpolating the values using the inverse distance method. The fit of the horizon with the well tops can either be local if a radius distance is specified for the interpolation, or global and interpolated over the whole survey. In this example, a global fit is preferred. Once the values are interpolated, horizon flexing can be initiated to eliminate the interpolated mistie by vertically shifting the horizon (Figure 2).
The final step of this workflow consists of fitting the flexed horizon with the available 3D faults extracted from the AI FaultAssist algorithm. The horizon is accurately fitted with the edges of the 3D faults of the Exmouth sub-basin survey. The alignment is achieved by vectorizing the horizon and creating triangulated surfaces adjacent to the faults to allow the horizon to fit the faults perfectly.
When supported with relevant attribute mappings, this approach provides a more robust interpretation, facilitating subsequent decision-making
(Figure 3 ).
NOT LIMITED TO AMPLITUDE ONLY
We use the Kohonen self-organized map unsupervised automatic classification technique. The originality of our approach is that it is not limited to the amplitude of the trace to perform the classification but can also exploit its phase, frequency, sweetness, or envelope.
In this case study, the filter was retained on a vertical size of 7 samples, centered on the horizon, to extract 4 classes that are relevant to the intended geological target. In addition, the extent of the classification is limited to a restricted AOI to enhance the relevance of the discretization of the classes, thus revealing facies distribution and heterogeneity more precisely. A post-classification Gaussian smoothing is finally applied to enhance map quality.
Waveform classification
Waveform Classification is an automatic pattern recognition technique applied to seismic data to group similar traces together in distinct classes. If the seismic signature or processing quality is good, the classification can be efficiently used to reveal variations in lithology, fluid content, or reservoir limits.
Figure 4 displays a comparison of mapping the target channel using a simple seismic amplitude and a waveform classification. The comparison shows that the signature of the channel is revealed with more detail when applying waveform classification: Many heterogeneities are distinguished in the channel and could be interpreted as different facies of the channel, and/or subsequent sequences of deposition of a turbidite system.
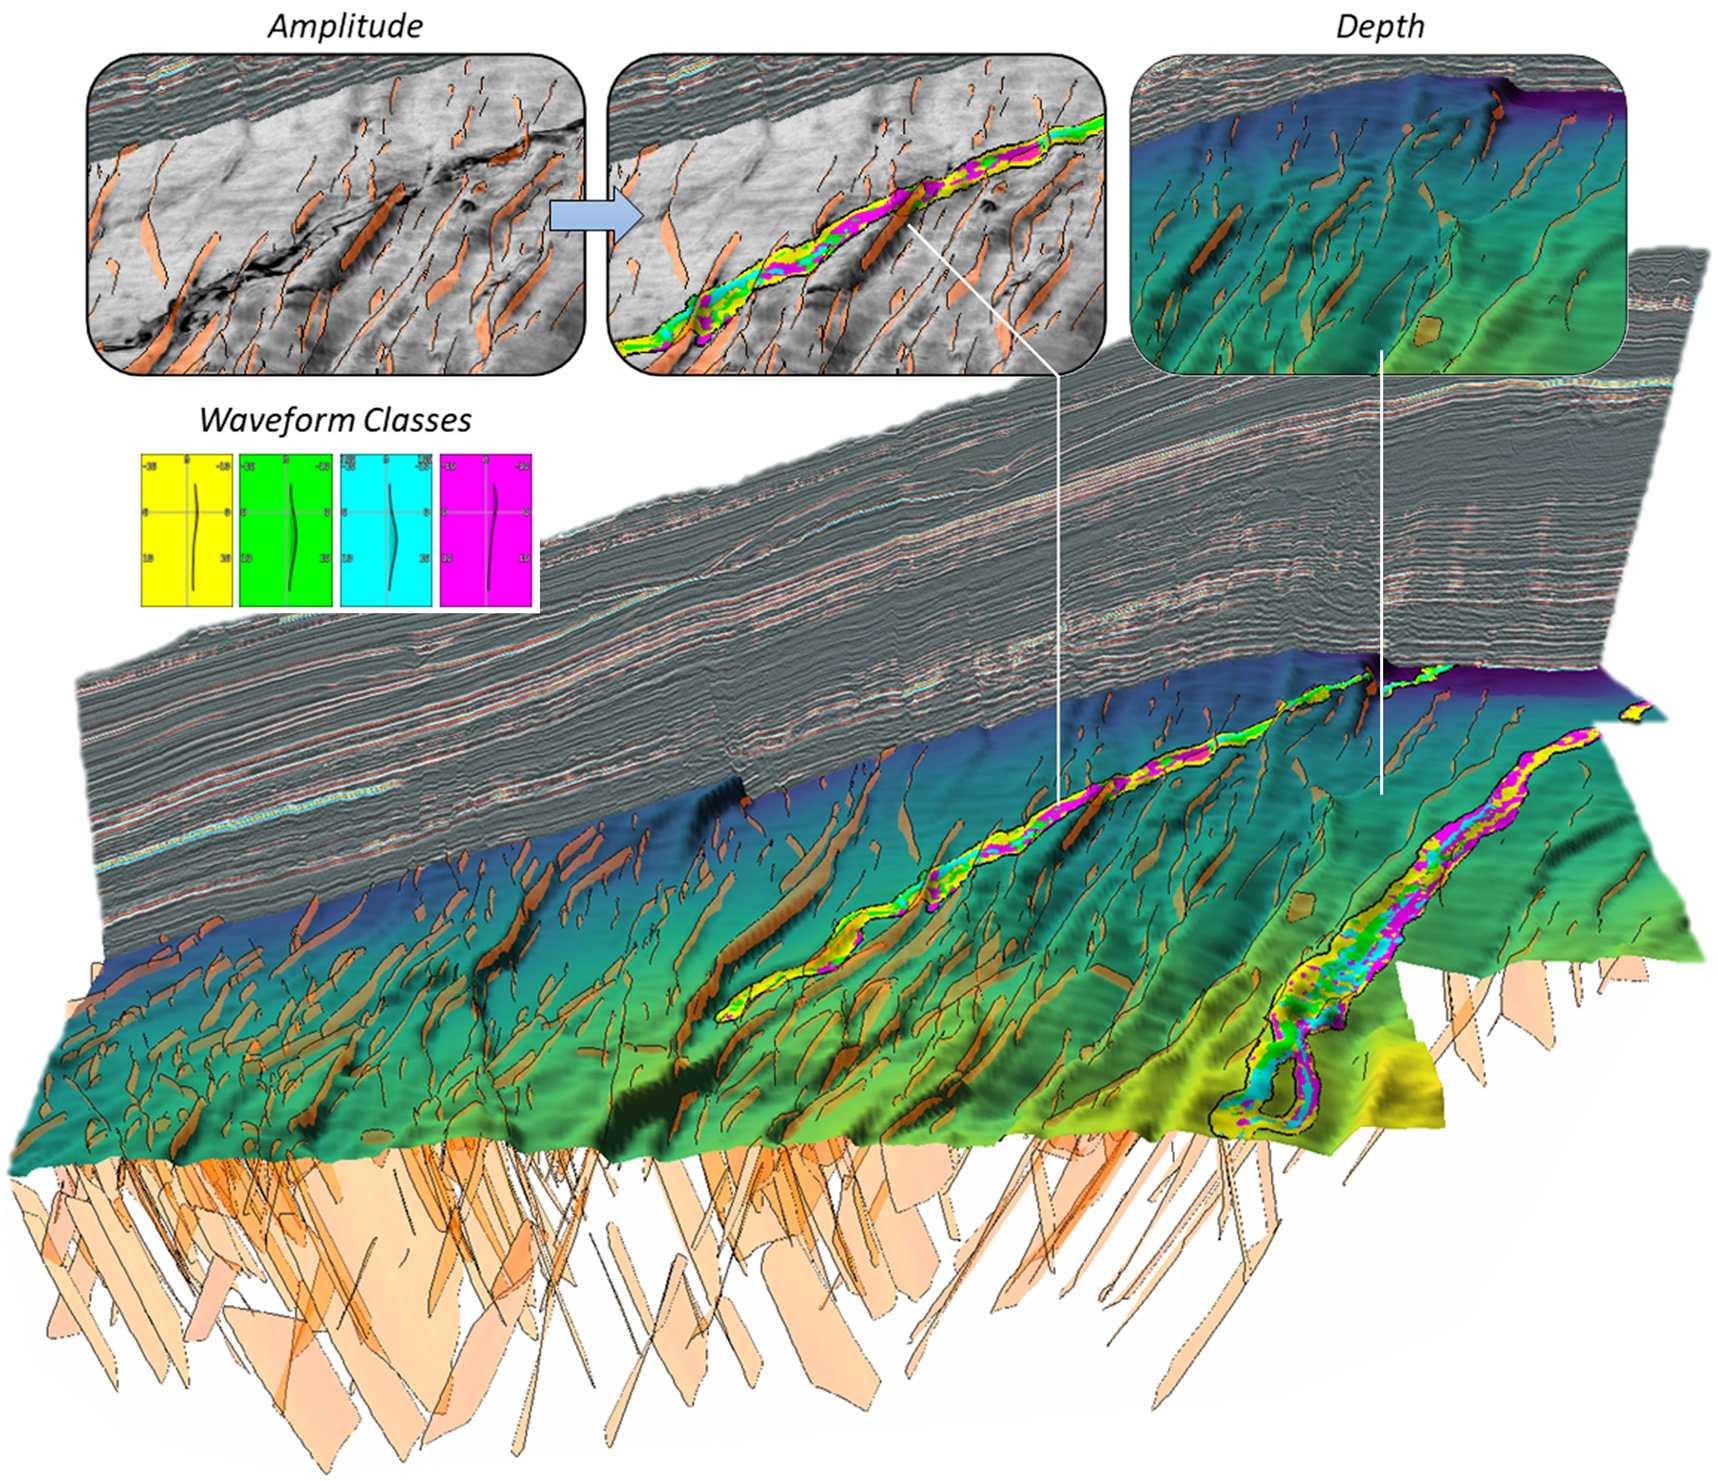
In our example, since the two channels are classified in one operation, we can correlate facies characteristics of the same class between the two channels: If for instance a well crosses the green class in one of the two turbidite systems and strikes a hydrocarbon reservoir with a certain fluid saturation and granulometry, similar properties could be inferred in the green class zone in the other channel.
An advanced interpretation workflow based on automation
The presented study showcases the immense benefits of integrating automated tools into advanced interpretation workflows to optimize results while shortening E&P workflows. The AI FaultAssist algorithm provides a reliable fault extraction method that reduces the time needed for structural interpretation while yielding consistent results. Using an original dynamic edition toolset, horizons can be fitted to well tops eliminating their vertical offset. This toolset uses extracted faults by the AI FaultAssist to create vectorized watertight horizons on the fly. These watertight horizons facilitate decision-making by combining structural and attribute data.
To complement these results, using the automated waveform classification, allows us to go a step further towards reservoir characterization. Finally, these tools and the presented advanced workflow serve as an example of numerous other workflows relying on automation.
Acknowledgment
The authors would like to thank Geoscience Australia for their permission to use the Exmouth seismic data of block HCA2000A.