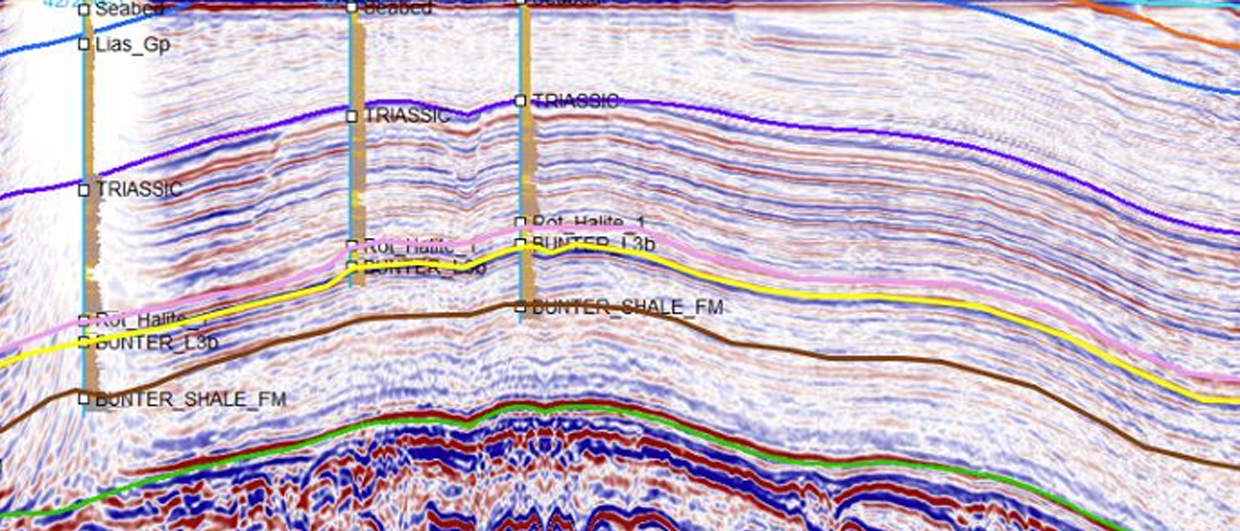
Seismic line across the Endurance closure, showing the three wells that were drilled on the structure. From left to right: 42/25d-3, 42/25-1 and 42/21-1. The top and base of the Bunter reservoir are indicated by the yellow and brown horizons respectively. Source: Endurance Storage Development Plan
Another pressure plot without values
At last week’s Devex Conference, another operator confirmed once again the sensitivities around pressures in a future carbon store – this time for the planned Endurance project
It is the third time in a matter of a few months that a pressure plot was shown during a carbon storage presentation without values on the vertical axis – it is becoming a bit of a trend and it shows the sensitivities around pressure build-up in saline aquifer stores.
This time, it was a talk delivered by Nicolas Bouffin from bp at the Devex Conference in Aberdeen. He presented about the Endurance project in the UK Southern North Sea, which is being prepared for CO2 storage by a consortium of companies including Equinor, bp and Totalenergies.
The first time I saw a plot of this kind was at the CCS4G event in December last year in London, when Michael Larsen spoke about the Nini West CO2 injection test in the Danish offshore. However, he provided the numbers once asked during the Q&A. The second time was during the recent Dig X Conference in Oslo in March when Eirik Jenssen talked about the Northern Lights project in Norwegian waters. Even when asked in person after the talk Eirik admitted that he could not share any numbers.
During his talk last week, when Nicolas arrived at the slide that included the pressure plot, he apologized for the absence of the values to the audience, but I asked him after the presentation. In this case, he said that pressure values could be found in the online-available Endurance Storage Development Plan. That then begs the question as to why it was not possible to show pressure values on his slide.
What the report says
The thing that Nicolas could share with me though is that no pressure issues are foreseen during the first phase of the project, which aims at injecting 100 million tonnes of CO2 during 25 years into the Triassic Bunter reservoir.
When checking the Endurance Storage Development Plan, it is stated that the Röt Clay, which is the sealing unit directly overlying the Bunter reservoir, returned 264 bar (3,830 psi) as a fracture pressure when analysed through an MDT mini-frac test at 1,363 m in well 42/25d-3. MDT and RFT testing of the reservoir itself suggested that the aquifer is at 140 bars at around the same depth as where the Röt Clay was analysed, leaving a 124 bar pressure window.
The document does state that for subsequent development phases, where CO2 injection exceeds 4 million tonnes per year, brine production may be required to maintain reservoir pressure below cap rock fracture pressure limits. The exact moment when this would be required depends on the connectivity of the system or the potential on (unlikely) structure baffling.
It is the connectivity of the Bunter reservoir that will indeed be the critical factor when it comes to how efficiently a pressure front will be able to dissipate. And there seem to be two endmember models.
Two end-members
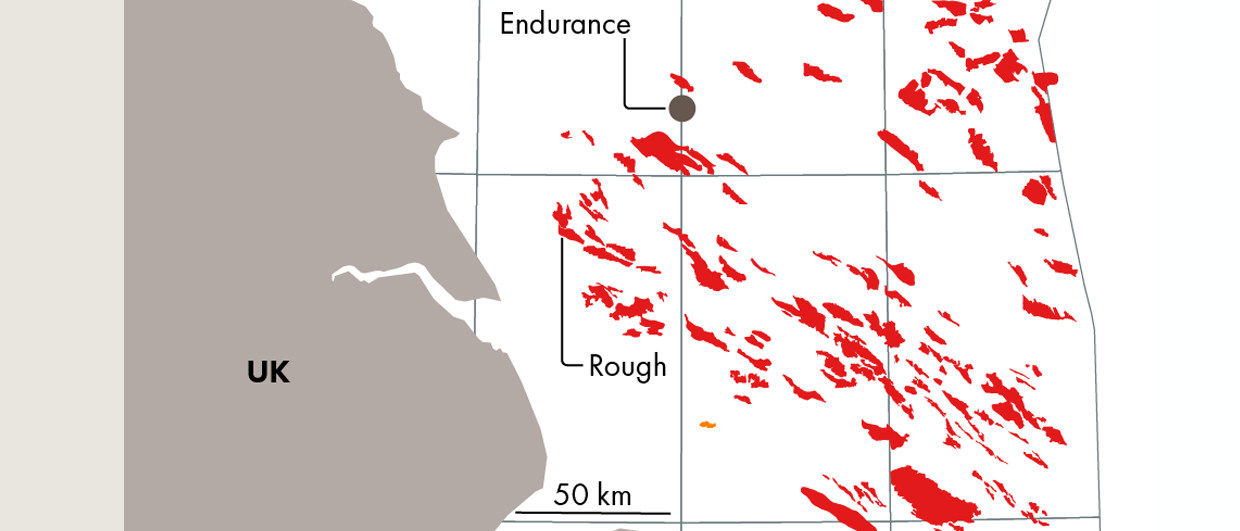
The first and more positive endmember is one of a large connected aquifer than even communicates with the abandoned Esmond gas field – which produced from the Bunter too – 50 km away. The drop in pressure (10 psi) that was observed in the Endurance appraisal well (42/25d-3) compared to well 42/25-1 drilled 23 years earlier has been explained by pressure depletion in the Esmond field, suggesting a large connected aquifer.
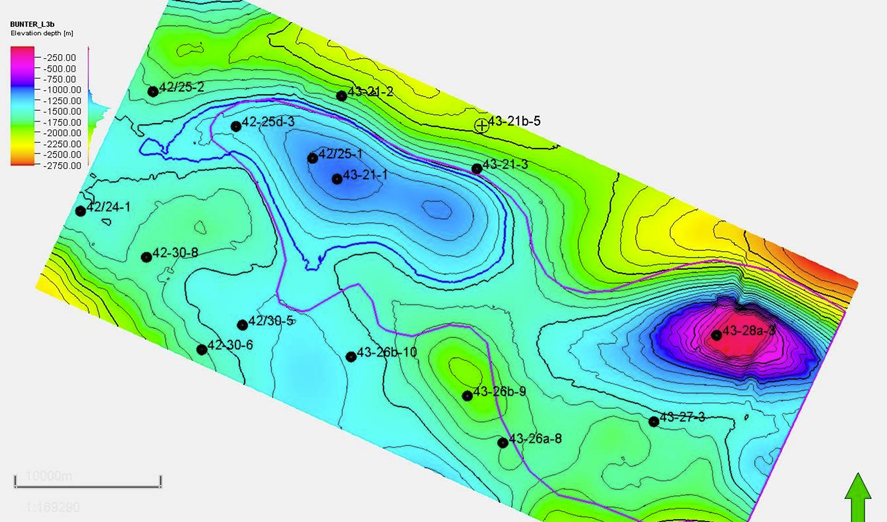
The second and more pessimistic endmember is one of a much less connected Bunter reservoir, which obviously will have a detrimental effect on the storage capacity. The main observation in support of this is the fact that halite cementation is a frequently observed phenomenon in the Bunter. The wells that were drilled around the Endurance closure – all targeting deeper Rotliegend strata – indeed suggest that the Bunter is much more clogged up than in the wells drilled in the Endurance closure itself, with lower porosities. This is further supported by the presence of a seismic polarity reversal that was mapped at the top of the Bunter that broadly lines up with the closure and is explained by the presence of porous Bunter sitting on its cemented equivalent (see purple line in map above).
And what about the pressure change observed in the two wells on the structure? The Endurance Storage Development Plan suggests that a difference in brine salinity can explain this too. In that case, a connection between Endurance and Esmond is not so certain yet.
In other words, it is probably the uncertainty in connected reservoir volumes and the different scenarios with which one can explain observations that create the environment for pressure to be such a sensitive factor.