Vintage Maps Reborn
Using 3D animation software and surface models for new hillshade mapping techniques to produce hyper-realistic 3D-like maps.
A new trend of map-making has recently evolved and changed the way we look at traditional topographic maps. With the advent of 3D modelling and access to detailed surface model data covering the entire globe, shaded relief maps generated from 3D animation software such as Blender have given cartographers the ability to create 2D maps with a hyper-realistic 3D appearance. These eye-catching maps are not only aesthetically pleasing and hard not to stare at, but they also provide us with the ability to visualise terrain details that can be difficult to interpret with traditional mapping methods such as contouring (Figure 1).

Figure 1: Topographic Map of The World (around 1961). © Visual Geomatics Wall Maps.
Mapping Re-Visioned
Although hillshading using 3D animation software is quite a new technique, shaded relief displayed on maps has been around nearly as long as map-making. Cartographers from centuries past shaded-in shadows by hand to display relief on maps; a skill that required great artistic sketching abilities. In more recent years where map-making has turned digital, common GIS software has been able to generate hillshaded maps that cannot be discounted in their effectiveness for topographic relief visualisation. The advantage that 3D animation software provides over these traditional techniques is a combination of an advanced hillshading algorithm and having much more control in the artificial light source(s) casting the shadows on the terrain model. Traditional hillshading algorithms used within GIS software only account for light in one constant direction whereas the 3D animation software takes a more realistic approach by accounting for how the light bounces and reflects off objects such as mountains and river valleys within the surface model. This approach results in a much more realistic shading that shows clear differences and advantages (Figure 2).
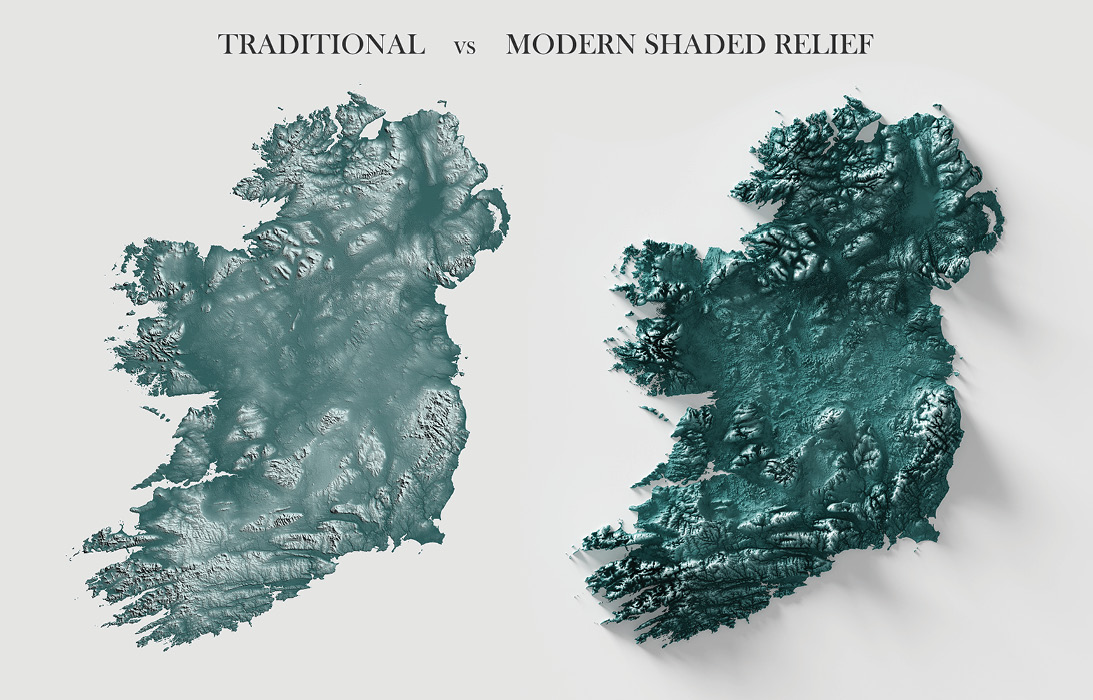
Figure 2: Comparison of Traditional vs Modern Hillshading – Ireland. © Visual Geomatics Wall Maps.
A Work of Art
Surprisingly, the most popular use of this hillshading technique to date has not been driven by the scientific community for topographic interpretations, but rather for new age artwork that can be hung on the wall of a home or office.
Shaded relief maps also have the advantage of rendering 2D maps created in the past. Maps created by early cartographers from as far back as the 18th century can easily be reborn into eye-catching wall maps when shaded relief is added (Figure 3). With archival access to a massive database of scanned historical maps, new age cartographers are creating a wide variety of vintage shaded relief maps covering all corners of the globe. One does not need to search too far within social media platforms such as Reddit, Instagram and Twitter to find impressive works of art (try #shadedrelief).
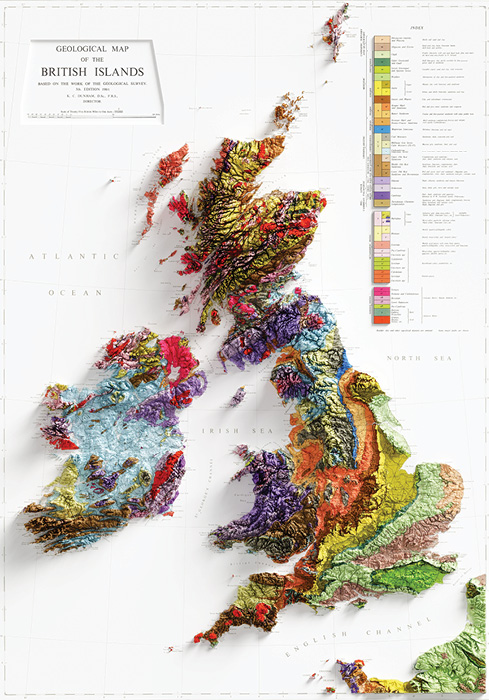
Figure 3: Geological Map of Ireland and the British Isles (around 1969). Figure 2: Comparison of Traditional vs Modern Hillshading – Ireland. © Visual Geomatics Wall Maps © Visual Geomatics Wall Maps.
Relief maps vary from a broad range of mapping themes. Maps displaying surficial geology, or physical maps showing landscapes are common for undergoing the 3D render makeover. But simple shaded relief maps that show nothing more than a colour ramp or simple tint on top of the surface model can still produce an impressive image to look at. Figure 4 displays a surface model generated from LiDAR data obtained from the United States Geological Survey’s (USGS’s) 3DEP database. The surface model was clipped to the mountain’s lowest contour and a simple green colour ramp that lightens at higher elevations was compiled into a shaded relief render that brings out an incredible amount of detail. Notice that even the crevasses of Mount Rainier’s 25 glaciers are visible on the shaded relief.
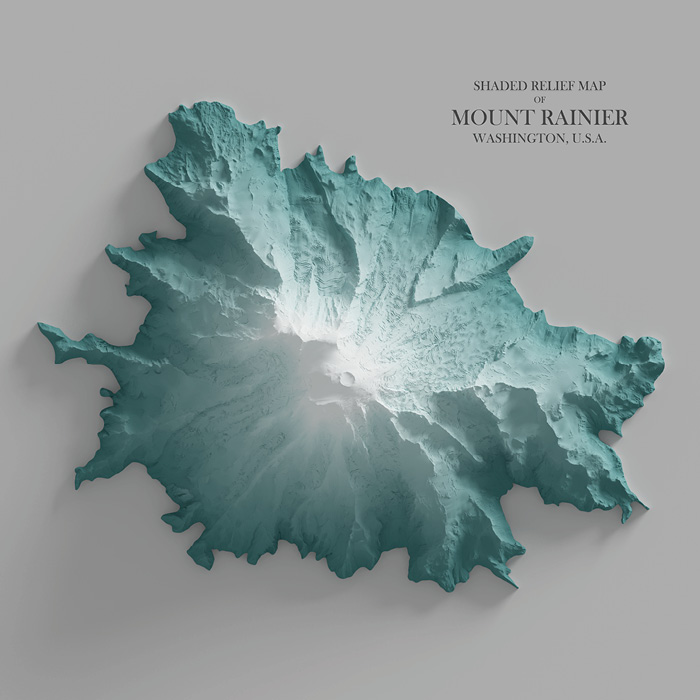
Figure 4: Simple Shaded Relief of Mount Rainier, Washington, USA. © Visual Geomatics Wall Maps.
The Process
Compiling shaded relief maps starts by preparing two key components: the cleaned vintage map, and the surface model data otherwise known as a Digital Elevation Model (DEM). Although shaded relief maps can be created straight from a surface model alone as mentioned, the process of rendering from a vintage map starts by taking the high-resolution digital scan of the map and using GIS software to align or georeference the map to its correct geographic location. Properly georeferencing a vintage map can be one of the more time-consuming tasks in the process; capturing hundreds of control points to tie the map to the surface. One can imagine maps that were created before the advent of GPS can tend to have a reasonable amount of spatial distortion where the map does not align perfectly to the spatially corrected surface model data.
Surface model data covering the map extent is extracted from a source such as NASA Shuttle Radar Topography Mission (SRTM), General Bathymetric Chart of the Oceans (GEBCO) or even Light Detection and Ranging (LiDAR) when available. The higher resolution the surface model the more realistic the render results will be.
Typically, a boundary of the map’s content such as a country border or island shoreline is then used to clip or extract the surface model data. This surface model data is the key component in rendering the hillshading within the 3D animation software.
This of course is oversimplifying a process that requires a moderate level of GIS expertise to perform. Most data preparations will involve manipulating multiple surface models, reprojecting data into various geographic projections and rectifying hand-drawn maps that can skew in spatial accuracies.
Once the vintage map and surface model have been cleaned and aligned it is time to reference them into the 3D animation software. Within the 3D animation software, a flat planar object is added to an empty scene. The object has a multitude of settings to configure for adjusting the material properties and behaviour of the object. Characteristics such as roughness, sheen and emission strength can be adjusted to change the appearance of the object. Ultimately the planar object references the surface model to displace or protrude it from a flat surface. A vertical exaggeration can be adjusted to increase or decrease how much displacement is applied to the surface model. Too much exaggeration and suddenly a shallow river valley can look like the Grand Canyon. Not enough vertical exaggeration and the relief map will simply look like a traditional hill-shade map without the visual appeal.
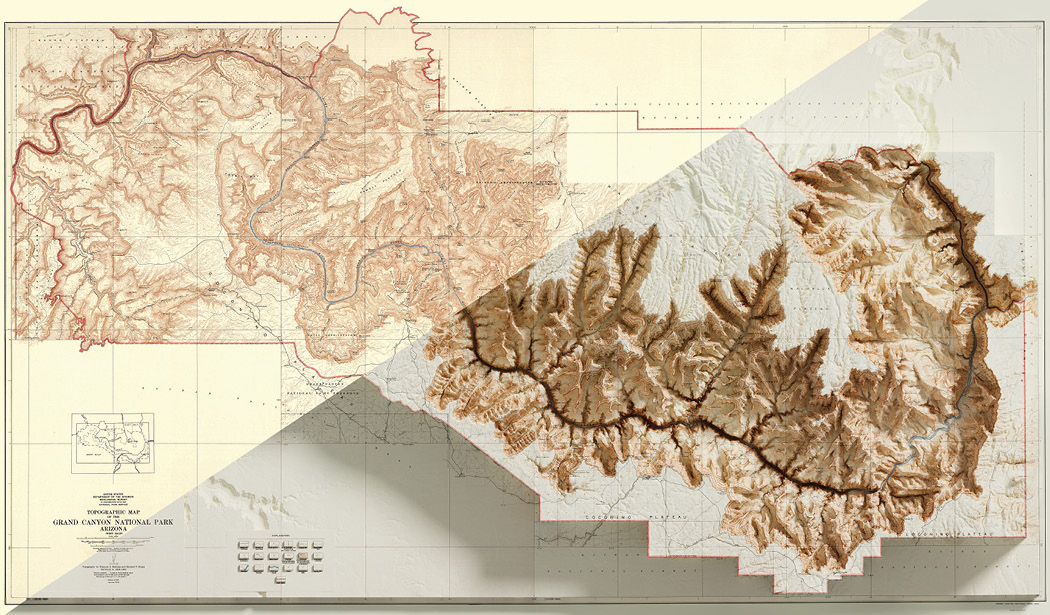
Figure 5: Before and After rendering – Grand Canyon National Park. © Visual Geomatics Wall Maps.
The original 2D map is referenced as the material texture of the object and when combined with the surface model’s displacement a 3D object is created within the Scene. Then, a light source (or sources) is added to simulate the sun casting light on the surface from an oblique angle. It is critical to properly adjust the sun’s azimuth and altitude to be in an optimal position that highlights the dominant features within the surface model. The strength of the sun can also be adjusted to either darken or soften shadows based on preference.
Lastly, is the placement of the camera. The Scene has been configured with an object and now the last step is to take a picture of it. Since maps are top view orthographic projections, the camera is placed into position directly above the centre of the object and oriented straight down.
Once all the settings are configured, the rendering can take place. As one would expect with 3D animation software, rendering is quite resource intensive and is best performed with a well-equipped processing computer that has plenty of RAM and GPU. Renders can take hours and sometimes even days, depending on the complexity of the surface or if additional objects are added (Figures 5 and 6). The long render time is also the main reason why this technique has not displaced traditional GIS hillshade maps where a map is generated within seconds.

Figure 6: Before and After rendering – Iceland. © Visual Geomatics Wall Maps.
Though with the growing popularity of this shaded relief technique, it is not unrealistic to assume that it is only a matter of time before popular GIS software has this capability as well.
The End Result
Once the render has finalised, the result is a hyper-realistic image that tricks most observers into thinking it is actually 3D at first glance. When the maps are printed on fine art paper and placed behind glass it can be deceiving, when they are actually 2D.
Since these are generated with 3D animation software, we can also take advantage of incorporating 3D animation objects such as realistic clouds.
One drawback to shaded relief maps is that in some areas of the map where elevation change is abrupt, the darker shadows cast can inadvertently render overlapping labels as illegible. Hence the popularity for these maps as wall art as opposed to maps that serve a technical, geographical purpose.
In the near future do not be surprised to see these maps as actual 3D printed models. The data already exists as 3D files and as soon as 3D printing technology can translate the map details on top of the physically printed model, you will start to see raised relief hanging on walls.