Discovery Energy Use an AI-based Digital Twin to Execute their Latest Drilling and Development Strategy
Operators are turning towards Artificial Intelligence (AI) to better understand geological systems, improve safety, and maximise investment and return in oil and gas exploration.
In the fight to understand geological systems, improve safety, and maximise investment and return, operators are turning towards Artificial Intelligence (AI). Identified as the solution to many topside maintenance challenges, AI is now having a significant impact on the subsurface.
AI presents a huge opportunity to improve seismic interpretation. It has the power to improve the quality and understanding of subsurface data; analysing vast amounts of data in a relatively short amount of time, removing tedious and repetitive tasks, freeing humans to handle more complex jobs whilst presenting results with a greater degree of accuracy.
Although AI presents an opportunity to improve seismic interpretation, conventional AI system decisions are often derived from a ‘black box’ requiring the user to trust the outcome. Consequently, the adoption of AI in more complex and subjective tasks, like seismic interpretation, has been slower than for some topside operations.
The challenge for AI is to show a greater transparency and auditability, to gain confidence and to integrate into decision making workflows. This study illustrates the results of one of those scenarios, AI fault interpretation in combination with other data driven depositional system analysis. The strength of this approach is that the technology is advanced in such a way that results are easily integrated into the traditional workflow for quality control. Results were evaluated in real-time, allowing users to experiment and iterate freely and analysed directly in combination with traditional lines of geophysical imagery such as spectral decomposition colour blending to correlate findings.
Problem – Field History
With over 50 years of production history, the Cooper-Eromanga Basin is Australia’s most mature hydrocarbon basin. Throughout the exploration, appraisal, and development campaigns, 175 gas fields and 131 oil fields have been discovered and brought online since 1963.
The Late Carboniferous to Triassic Cooper Basin is overlain by the fluvio-lacustrine and marginal marine sediments of the Early Jurassic – Late Cretaceous Eromanga Basin. The two main challenges in this basin are the faults and the understanding of the fluvial systems in the Hutton and Namur Sandstones and the Birkhead Formation which provides the sealing unit. Fault structure plays a fundamental part in this petroleum system; faults and sub-crops are the main migration pathways used to charge the reservoirs but also to compromise the seal. Being able to map all the faults (their full vertical and lateral extent) and to understand their nature is critical.
With up to 70% of the oil in the Cooper-Eromanga Basin believed to be trapped within the Eromanga Basin, in 2016 Discovery Energy commissioned the Nike 3D survey (180km²) in the Western Eromanga Basin to define the production trend, and to evaluate and develop the drilling prospects identified from 2D seismic.
Data Conditioning
Geoteric’s latest AI technology – Geoteric Stratum™ for fault detection was applied. Although the seismic within this study was of good quality, Geoteric’s data conditioning workflow was applied to improve the signal-to-noise ratio, to increase the vertical resolution and thus decrease the number of false positives to enable the AI to detect smaller-scale faults.
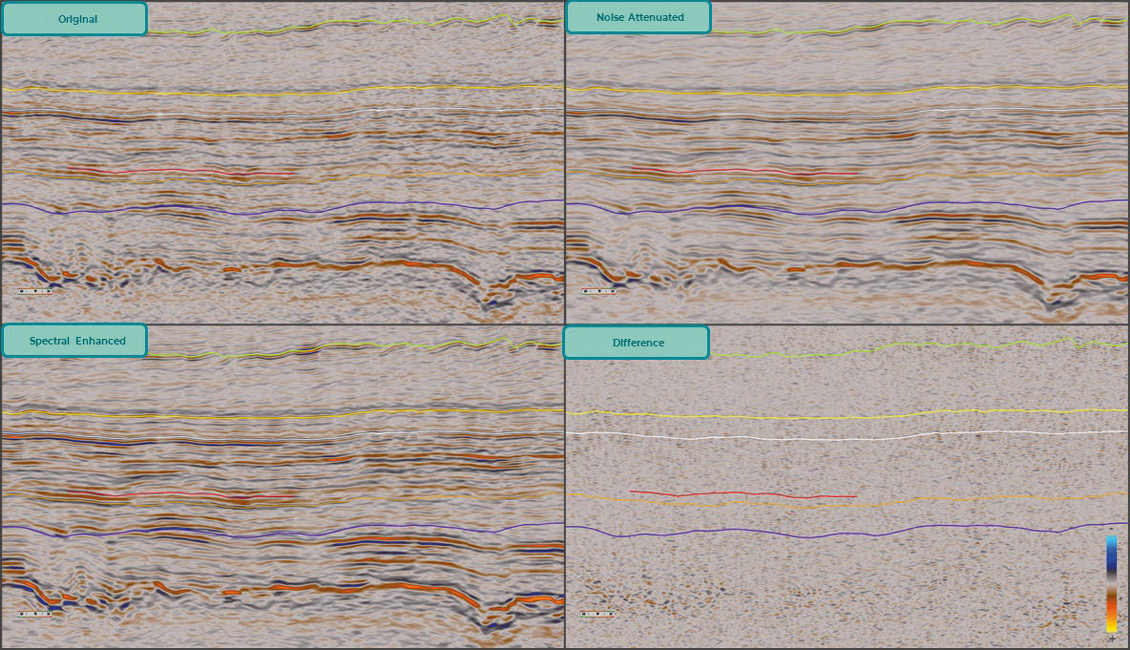
Figure 1 – Composite image showing original, noise attenuated, spectral enhancement results and the difference (original- noise attenuated).
Stratigraphic Workflow
Frequency decomposition and colour blending is a well-established technique to image channels (fluvial or turbiditic); it also has the added benefit of being able to image discontinuities. The fluvial channels in the area have several characteristics that make their imaging and characterisation very challenging: they have been re-worked several times throughout geological time, as a result they are not very long and continuous, and they vary over several scales. In the shallow section of interest, the frequency decomposition was particularly successful at imaging the faults (Figure 2a).
Frequency decomposition results mapped on the Hutton surface (Figure 2b) illustrate the challenge in imaging and characterising the channels. The frequency decomposition was calculated using the full (angle of incidence) volume on a first iteration. There were three-angle stack volumes available. To analyse the amplitude responses in the three volumes and to be able to compare the result efficiently , we generated an RGB blend of the reflectivity strength of the three volumes. The Near volume was attributed to the red colour, the Mid volume the green colour, and the Far volume the blue colour.
Observing the results mapped on the Hutton surface (Figure 2c), we see that most of the information comes from the Far stack volume (image is dominated by the blue colour). This represents an increase in the amplitude response with offset. Due to this result, we applied the same frequency decomposition algorithm to the Far volume (Figure 2d). In the Far volume, the imaging of the channels improved. They are more continuous, and the edges are better defined. There is also more contrast between the channels and the areas around them, than the results using the Full volume.
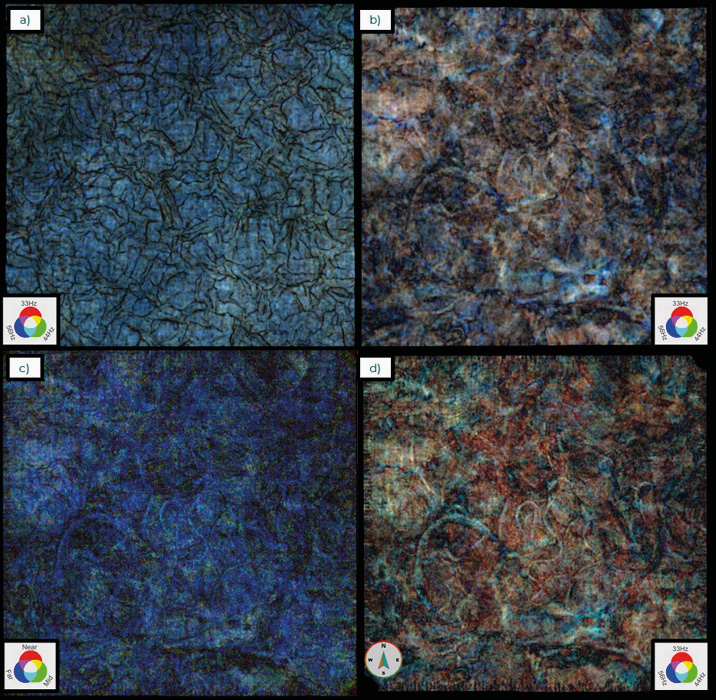
Figure 2 – a) Frequency decomposition results mapped on the Coorik surface. In a frequency decomposition colour blend, the discontinuities show as dark lineation. This represents a low response from the 3 channels at the same time. b) Full-stack frequency decomposition results mapped on the Hutton surface. c) Angle stack RGB blend mapped on the Hutton surface. d) Far stack frequency decomposition results mapped on the Hutton surface. © Geoteric.
Geobodies and Facies Classification
Once we can image the channels with a high level of confidence, we can use the results to extract these features as geobodies. The Adaptive Geobodies tool, with its data-driven, interpreter-guided approach, makes it possible to extract individual structures in the data. Several channels in the area of interest were extracted as individual geobodies (Figure 3a) and their volume calculated. In the Birkhead Formation, one of the channels was extracted using a more complex system of geobodies. This captures the internal variability that could be observed in the colour blend and its surrounding area (Figure 3b).
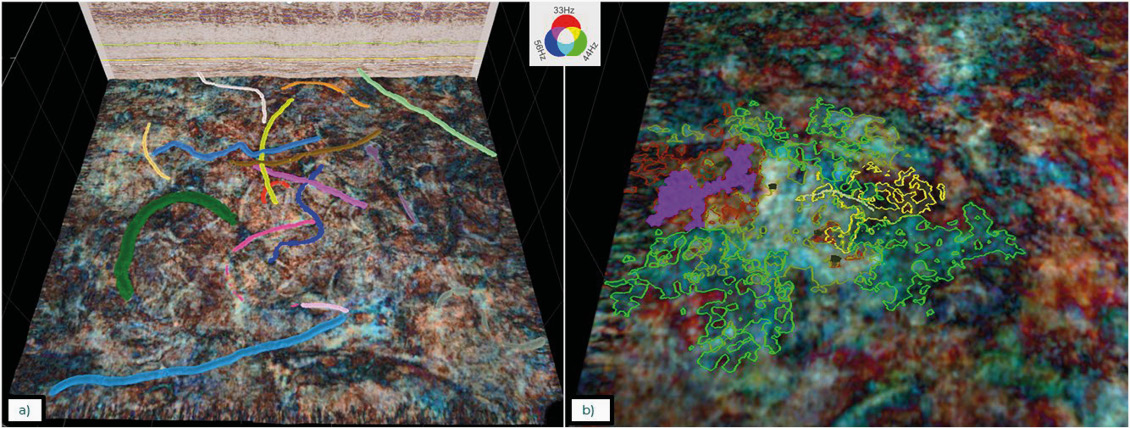
Figure 3 – a) Individual channels extracted as separate geobodies. b) Multi-stage geobody extracting channel and surrounding area, lines represent geobody edges where they intercept time slice. © Geoteric.
For a more regional classification, the Interactive Facies Classification was used. The tool classifies the data in a multi-attribute environment. For the classification, we used the colour blend from the frequency decomposition calculated using the Far volume. The tool uses several machine learning algorithms to identify and group facies regions with the same frequency response based on an area defined by the user. The classification is volumetric, where areas with the same response throughout the volume are grouped into the same facies (as opposed to the Adaptive Geobodies used to isolate an individual feature above) Figure 4. Selected areas of the input volume can be integrated with other attributes of well logs as a QC. The cross-plot can also be used to understand what attributes are more effective at segmenting the data. Well logs can be used to define attribute correlations with geological information, which supports its use as input for the classification.
In this case study, there is no well in the seismic survey area, so this type of analysis was not possible. The cross-plots were used to understand how the data was segmented (Figure 4).
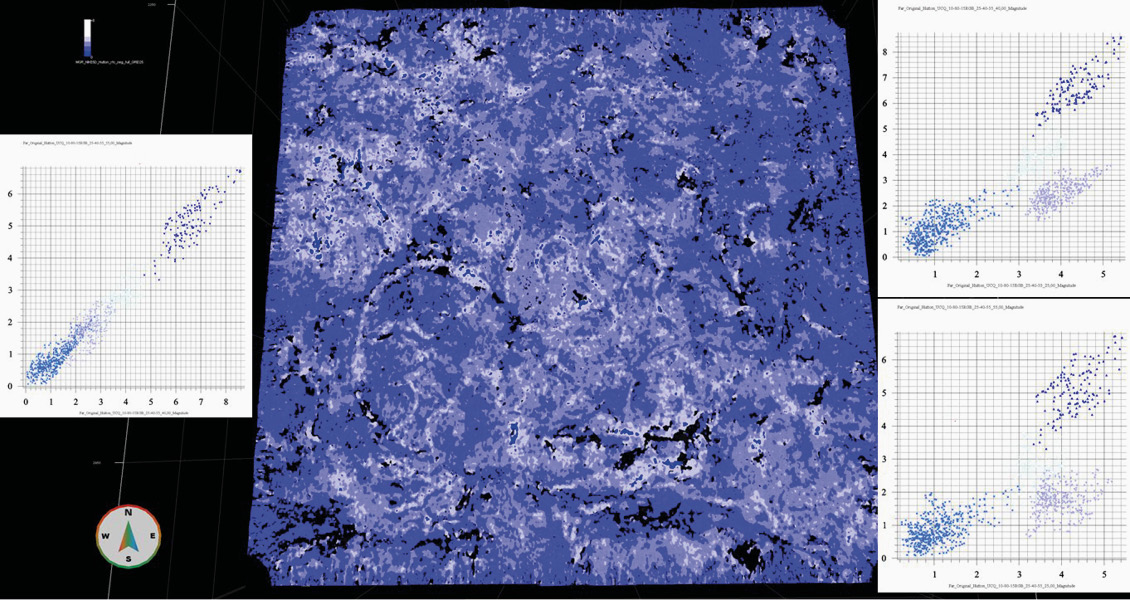
Figure 4 – Volumetric interactive facies classification capturing the frequency decomposition variability. © Geoteric.
Fault Imaging and Structural Analysis
The dataset was processed using Geoteric’s AI foundation network, quickly revealing many vertical and lateral faults, whilst providing a complete interpretation of the structure. Although the foundation network results can be fine-tuned to provide the network with further information specific to the volume, fine-tuning was not carried out within this project. For the subsequent workflows, we used the results of the foundation network (Figure 5).
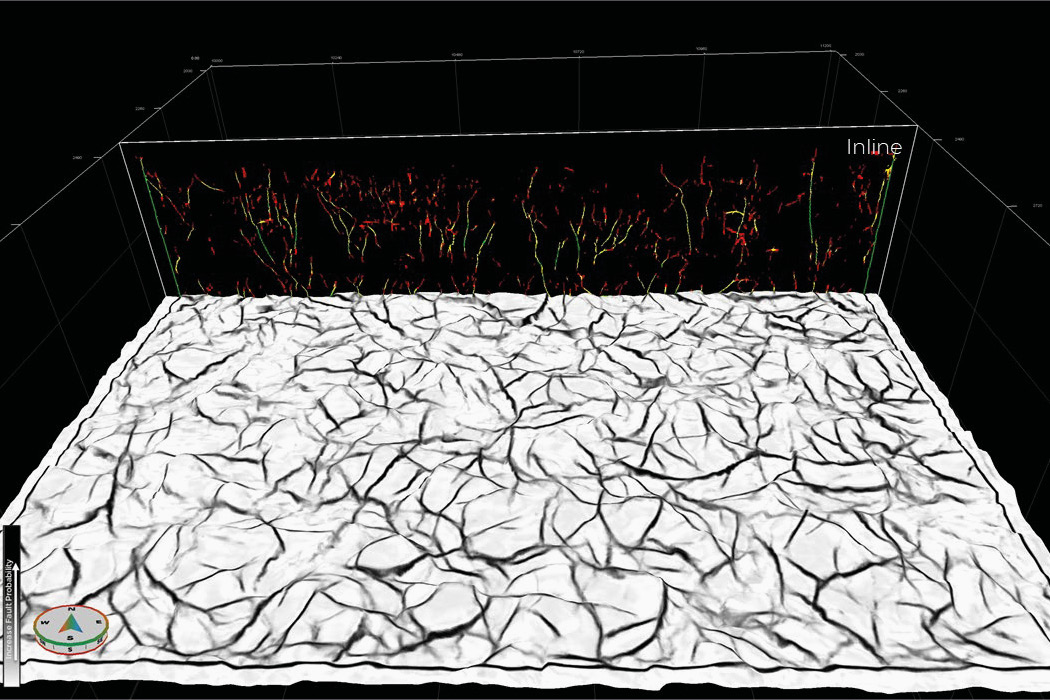
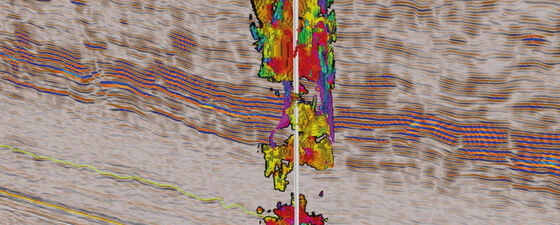
Figure 5 – Results from the foundation network mapped on the Coorik surface (grayscale colourmap) and a slice (colourmap shows confidence). © Geoteric.
Data Integration to Use and QC AI results
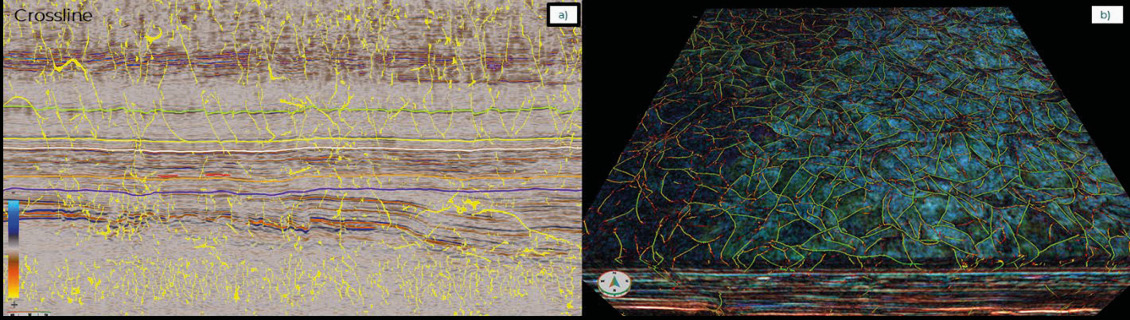
Figure 6 – a) Faults interpreted by the AI re-embedded in the reflectivity data. b) Faults interpreted by the AI combined with the frequency decomposition results. © Geoteric.
To test the accuracy of the AI Fault Confidence Volume and effectively QC, the AI results were embedded into the seismic for 3D analysis of the results. This is particularly important for low angle faults and faults parallel to the inline/crossline direction. Fault Trends faults were colour-coded by strike direction.
Combining the AI Fault result with other attributes such as frequency decomposition and colour blend workflow allowed stratigraphic and structural information to be observed/interpreted.
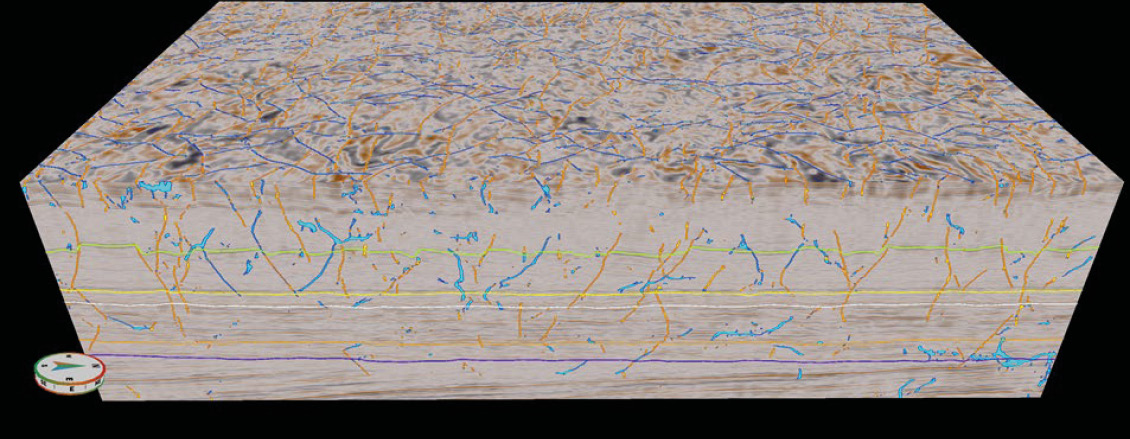
Figure 7 – Faults interpreted by the AI were classified as open (yellow) or closed (blue) based on their orientation. © Geoteric.
Analysis was taken a step further by combining the geobody with the faults classified as open or closed (Figure 8). This extra information allowed us to determine which compartments are possibly in communication or if the faults compromise the seal, and what compartments are possibly already drained and have no remaining hydrocarbons.
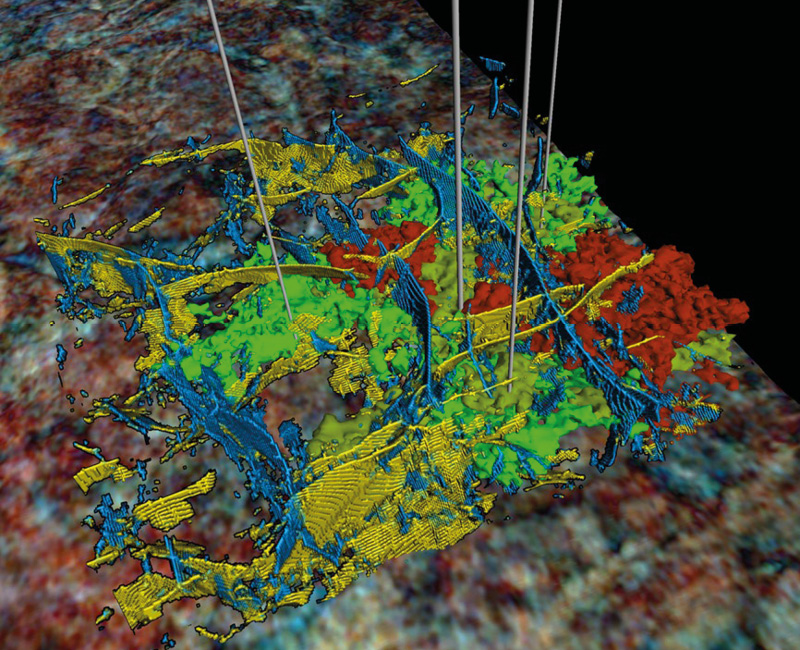
Figure 8 – Combination of 3-dimensional geobodies with 3D rendered AI faults. Blue faults are closed, and yellow faults are open. Geobodies represent different frequency responses of a channel and surrounding area. © Geoteric.
Digital Twin
The strength of this workflow comes with its effective integration into the existing workflow. Compiling the 3D information and visualising in a 3D manner allows geoscientists, planners, and engineers to observe the structural complexity, subsequent fault linkage and map projected well paths, observing faults along the trajectory that may cause the well(s) to be lost before they are drilled.
The tight timeframe of the project and level of detail exceeds what was possible with conventional interpretation techniques. The geobodies extracted using the frequency decomposition colour blends can be combined with the faults extracted using the convolution neural networks (Figure 8). This allowed us to build a model to define the compartments delineated by the fault network and how they interact with the geobody representing our potential reservoir, which has huge implications on well planning and field development.
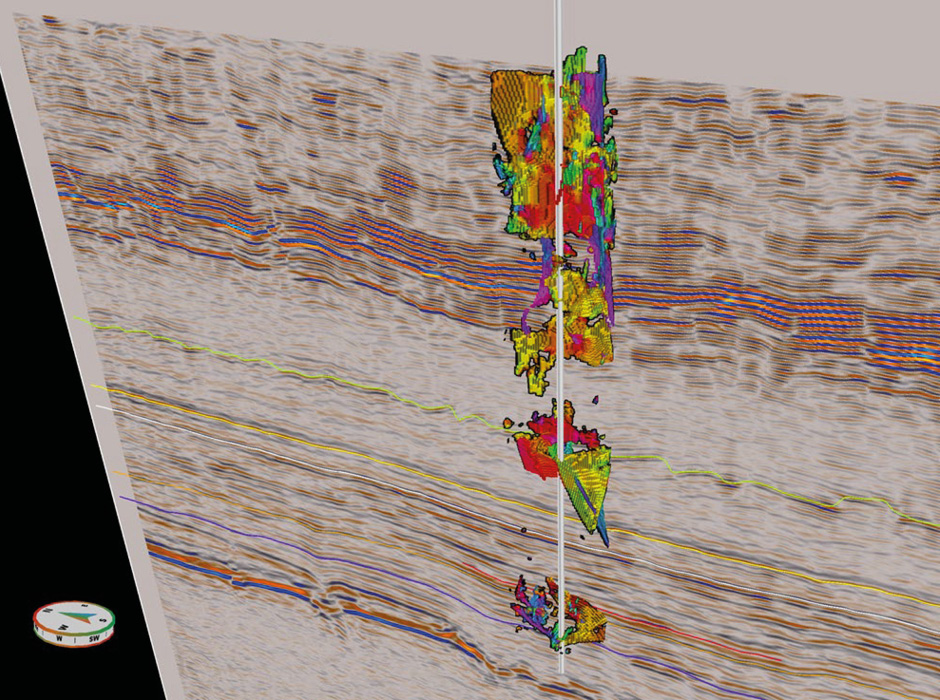
Figure 9 – Proposed well path combined with 3D rendered fault planes. The interception of faults with the well path can be assessed for risk analysis. © Geoteric.
Significant Time Saving
The work to produce this analysis took only days from receipt of uninterpreted data to the results shown above. Integrating Geoteric’s AI-driven seismic data analysis into a traditional workflow, to allow thorough quality control and to correctly appraise your resource volume, will allow you to transform your analysis.
Acknowledgements
Data courtesy of Discovery Energy.
Examples are shown using data courtesy of The South Australia Government, Department for Energy and Mining – Energy Resources and Discovery Energy.
The authors would like to express their gratitude to Barry Goldstein – Executive Director, South Australia’s Energy Resource Division and Elinor Alexander – Director Geoscience and Exploration, South Australian Department for Energy and Mining, for allowing the results to be published.
Results were produced using Geoteric’s software and AI technology (Geoteric Stratum™).