Structural seismic interpretation can be a complex and time-consuming task. In this case study, we have applied an Artificial Intelligence (AI) fault interpretation workflow to a 28-year-old dataset (1992) from the UK sector of the Southern North Sea. See how cutting-edge AI technology is enabling a revolution in subsurface understanding. It is about time there was some delivery from the promise of AI to help and enhance the subsurface workflow. Pipes and pumps are one thing, but the subsurface is not so easy to measure directly. At Geoteric we have been engaged with the application of AI to data types of all quality, from around the world. We, and our clients, have seen that AI is now mature enough to provide insight and new understanding to datasets young and old. If you think the data quality needs to be perfect, think again (Han and Cader, 2020)! If you need a better understanding of the system you are working with at a development or exploration scale to inform investment decisions, AI is now proven to be the breakthrough you need. Even in noisy or poorly orientated datasets, AI is seen to deliver an informative 3D model of the subsurface. Effective structural analysis is critical to asset team decisions. The ability to reveal faulting and structural elements in 3D helps understanding of the subsurface, not just in the level of detail that can be obtained, but also the speed; time thus saved can be used to enable further understanding. Embedding AI fault results into the horizon interpretation process ensures the resulting horizon (Figure 2 – foldout on previous page, top right image) is interpreted understanding the location of AI-defined faults and allows for further accurate surface generation, tightly tying the faults. As the interpretation is bound by AI-detected faults, this in turn creates a pseudo-fault polygon representation on the horizon (Figure 2 – middle right image). It is well known that frequency decomposition can reveal stratigraphic features in great detail throughout seismic volumes. By combining this high-resolution stratigraphic analysis with the AI fault result (Figure 2 – bottom right image), an interpreter can gain a greater understanding of their volume and any potential interaction between stratigraphic features and structural events. Although the AI analysis attempts to find all faults in the data, the algorithm can miss one from time to time, as seen on the furthest left bounding graben fault, where a small antithetic fault is not identified (Figure 2). With the assistance of an interpreter, the algorithm can be further trained to identify features that were initially of low confidence. This augmented approach to AI interpretation not only ensures a quick turnaround in results but one determined to have the most accurate level of geological understanding. Revealing the structural elements in 3D can be greatly beneficial to an interpreter, helping them visualize features that would otherwise remain unseen. Best practice for structural interpretation involves interpreting the structures perpendicular to the strike of the faults. However, nature does not always allow for this, with most seismic volumes containing faults of varying orientations. In the background image of Figure 2, several wide, low-angled fault responses are observed, which would normally be questioned instantly by an interpreter. After investigation, these responses are confirmed as faults, but they are (sub)parallel to the seismic section. Faults observed in this orientation often produce some very interesting shapes, which are confirmed after QC (see Figure 3). The identification of (sub)parallel faults can further assist in horizon interpretation and explain why there may be a break in an apparent continuous reflector, only to reappear shortly after. This allows an interpreter to work in a traditional 2D environment (in-line and crossline interpretation), whilst having a strong appreciation for the 3D shapes of faults, often an issue which remains with traditional interpretation techniques. The AI fault analysis of the Lancelot field illustrates exceptional results when visualized in 3D (Figure 3). The ability to see the distribution of faults in a lateral and vertical continuous manner gives the interpreter more confidence in the results and a deeper understanding of the system. Having the ability to analyze the complex Dowsing Graben System in 3D allows for unprecedented subsurface investigation – now the intricacies of the complex faulting system can be revealed. In this image the internal faulting of the graben system is illuminated with many cross-cutting and basin parallel faults. We have experienced in several projects that the Geoteric 3D visualized model of the structure delivered by the application of AI has explained multiple post-drill well failures. Had AI been available predrill, and had it been applied to the data, the well trajectories would likely have been changed before drilling. Bringing the drillers and development team together around the 3D AI structural model is a key to better, faster and safer projects. The images from the Lancelot dataset show a horizon that has been offset by a fault – nothing so unusual there. The depiction of the fault on the in-line is very unusual and is something of invaluable assistance when interpreting horizons (Figure 4). To aid understanding in the figure, the fault is shown as an interpreted line on an in-line and a cross-line (A), and a time slice. It is also shown as a 3D plane (B) with transparency. Whilst it may be unusual to see a fault interpreted as a sub-horizontal ‘smile’ breaking up a horizon, it is clear this result is logical, consistent and correct. If you have reservoir engineering or petroleum system questions involving flow-pathways, either in production or exploration, perhaps the answer can yet be found in your seismic data. The identification and interpretation of elements that are difficult to find is a key benefit of AI analysis of seismic datasets. The Lancaster Field on the Rona Ridge, UK Continental Shelf is a proven fractured basement play; however, the dataset is 25 years old (1995). Therefore, the signal-to-noise ratio is low, especially in the presence of multiples and general complexities associated with fractured basement reservoirs. Using AI we can delineate many faults and determine the associated confidence rating. Fault trends have been calculated directly on the AI faults indicating their lateral orientation or strike (Figure 5). Knowing the local stress field, the orientation of the faults which are most likely open can be determined and examined and the implications considered (Williams et al., 2020). The AI algorithm’s ability to see through poor data to a more informative signal that is related to the fault structure has resulted in high-quality and reliable data which can be used to make a well-founded decision about the location and orientation of exploration or appraisal wells in good and poor data. The work to produce the models of these fields can take just a day from receipt of uninterpreted data to the results seen here, with volume calculations. At Geoteric we think it is right to leave that decision to you, but for what it is worth we have already run over 150 seismic volumes and multiple client projects from all over the world. This AI fault interpretation service is removing the hype from the machine learning and AI technology cycle and replacing it with delivery. We believe that this as just the beginning of a deeper understanding of the Earth
Artificial Intelligence: revolutionizing our understanding
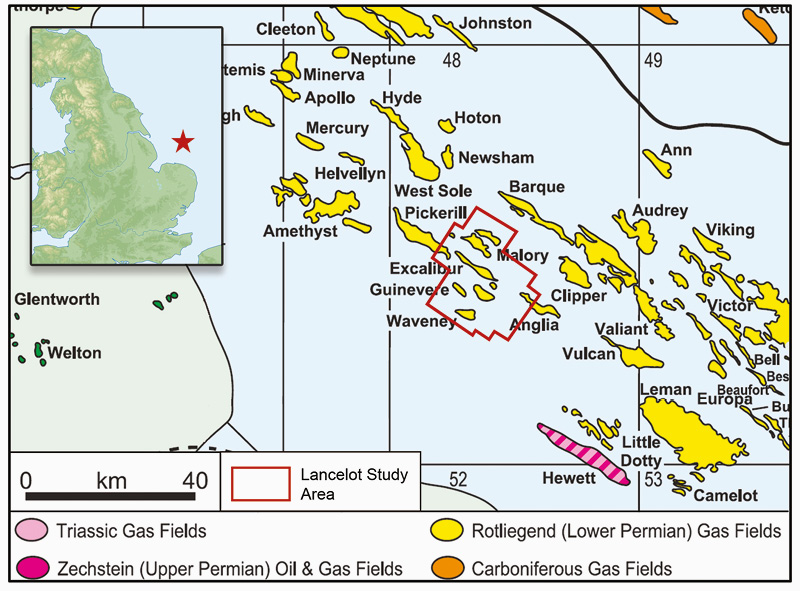
The data focuses on the Dowsing Graben System (DGS), North Dogger Fault Zone. The complex, thin-skinned tectonics which define the graben feature are detached from the underlying Permian tectonics. These are responsible for the surrounding hydrocarbon fields such as Lancelot, Excalibur, Mordred, Guinevere and Galahad; however, recent studies illustrate the importance of the DGS on the petroleum system (Grant et al., 2019). Knowing that faults can influence the petroleum system, they all need defining clearly and concisely so a greater understanding of the subsurface can be achieved. The clarity of the AI results ensures a rapid and detailed understanding of the structural regime. As would be expected from the application of AI, the results are available very quickly, the interpretation is free of any interpreter bias and delivers an indication of the confidence in the structural interpretation. Figure 2: New tricks with old data: AI fault analysis of a 1992 dataset from the UK North Sea, revealing the structural complexity of the Dowsing Graben System. © Geoteric.
AI seismic interpretation
The big 3D reveal

Illuminating faults
Path to success is rarely straight

Old fields, new perspectives

So, is it all hype?
Related Articles