Advancing Subsurface Understanding and Maximising Operational Efficiency with AI
Subsurface interpretation using AI is here and being used on live projects. It is delivering clear improvements in subsurface understanding at a time when it has never been more important to make the correct decision to drill or to drop.
Today, obtaining the best value from existing assets, and those approaching decommissioning is a critical element for many companies. The use of AI has shown to deliver an improved understanding in a very short time period. For the majority of the datasets we have worked with in Geoteric we have found that AI identified elements that changed the understanding of the subsurface, either fundamentally or in the details. As it is often the details of the subsurface that makes or breaks the investment, having the best possible understanding is crucial.
Geoteric’s AI assisted fault interpretation enables the delineation of faults at multiple scales in a ROI; from regional faulting to smaller scale faults that could have an impact on prospectivity and production.
A Time-Saving, AI-Backed Subsurface Interpretation Solution
Time is a critical element in exploration and development projects. Operators need information derived from data to allow decisions to be made on time, for a particular decision point. Often the extent and quality of the available information is constrained due to time pressures on the team doing the geological analysis, which can lead to decisions being taken with very imperfect information. At the best this is frustrating, but at the worst this leads to a catastrophic result, either from a safety or economic point of view.
Using AI, we have found it possible to deliver fault interpretation results at a pace that only 18 months ago we would have said would be impossible. As we have developed our techniques and examined different computing platforms, we have seen times compress even further than initially anticipated. With this rapid pace, it is possible to take time that would usually be devoted to mouse clicks, and instead use it to closely examine and understand the structure of the earth revealed by AI. This gives significant acceleration to projects, allowing information that is often only available towards the end of a project to inform and deliver outcomes at a much earlier stage. In turn, this can avoid the need to repeat work called into question by critical data elements that may be delivered later than anticipated. On the other hand, if new data becomes available in an on-going project, the ability to quickly provide an interpretation may allow data that would have remained on the shelf to be included in the analysis and inform a critical decision.
Old Fields, New Perspectives
There is a mistaken view that only the most recent and best quality data are suitable for AI processes that can indicate fault locations in a seismic dataset. To date, at Geoteric we have run over 100 data volumes through our AI fault process. They range from recent data acquisitions using the latest technology, to vintage data from the 1990s that may leave a little to be desired. It has proved possible to gain new and insightful data from both old and new datasets, certainly increasing the understanding of the subsurface, and likely informing the decisions that will be made for future development.
The ability to see deeper into the data is evidenced by an imaging project recently undertaken with AkerBP. The dataset contains a gas cloud that causes a significant degradation in the data quality, to the point that it is not possible to manually interpret a meaningful fault network. However, the AI process is able to see though the imprint of the gas cloud to a more informative signal that is clearly related to the fault structure identified outside the gas cloud, as can be seen in the image in Figure 1.
Figure 1: Data courtesy of the Valhall Joint Venture: Aker BP ASA (operator) and Pandion Energy (partner).
A senior geophysicist, working on the Valhall with AkerBP, said: “In the Valhall seismic obscured area, where classical fault interpretation is very difficult even on converted wave data, all discontinuities are captured easily by the fault confidence cubes and the interpreter has the ultimate decision to interpret the discontinuity as a fault or leave it”.
Geoteric / Aker BP Case Study
To transform their asset understanding and performance, Aker BP wanted to know if Geoteric’s AI Fault Interpretation could unlock a new level of insight, ensure drilling safety and as a result maximise production revenues.
Case Study: Enhancing Operational Efficiency with AI
As evidenced by the images, the quality of the interpretation from the AI process is very high. We have seen complex geometries expressed in the results that on first appearance look to be unrealistic, compared to normal interpretations. It has become apparent that by analysing every seismic trace, rather than interpreting faults by eye on seismic sections, the true nature of the subsurface structure can be much more complex than appreciated to date. How often is an elongated sub-horizontal ‘U’ shaped structure interpreted in a seismic section, even though given the 3D nature of some fault complexes they must exist? (Figure 2).
Figure 2: For the first time, exploration screening can serve as a structural guideline to highlight details such as intersecting oblique fault planes.
Interpreting Faults or Horizons First?
It can be seen in Figure 1 that the answer to the question ‘do we interpret faults or horizons first’ is self-evident. To obtain the best understanding of the stratigraphy of a sequence, it is imperative to have the best representation of the fault network. The complex 3D nature of this fault network is a significant piece of the puzzle to solve the correct horizon correlation. It would be unusual for a manual interpretation to see such a complex geometry in a fault interpretation.
Figure 3: YouTube video illustrating multiple small faults with complex fluid pathway
The detail contained within the AI-based fault interpretation provides potentially critical understanding for the formation of a hydrocarbon field, and any exploration or development plan that may be considered. We can see in Figure 2 that even major fault elements are often represented as significant continuous structures, perhaps a solid line on a map, yet these are frequently much more complex zones of deformation made of many smaller fault planes. The significance of this difference in structure is critical in target containment and the associated production flow characteristics of a prospect or field. If part of the field containment is provided by a bounding fault, is the structure of the fault understood in detail? A single continuous fault plane will have significantly different flow and containment properties compared to a closely spaced series of discontinuous smaller fault planes providing complex pathways through the fault zone. Whilst this is a self-evident statement, there are certainly some recorded cases in exploration of fault zones that were thought likely to provide containment for accumulations but proved not to do so.
Development is not in the clear in this space either. Flow properties across fault zones have, on occasion, been seen to be different from those expected; sealing where no seal is expected creating additional compartments, for example; or leaking where a barrier was expected, allowing perhaps watering out, or even allowing the target accumulation to have leaked.
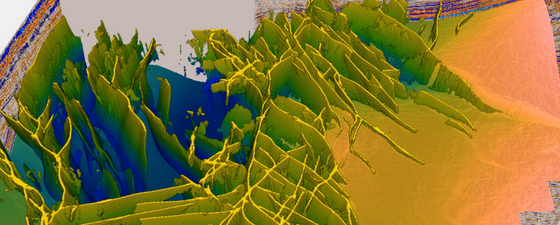
Figure 4: Orthorhombic faulting in the Beagle sub-basin
Comparing Apples with Oranges
There is nothing to stop a geoscientist from matching the level of detail that AI is capable of generating. The difference is the time available and the conflicting demands on that time. A geoscientist has many activities to perform, understanding and synthesising the wide range of data available to them and communicating this to other team members foremost among them. Unfairly, AI Fault Interpretation has just one job: to understand, using every data trace within the data, in order to reveal the structure of the fault network. It can examine every inline and every cross line to identify the detail of the fault structure – unlike the geoscientist who may well have a simultaneous demand for a reserve update and partner meeting so reducing the time available to spend on the interpretation. It may be that only every 10th or 20th or some other skipping distance of inline and cross line can be interpreted. The dangers of this are obvious; it is not always possible to capture the detail of a fault system without examining every element of the data. In addition, the quality of a traditional interpretation depends very much on the orientation of the particular structure within the seismic (Figure 5) dataset. Fault structures that approach the inline or cross line obliquely are very difficult for an interpreter to see (see Figure 2) thus requiring the use of multiple ‘random’ lines to be confident of identifying illusive, but potentially critical structure, whereas the AI is capable of identifying this level of detail very effectively.
Figure 5: The render illustrates both well paths and the presence of the fault which has been coloured to orientation. Faults which are oblique or parallel to the seismic section (purple).
Geoteric AI Case Study
Using Geoteric’s AI Fault Interpretation Service to reveal geological hazards and ensure drilling safety in to order maximise production revenues.
TERN AI Case Study: Tern-Eider Ridge, East Shetland Basin, Northern North Sea
AI Assisted Seismic Interpretation: Human Input Needed
There is a tendency for everyone to be sceptical about new technology and developments. We understand this. We are lucky that there is now a greater availability of seismic data in the public domain than has ever been before, and we thank the organisations and teams who have made it available. This has made it possible for us to work with these datasets to allow us to gain confidence with our technology, and to develop workflows which are effective, useable, and deployable.
A very detailed and impressive piece of work by K. D. McCormack and K. R. McClay provides a wonderful analysis of the structures in the Canning Basin, Australia. We applied AI Fault Interpretation to this same dataset, and it is apparent that the results of the two studies indicate a very similar story, providing a high level of confidence in the results from the AI. While it is fair to say that the AI fault identification was much quicker than the manual approach, it is important to note that the human mind is still needed to understand the information.
Figure 6: Left: published work by K. D. McCormack and K. R. McClay on the structural geology of the Canning region. Right: Geoteric AI Fault Interpretation results. A fault direction attribute has been run on the results and rendered in 3D.
Multi-level Optimisation
Designed with flexibility in mind, our AI fault interpretation has been designed to deliver confidence across three steps; regional, reservoir and well. Examples of how this can be applied include:
Regional focus: Figure 7 is based on data from the UK Southern North Sea (SNS) PGS Megamerge and shows the result of a 2.7 Tb dataset using the AI-Fault process. In this regionally-focused dataset, the main structural trends are clearly displayed, and the different generations of data gathering have been brought together to give a regional picture of the SNS gas basin. To attempt such a piece of work manually is in all reality unthinkable.
Figure 7: Southern North Sea dataset scale.
Reservoir focus: The quality of the results produced can be better assessed when zoomed in into the area of interest. The images in Figure 8 show a reservoir level analysis of the Lancelot field dataset. The sharply imaged, laterally continuous faults reveal the intricate details of a complicated tectonic history and associated horizon interpretation.
Figure 8: Lancelot reservoir scale results.
Figure 8: Lancelot reservoir scale results.
Well focus: At an even more detailed level, pre and post well analysis can be performed very efficiently in a search for potential hazards, or to understand any problems with a well. This image is a blind test of the AI on a post drill examination of a well, the first (short) well path encountered an unidentified fault, the subsequent side-track (long) weaved its way above and through the faults and descends late into the reservoir interval, avoiding the complex intersection where the original foundered. This side-track well delayed the project by weeks, incurring additional cost. If this fault information had been available before the well was drilled, it is likely the initial unsuccessful well path would have been more like that of the successful side-track.
Figure 9: Well focus results.
Transform Your Fault Interpretation Workflow Today
Using AI to help identify faults will change the way we work. It does not remove the requirement for geoscientists, rather it empowers them to better understand the subsurface. It is apparent that detailed information that has been and is being captured in seismic datasets can be identified, liberated, and made available to help inform decisions. Given that seismic datasets are perhaps the original Big Data, it is perhaps not surprising that modern data analysis processes are effective in identifying and bringing to our attention valuable patterns in the data, even old data, and in this case in the form of structural information and faults.
At Geoteric, we believe this is a continuation of the subsurface digitisation journey that began decades ago. With new algorithms, new workflows and new insights, it will be possible for the industry to redefine the metrics for successful exploration and production. New ways of working will be found. Decisions will be better informed, data will be more efficiently assimilated, and subsurface understanding will improve.
This is just the beginning…
Acknowledgements & References
Examples shown using data courtesy of the Valhall Joint Venture: Aker BP ASA (operator) and Pandion Energy (partner), The UK Oil & Gas Authority (OGA), Geoscience Australia, The Geological Society, London.
McCormack, K. D. and McClay, K. R. [2018]. Orthorhombic faulting in the Beagle Sub-basin, North West Shelf, Australia, Geological Society, London, Special Publications, 476, 28 March 2018, https://doi.org/10.1144/SP476.3
Results were produced using Geoteric’s software and AI technology developed by Geoteric’s R&D team. The author would like to express their gratitude to Geoteric’s Geosciences team who generated the examples above.
Contact Geoteric
If you would like to know more about Geoteric’s AI Fault Interpretation, download our brochure today and get in touch www.geoteric.com/contact
Further Reading on AI in Seismic Interpretation from Geoteric
Trusting AI in the Subsurface
GEO ExPro
Before widescale adoption of artificial intelligence across the subsurface arena, there is still one outstanding question; can it be trusted?
This article appeared in April, 2020
Artificial Intelligence and Seismic Interpretation
James Lowell, Peter Szafian and Nicola Tessen; Geoteric
The key to all seismic interpretation is the interpreter’s experience and knowledge, so why should artificial intelligence change that? The reality is, it shouldn’t.
This article appeared in Vol. 16, No. 2 – 2019