Where are the Reservoirs?
Modelling geology at the scale of the actual depositional systems allows you to capture the entire system and monitor the processes involved, and thus identify the location of elusive reservoirs and sources.
The presence of reservoir quality sediments, in both carbonate and siliciclastic environments, is a direct consequence of sedimentary processes related to the depositional setting. Exploring for and developing hydrocarbon resources is therefore irrevocably linked to the understanding of these processes, which can lead to the ability to predict sediment distribution in time and space. A knowledge-driven approach, such as that used by Digital Geology AS, using well, seismic and other data, which relies on a consistent understanding of the geology at all scales and stages, can reveal those hidden reservoirs.
Megasequences as observed onshore Svalbard. The understanding of the relationship between these and wells in the Barents Sea and integration of the data is crucial in understanding Svalbard-Barents Sea sedimentary model.
The Methodology
This knowledge-driven approach has a number of stages, as briefly outlined below:
A consistent interpretation of lithology, facies, facies associations and stratigraphy is established for the entire wellbore for all wells in the study area, based on an in-depth study of all available data, including logs, core, trace fossils, biostratigraphy and biological environmental assessment;
Subdivision of the rocks into genetic sedimentary packages through sequence stratigraphy enables the correlation of different facies and the logical prediction of sediment distribution in time and space. Megasequences (and sequences) are bound by regional peak transgressions (‘maiximum flooding surfaces’), which are easy to recognise on a regional (i.e seismic) scale, so the next step is to delineate these transgressions;
The famous slug diagram depicting the different systems tracts that made up EXXON’s sequence stratigraphic system.
The lithological stacking pattern is combined with seismic data and other information to map the shoreline trajectory for the various depositional units;
The system of shoreline trajectory as defined by Helland-Hansen and Gjelberg (1994).
The uneroded thickness map for each depositional sequence is used together with the well data to map the paleo-coastline;
A theoretical line that elucidates the path of the shoreline trajectory through time. The low angle shows inferred extended facies belts, while the change in angle towards the end (as drawn here) implies a narrowing of the facies belts. Inputting the angle into the software allows the possible physical extension of the facies belts to be accurately calculated.
Based on this approach the depositional models for each megasequence and sequence can be established.
An Example from the Barents Sea
Digital Geology has used this approach on exclusive studies for clients in Colorado, North Dakota, Trinidad, Bangladesh, Azerbaijan and Kazakhstan, among others, and also have a commercially available depositional model based on studies covering the Norwegian Sea and the Barents Sea. The models are built in Roxar RMS, but are also available in Petrel. In this article we look in detail at the south-west Barents Sea and investigate how this approach can be actively used to fine-tune our understanding of the orientation of depositional systems.
Using a model of the south-west Barents Sea, extracted from the larger ‘Digital Geology megasequence 4D digital sedimentary model’ covering the Norwegian Barents Sea, we applied the methodology outlined above. Focusing on megasequences 5 to 12 (Late Jurassic to Paleogene) and combining the non-eroded (time of deposition) thickness maps with today’s structural setting, a series of 3D volumes depicting source potential was generated. The results revealed the high likelihood of several intervals containing source rock potential within Lower Cretaceous strata, as corroborated in wells and in outcrops onshore Svalbard.
Birds-eye view of a ‘time-slice’ elucidating the logical distribution of the main depositional system during the Mid Triassic across the entire Norwegian Barents Sea Shelf as covered by the Digital Geology sedimentary model. Note the three main sediment input points from Svalbard (North), the Russian sector (east-south-east) and the reduced but continuous input from the Scandinavian peninsula in the South.
Similarly, information about the possible distribution of reservoirs can be obtained through the consideration of a combination of two key elements: i) thickness maps generated for each megasequence at the time of deposition, and ii) an understanding of the shoreline trajectory derived from well facies stacking patterns and seismic interpretation indicating probable directions and angle of progradation/retrogradation. In short, outcrop data from southern Svalbard depicts a low angle to flat shoreline trajectory resulting in the depositional system prograding several hundreds of kilometres across the shallow shelf at the time, something that is corroborated with seismic across from Russian sector. The near flat angle of trajectory explains the lack of shallow marine coastal sands found in the few wells drilled, since such a low-angle system will result in sediment-bypass to the edge of the shelf at the time of deposition, as shown in the Digital Geology model below.
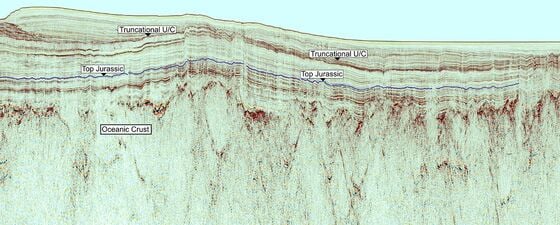
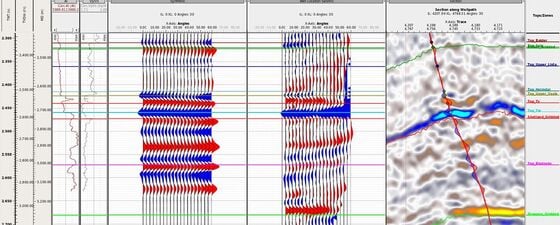
Changes in shoreline trajectory can be observed in both seismic and the stacking pattern of well data (a) and the consequences of this for sediment distribution (b). Using this information, Digital Geology’s 4D sedimentological model depicts reservoir potential within the Cretaceous and possibly Paleocene horizons offered in the 2016 APA Licensing Round.
Changes in shoreline trajectory can be observed in both seismic and the stacking pattern of well data (a) and the consequences of this for sediment distribution (b). Using this information, Digital Geology’s 4D sedimentological model depicts reservoir potential within the Cretaceous and possibly Paleocene horizons offered in the 2016 APA Licensing Round.
Further analysis of the model shows that, following a regional transgression during the late Early Cretaceous, at least two major phases of northern uplift can be observed in Svalbard, both of which caused major basinward shift of facies, again yielding reservoir potential sediments into the areas open to hydrocarbon exploration announced for the South West Barents Sea in 2016.
Following the initial opening of the Norwegian-Greenland Sea an area from Svalbard southwards to Bjørnøya was uplifted, shedding large volumes of sediments eastward into the Barents Sea in the very early Paleocene (as can be observed on Svalbard and in well 7321/19-1, the Pingvin discovery); again, our analysis of resultant Megasequence 10 suggests the possibility of reservoir quality sediments in the interval.
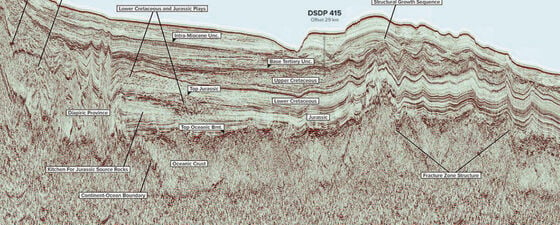
Example north-south seismic line from the Western Barents Sea overlain with a probable sediment distribution for Megasequences 6 to 11: note the low angle progradation in Megasequence 10 as discussed in the text. Data Courtesy MCGeophysical
Example north-south seismic line from the Western Barents Sea overlain with a probable sediment distribution for Megasequences 6 to 11: note the low angle progradation in Megasequence 10 as discussed in the text. Data Courtesy MCGeophysical
Successful Integrated Approach
This study clearly shows the potential for areas announced open to hydrocarbon exploration for the South West Barents Sea in 2016 and also explains the lack of success of the most recent wells made publicly available, 7212/8-1 and 7212/11-1. As such, it represents a new approach in understanding the dynamics of the depositional systems of the Norwegian Barents Sea and illustrates the much wider progradation of the sedimentary succession during the Latest Jurassic to Paleocene within the south-west Barents Sea.
It also demonstrates that this integrated approach, which we believe represents the optimal 21st century exploration and appraisal tool, which enables not only the confident mapping of the location of facies belts and their logical extensions, but provides us with a quantification of both source rock potential and reservoir rock distribution in time and space.
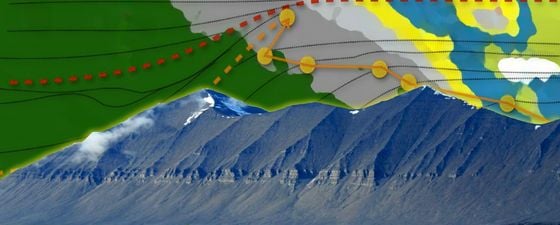
Rapid upward shallowing from slope mudstones to thin shallow marine sandstones (center of the picture) as can be observed in Megasequence-11 that is part of the Eocene basin infill succession, central Svalbard reflect the very low angle of the shoreline trajectory similar to Megasequence-6 (Lower Cretaceous)