Gas Hydrates – Part VI
Hydrates in the Arctic (I)
‘You can know the name of a bird in all the languages of the world, but when you’re finished, you’ll know absolutely nothing whatever about the bird… So let’s look at the bird and see what it’s doing – that’s what counts.’ Richard P. Feynman, Nobel prize laureate in physics, 1965.
Methane hydrate is formed in abundance in deep permafrost and shallow offshore regions, but little documentation exists regarding resource accumulations in Arctic areas and its evolution through time and space. Today’s sub-seabed methane hydrate reservoirs remain elusive targets for both unconventional energy and as a natural methane emitter influencing ocean environments and ecosystems.
CAGE Specialist Community
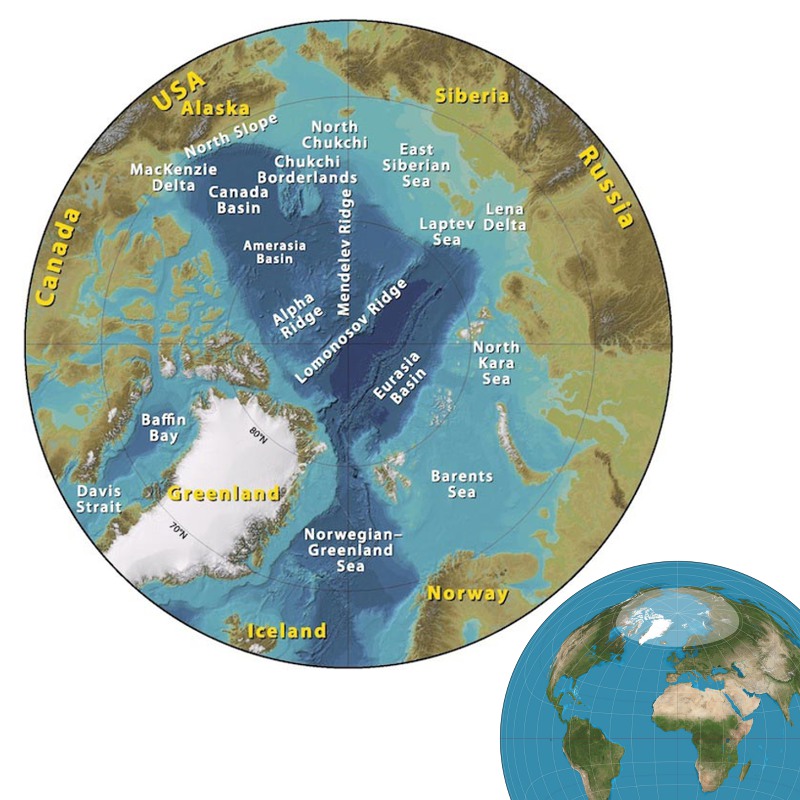 Arctic Cirlce map (Jakobsson et al, 2008) and inset with ‘Lambert azimuthal equal-area projection’ with Arctic circle (approx. 66.5 degrees north of the equator) highlighted (Source: Strebe).At the world’s northernmost university, in Tromsø, Norway, the establishment in 2013 of a Centre of Excellence – called the Centre of Arctic Gas Hydrate, Environment and Climate (CAGE) – signalled the start of one of the world’s foremost specialist communities in basic research on gas hydrate. It is funded by the Norwegian Research Council over a period of ten years.
CAGE, headed by Professor Jürgen Mienert, focuses on issues related to energy resources in the Arctic and the role of Arctic gas hydrate reservoirs in the future marine environment and global climate system. The acronym CAGE obviously has a double meaning since gas hydrate contains methane trapped inside a rigid ‘cage’ of frozen water molecules, kept stable only by sub-seabed high pressure and low temperatures.
CAGE will be carrying out fundamental research on gas hydrates by bringing together geologists, geophysicists, geochemists, micropaleontologists, biologists, oceanographers and experts in statistical modelling, collaborating with Russia and the USA. Together with the Canadian and US researchers, the centre is taking the initiative in conducting experimental drilling for methane in the Arctic.
The scientists in Tromsø have focused on shallow overburden in the Norwegian Arctic areas, and performed detailed mapping of fluid-flow systems. A major part of these shallow hydrocarbons is probably gas hydrate. The research group has discovered that a significant portion of the hydrocarbons generated in deep source rocks has leaked or migrated into the shallow subsurface, and is now trapped in gas hydrate and shallow gas reservoirs. The widespread distribution of these shallow accumulations was not previously recognised. In addition, the complex nature of these deposits and their mechanism of formation were not known.
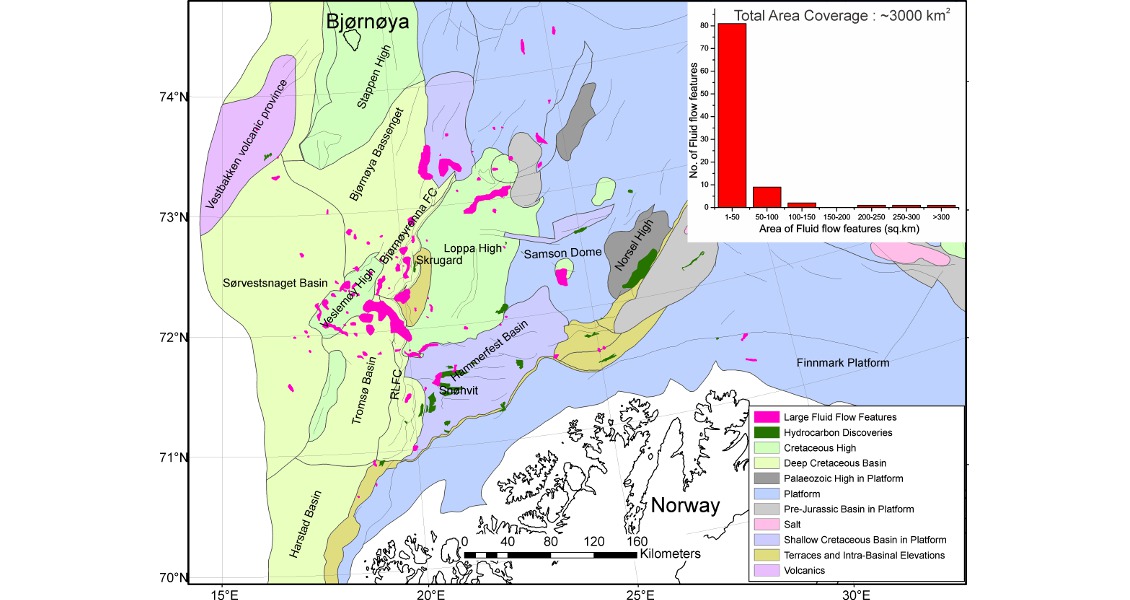
Distribution of large fluid flow features in the Barents Sea, some up to 600 sq. km. A plot of the area covered by these large features shows 81% of them are between 1 and 50 sq. km. (Vadakkepuliyambatta et al., 2013)
Mapping Shallow Fluid-Flow
The Barents Sea is named after Willem Barents (1555–97), a Dutch explorer and navigator who discovered Bjørnøya and Spitsbergen when searching for the Northeast Passage to Asia. It extends from 70°N (equivalent to the northern coast of Alaska) to 82°N, covering an area of 1.2 million km2, more than twice the size of the entire Gulf of Mexico. It is bounded by the Scandinavian peninsula to the south, the Svalbard archipelago to the west, and Frans Josef Land and Navaya Zemlya to the east.
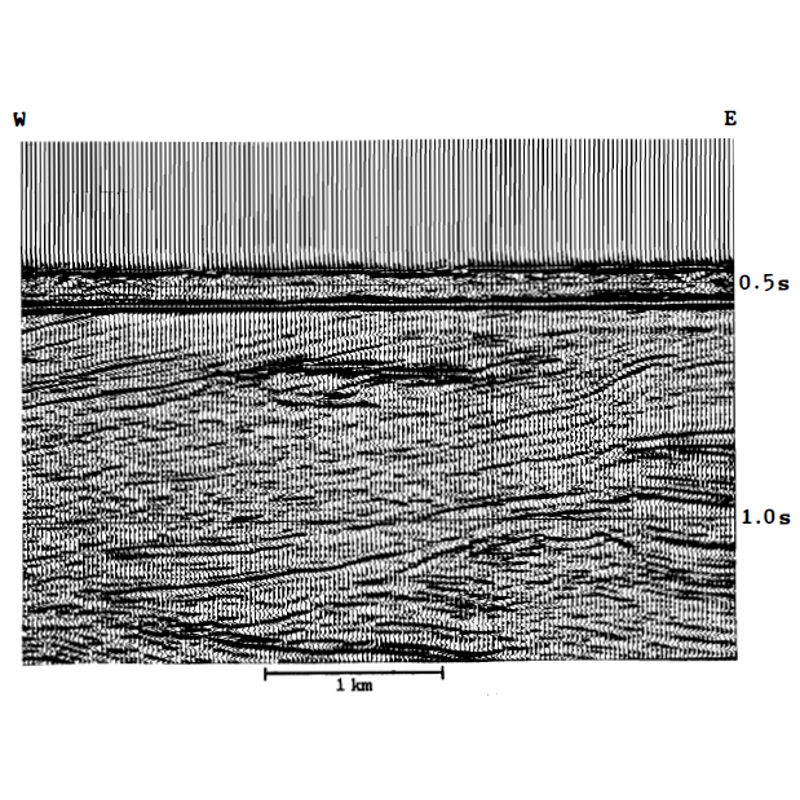 Seismic showing an anomalous reflector at 0.67s TWT interpreted as gas hydrates. (Løvø et al., 1990)The average water depth of the Barents Sea is 230m, significantly deeper than most of the present day high Arctic shallow (10–100m) shelves outside North America and Russia. To the west and the north, when entering the North Atlantic Ocean and the Arctic Ocean floored by oceanic crust, water depths increase rapidly to more than 1,000m. The Barents Sea is influenced by two different types of water masses: Atlantic water (T>0°C) and Arctic water (T<-1°C). In the northern Barents Sea, the flow of cold Arctic water maintains the seabed below 0°C in areas where the water depth is shallower than 200m. Below 200m, positive (+1 to +4°C ) sea floor temperatures are widely distributed due to the influx of Atlantic water.
Gas hydrates of the southern Barents Sea were first inferred by a detailed geological study by Løvø and co-workers in 1990. They found that methane hydrate was stable in areas with water depths exceeding approximately 280m where the water bottom temperature was 1°C, finding that the zone of stability in such a case extends to a depth of approximately 400m. By interpreting seismic lines from different areas in the Barents Sea where anomalous reflectors had been observed, they mapped several anomalies probably caused by gas hydrates (Løvø et al., 1990; Laberg and Andreassen, 1996). The anomalous reflectors cut across other reflecting horizons and paralleled the seabed, fulfilling the requirements of a bottom simulating reflector (BSR).
In the south-western part of the Barents Sea, a significant volume of hydrocarbons is believed to have migrated upward from deeper portions of the basin into the shallow subsurface, where it is now trapped in gas hydrate and free gas reservoirs. The figure below shows shallow fluid-flow systems in this area. The extents of such anomalies vary from 1 to 600 km2 (Vadakkepuliyambatta et al., 2013), and might therefore represent a considerable quantity of hydrocarbons, although not of direct commercial interest.
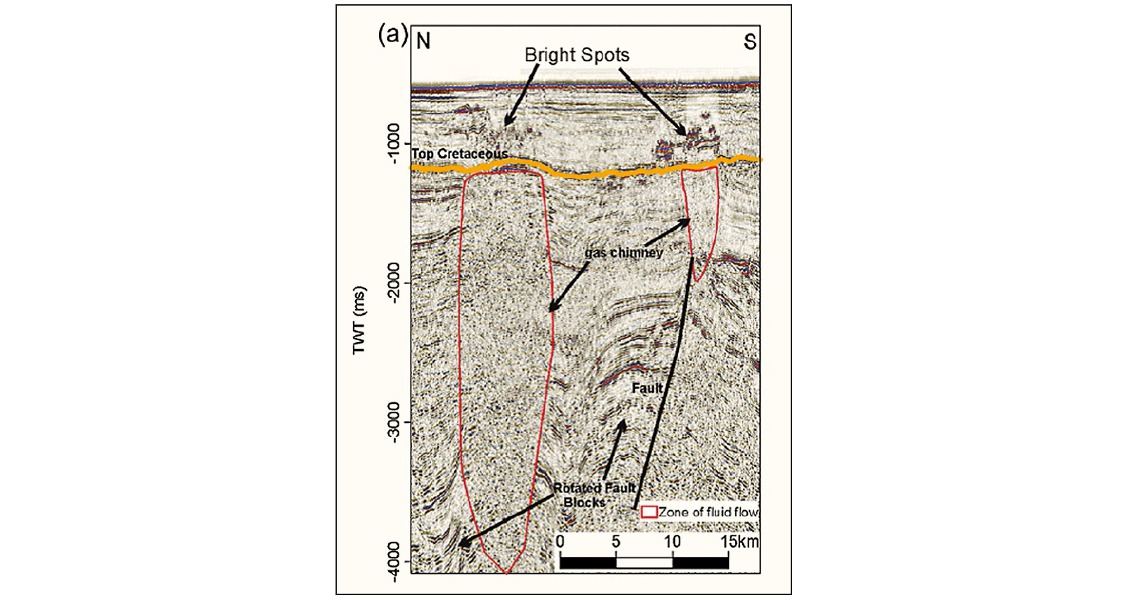
Typical fluid-flow system seen on seismic. Gas chimneys (chaotic areas with no coherent seismic signals within red polygons in the seismic) indicate the fluid flow path (migration), and the corresponding bright spots above indicate the top of the gas accumulation. The small chimney sits on top of or close to a major fault, suggesting a link between the fault and the leakage of fluids. (Vadakkepuliyambatta et al., 2013)
CAGE scientists find a strong correlation between these shallow fluid-flow systems and deep-seated faults, suggesting that extensional tectonics, uplift and glaciations are closely linked to fluid leakage.
Fault reactivation and glaciotectonics during Late Cenozoic time likely have led to the depletion of deep-seated hydrocarbon reservoirs and upward migration of hydrocarbon gases through gas chimneys (Henriksen et al., 2011; Vadakkepuliyambatta et al., 2013).
Interpretation of Gas Hydrates
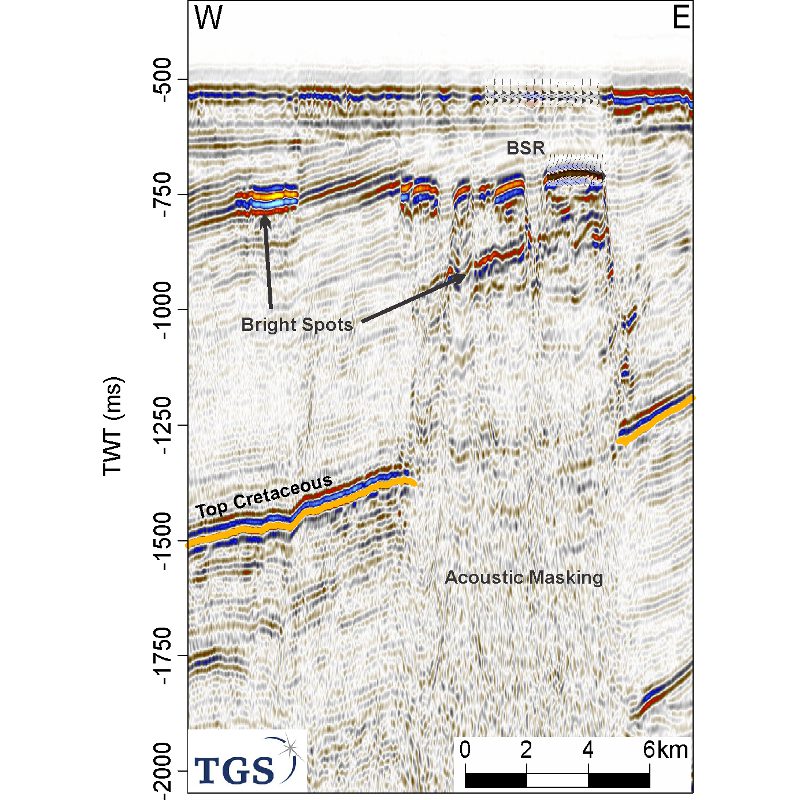 Crosscutting high-amplitude reflectors associated with the gas chimney from the Bjørnøyrenna Fault Complex. A large area of masked acoustic reflections and polarity reversed high-amplitude anomalies show fluid flow and gas accumulation. The patchy, crosscutting high-amplitude reflector mimics the seafloor and is interpreted as the base of the gas hydrate stability zone. (Vadakkepuliyambatta et al., 2013)Interpretation and especially quantification of gas hydrates is more challenging than detection of gas, since geophysicists have to rely on indirect methods such as the BSR to identify the hydrate zone or on detailed velocity information and rock physics modelling. An example from the Barents Sea is shown on the right, where the BSR is not an easily interpreted continuous event, but a discontinuous feature that brightens and dims along the horizon. Despite this, the interpretation is that the gas hydrate is situated above this level, probably all the way to the seabed, an interpretation strengthened by the hydrate stability and temperature curves representing typical conditions for the Barents Sea. Below the BSR there is gas, and the presence of this gas is the major cause for the brightening observed on the seismic. The dim spots along the interpreted BSR event are often connected to pockmark-type depressions on the seabed; from 2D seismic data it is hard to tell whether these are pockmarks or, for instance, iceberg plough marks. However, a likely assumption is that some gas has migrated through the hydrate area and into the water layer, causing the discontinuous appearance of the BSR.
In order to map and understand the complex nature of shallow gas accumulations, high-resolution 3D seismic is required. The seismic time slice below shows the top of a large amplitude anomaly interpreted as the base of the hydrate stability zone (BHSZ). The RMS amplitude time slice highlights the distribution of shallow gas accumulations at the base of the BSR within the seismic cube. The BHSZ reflection is discontinuous, with isolated, elongated and oval-shaped patterns up to 1,400m wide. Significant amplitude variations exist within these features, which may imply a considerable variability of shallow gas and gas hydrate concentrations across the region.
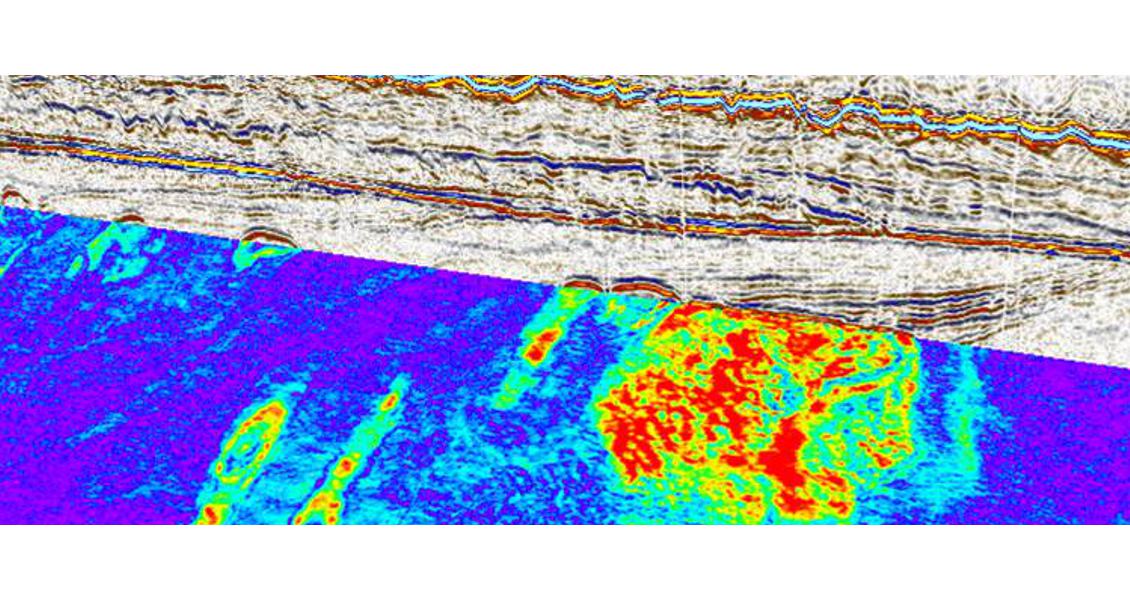
RMS amplitude time slice showing high amplitude anomalies, indicating the accumulation of free gas at the base of the gas hydrate stability zone (BHSZ). P-Cable 3D seismic cube from the SW Barents Sea (length ~ 9 km, width ~ 4 km, water depth ~340m, BSHSZ at ~300ms beneath seabed). (Mienert, J., Buenz S. et al., 2009)
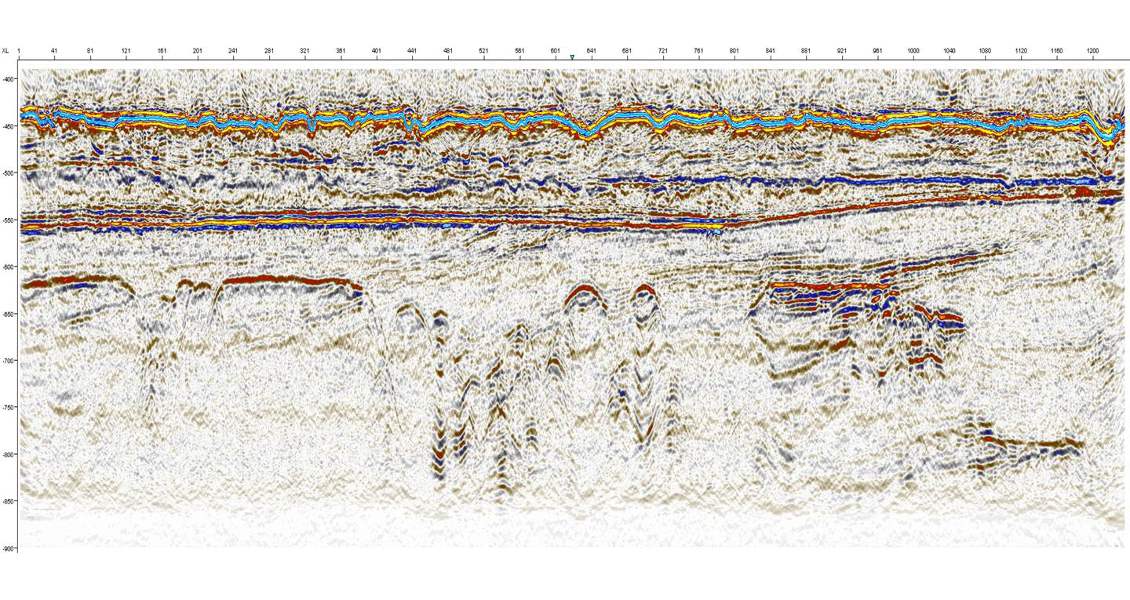
3D seismic example of interrupted BSRs and acoustic anomalies at ~620 ms TWT.