Puzzling Salt Structures
Detailed salt modeling has unraveled the development of a mystifying collection of structures that are a key element in the eastern Gulf of Mexico petroleum system.
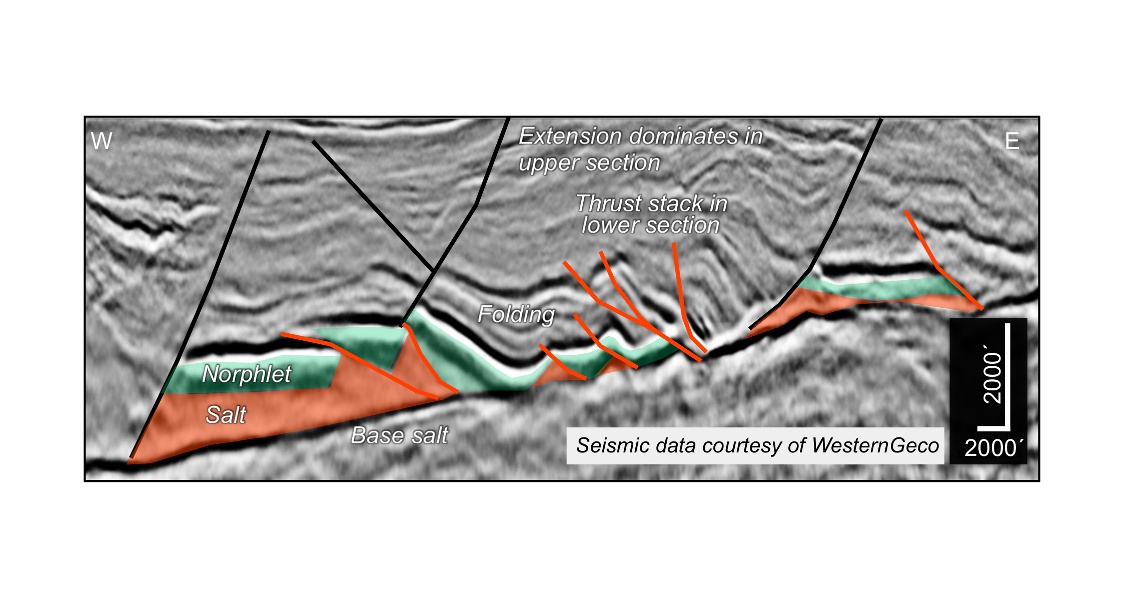
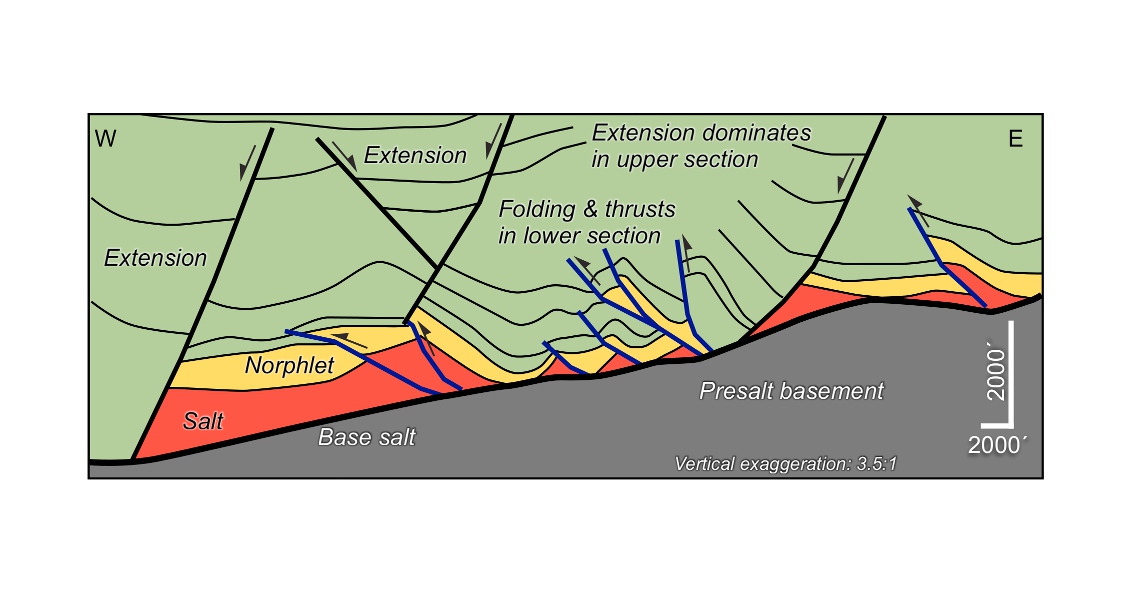
Seismic mapping near recent discoveries in the Jurassic Norphlet play, eastern Gulf of Mexico (GOM), has revealed extensional structures at expected orientations and shortening structures at odd angles to the prevailing salt flow. Geoscientists were at a loss to explain how, in a gravity-gliding salt system, this combination of structures could have formed. Funded by a consortium of oil companies, the Applied Geodynamics Laboratory (AGL), Bureau of Economic Geology (BEG) at the University of Texas at Austin, began to tackle this complex problem over three years ago.
Dr. Tim Dooley, structural geologist, and Dr. Mike Hudec, senior research scientist and head of the AGL, were interested in exploring the origin of a series of thrust structures that form important elements of strike closure for numerous Norphlet traps. Many of these thrusts are further updip than expected, and are nearly parallel to regional dip, at right angles to their expected trend. Through new salt imaging and modeling technologies and a lot of persistence, they were able to mimic what was being seen in the subsurface and solve the secrets behind the origin of these structures.
Norphlet Play
The Upper Jurassic (Oxfordian) Norphlet Formation is a relative newcomer to the stack of GOM hydrocarbon plays. Oil was discovered onshore in the states of Mississippi and Alabama in 1967 and 1968 respectively, and in Florida in 1972. The first offshore discovery found significant quantities of gas in Mobile Bay just off Alabama’s coast in 1979.
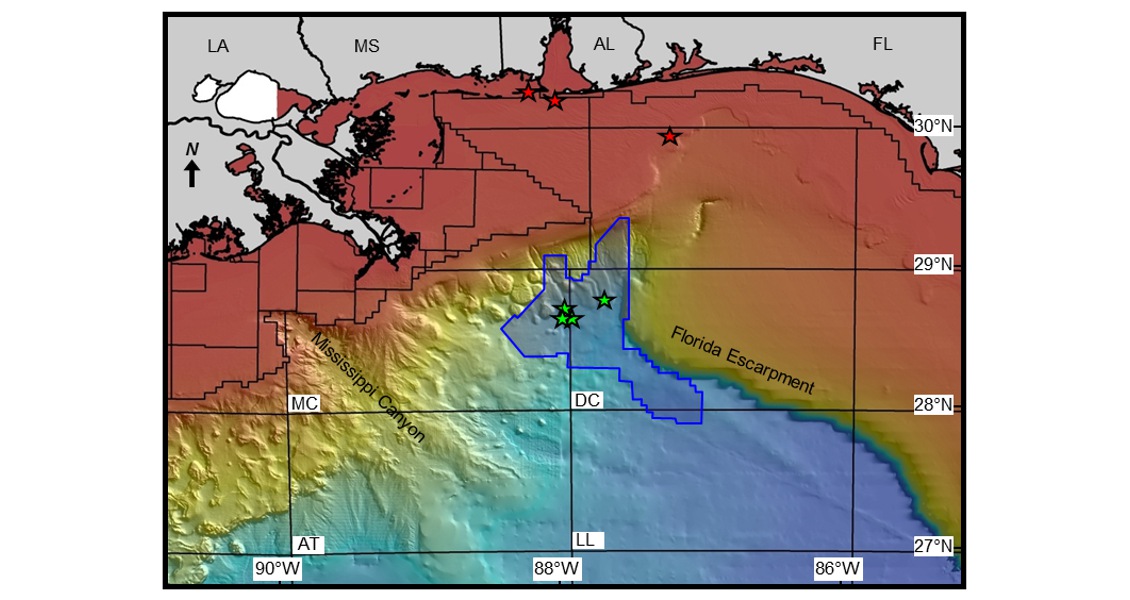
Map showing offshore gas discoveries (red stars) and oil discoveries (green stars) in the Norphlet play located west of the Florida Escarpment, GOM. (Source: Pilcher, Murphy & Ciosek, 2014) Add interactivity
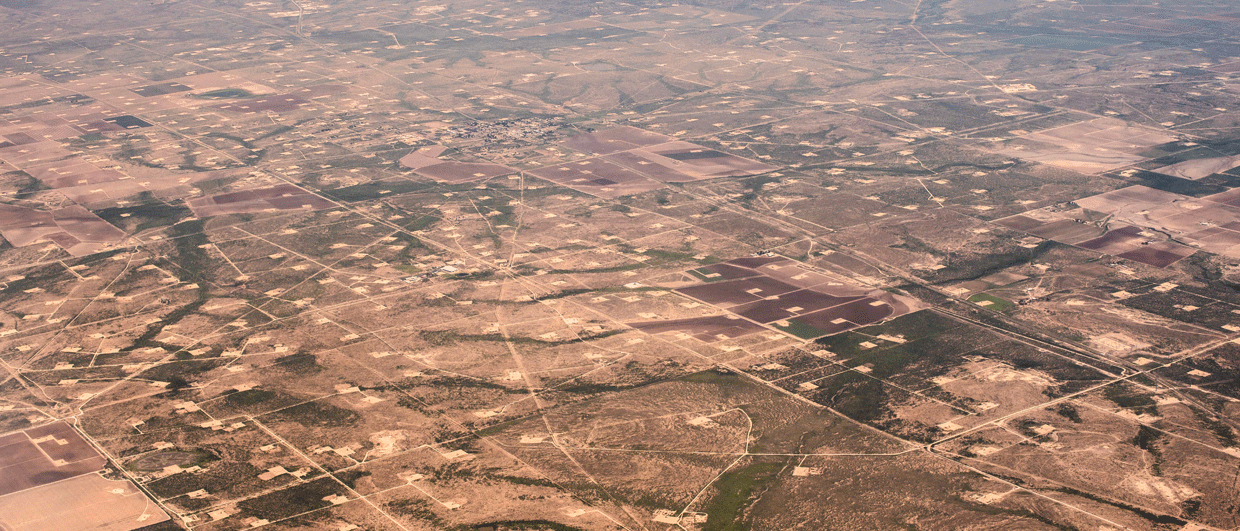
This prolific onshore play sparked interest around the eastern GOM as geoscientists postulated that it could extend into its deep waters. Sale 181, on December 5, 2001, was the first federal lease sale in the eastern GOM. The government awarded 95 leases and received high bids totaling over $340 million in that sale. Shell Offshore, Incorporated, won 28 tracts and Anadarko Petroleum Corporation received the second most tracts, winning 26. The federal government has held four additional lease sales in the area, including the last one in 2014, which received no bids. The next sale is slated for 2016.
Shell has been one of the most active companies exploring the Norphlet play. With its partners it has made six hydrocarbon discoveries in the area and three of those are considered large enough to be economic for development. Most of their prospects in the area are named after American Civil War encounters. The first discovery in the play was at Shiloh in 2003 followed by Vicksburg B (2007) and Antietam (2009). Then came the first major discovery at Appomattox in 2010 with an estimated resource of 500 MMboe. Shell and Nexen are currently in the design phase of development with the first production expected in 2017. Two more 100+ MMboe discoveries followed at Vicksburg A in 2013 and at Rydberg (named for the Swedish physicist) in 2014. Shell is currently following the Rydberg discovery with an exploratory well at their Gettysburg location.
Modeling Salt Flow
Drs. Dooley and Hudec have been working on salt-related structural complications in the eastern GOM since 2008. As Dr. Dooley relates: “The Florida Arch Modeling Program (Norphlet play) was an extension of this work. In total, 25 models have been run on this between 2008 and 2013 in an attempt to understand the origin of Norphlet thrust structures that are further updip and at orientations not expected by traditional models.”
They initially worked on simple cases, varying the thickness of the basal salt layer across dip-parallel steps. As Tim points out: “This produced detached strike-slip faults in the overburden due to the differential translation between areas of thick salt (fast translation) and areas of thin salt (slow translation). Gradually, we began to monitor the effects of oblique sub-salt highs and lows on the deformation we saw in the overburdens overlying the salt.” At the time, Tim was using standard monitoring techniques in the lab that consisted of overhead and oblique digital SLR cameras set on time lapse.
“On looking in more detail at some of the basement step models,” Tim continues, “we began to see many more complexities than we had previously thought. Oblique photography hinted at shortening structures forming at both the updip and downdip margins of the basement highs, yet we knew we were missing key data.”
Their early modeling through 2011 created interest in their work looking at the influence of what more complex subsalt topography had on the deformation in the overburden. To do this, Tim knew that their monitoring techniques were not accurate enough to detect small strains and variation in flow direction over time, and over a changing topography in the basement. “To understand the formation of the puzzling array of structures seen on seismic lines from the eastern GOM,” says Tim, “we knew we had to come up with better monitoring of our experiments, preferably in 4D.”
He visited colleagues from his former laboratory at the Royal Holloway University of London to look into Digital Image Correlation (DIC) systems. The system he now uses consists of two large CCD sensors mounted above the deformation rig (see front cover image, above). The use of two sensors can capture sequential stereo pairs that will yield 3D images. Tim is now able to monitor the entire experiment, which can last up to two weeks, and produce a variety of maps such as velocity, displacement, changes in topography, and strain.
After many attempts to simulate the structures displayed on seismic data, salt modeling demonstrated how and when such structures formed and where they are likely to be found. Now, geoscientists have a better idea where to look for new traps in this and similar petroleum systems. (Source: Tim Dooley, AGL)
After many attempts to simulate the structures displayed on seismic data, salt modeling demonstrated how and when such structures formed and where they are likely to be found. Now, geoscientists have a better idea where to look for new traps in this and similar petroleum systems. (Source: Tim Dooley, AGL)
After many attempts to simulate the structures displayed on seismic data, salt modeling demonstrated how and when such structures formed and where they are likely to be found. Now, geoscientists have a better idea where to look for new traps in this and similar petroleum systems. (Source: Tim Dooley, AGL)
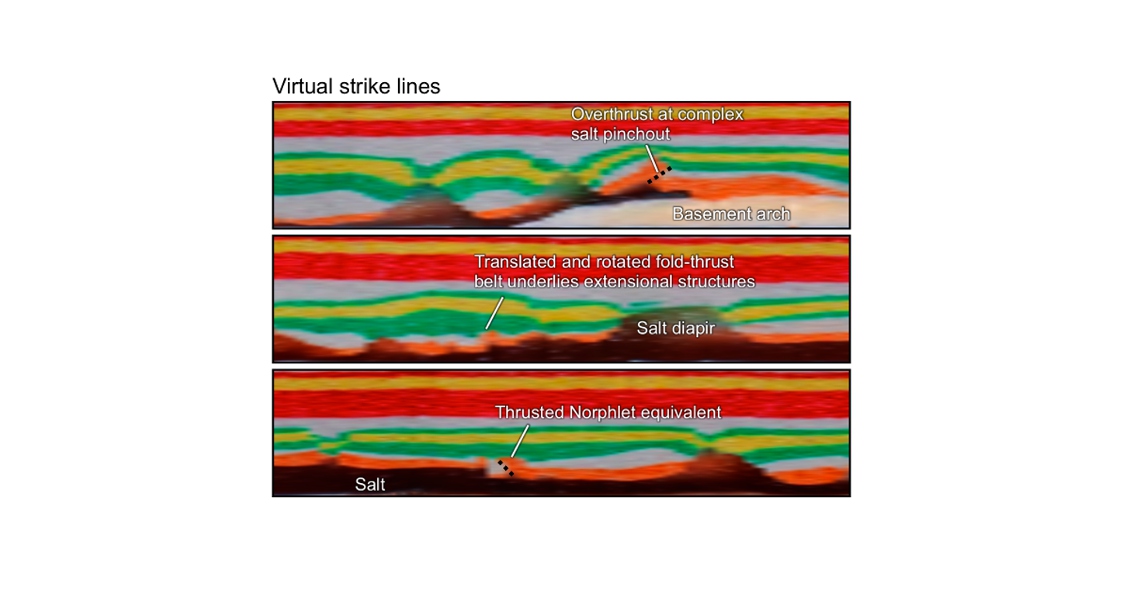
After many attempts to simulate the structures displayed on seismic data, salt modeling demonstrated how and when such structures formed and where they are likely to be found. Now, geoscientists have a better idea where to look for new traps in this and similar petroleum systems. (Source: Tim Dooley, AGL)
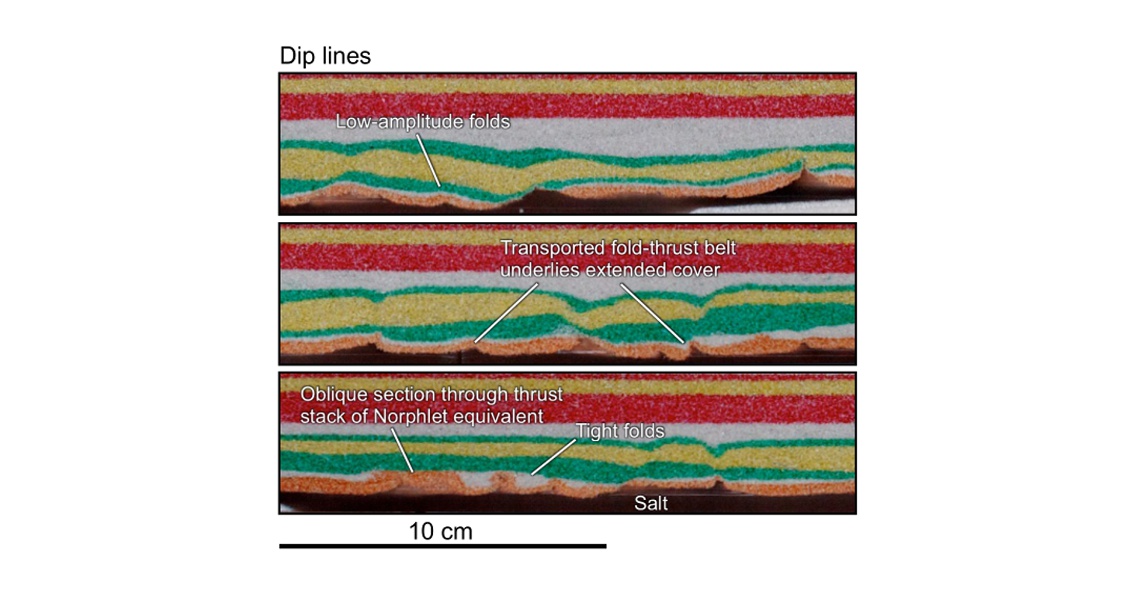
To image beneath the surface, transparent baseboards are placed in the deformation rig and a camera is mounted on the floor beneath it. “This setup allows us to continuously monitor the deformation within the salt and buried prekinematic layer,” says Tim. “Passive markers can also be inserted within the model salt to mark where the salt flow directions change over time and across topography.”
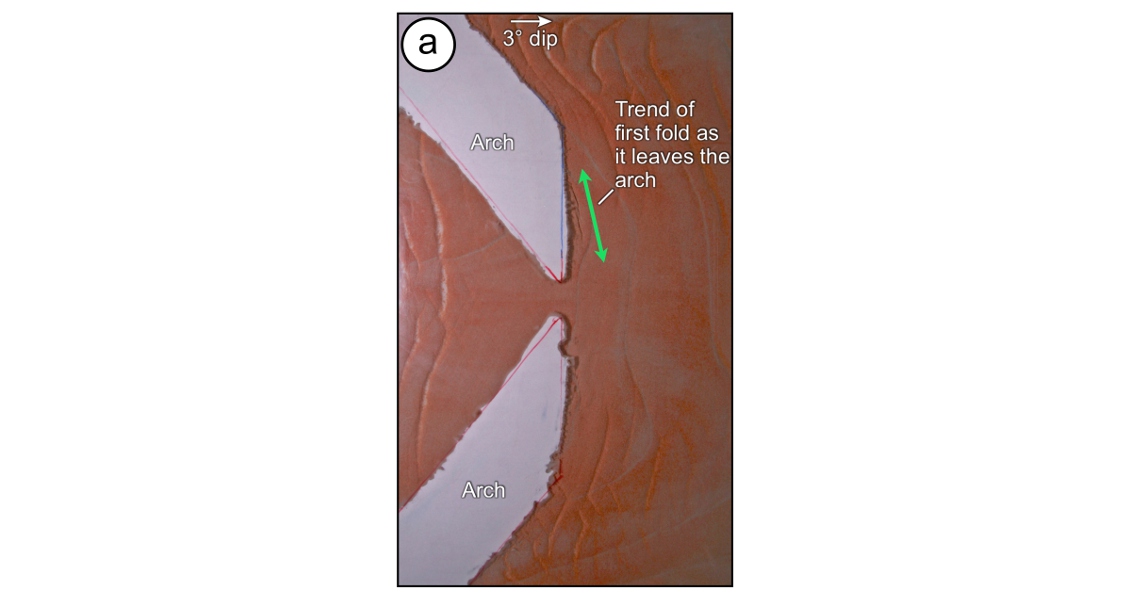
The view from the underside of the rig clearly shows the progressive rotation of folds due to divergent salt flow downdip of the arch. The displaced fold belts end up nearly perpendicular to the original fold. (Source: Tim Dooley, AGL)
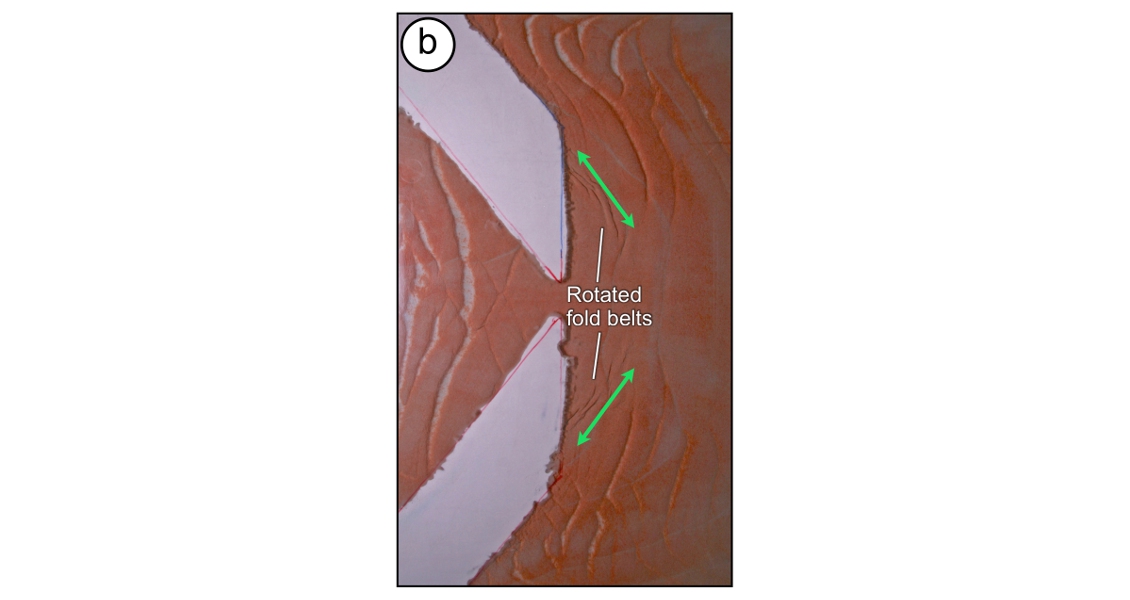
The view from the underside of the rig clearly shows the progressive rotation of folds due to divergent salt flow downdip of the arch. The displaced fold belts end up nearly perpendicular to the original fold. (Source: Tim Dooley, AGL)
The view from the underside of the rig clearly shows the progressive rotation of folds due to divergent salt flow downdip of the arch. The displaced fold belts end up nearly perpendicular to the original fold. (Source: Tim Dooley, AGL)
Solving the Puzzle
Armed with this new monitoring setup, Tim and Mike set out to see what effect basement arches have on deformation above a salt layer. “We started out simple, with arches that ran subparallel to the dip direction in the first year,” says Tim. “This produced some highly complex deformation patterns; however, the strains were never high enough to produce shortening structures. Preliminary modeling of oblique highs showed promising signs with the development of shortening structures. We decided to focus on this for the second year of modeling.” (Note: Tim works on four to five modeling series during any given year, thus most projects require multi-year efforts.)
It was in that second year, where they focused on plunging arches that were highly oblique to the direction of salt flow and mimic the structure seen on seismic data. “We started out with a simple model of a plunging ridge that extended across the entire rig,” says Tim. “This produced a field of shortening structures that gradually rotated as they traversed across and off the high block. After that experiment, we were ready to build a more complex arch array that could be compared to the situation in offshore Florida, which consists of an embayment of thick salt bounded by plunging arches with thin salt.”
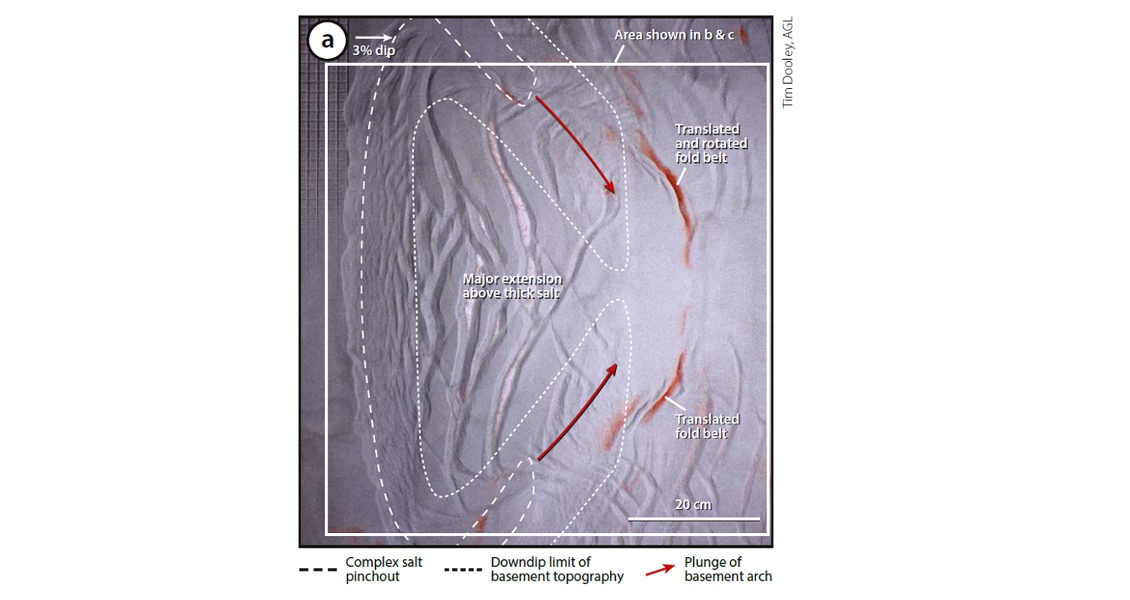
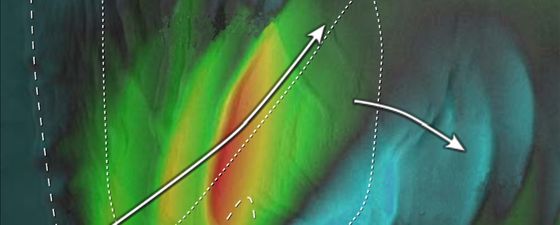
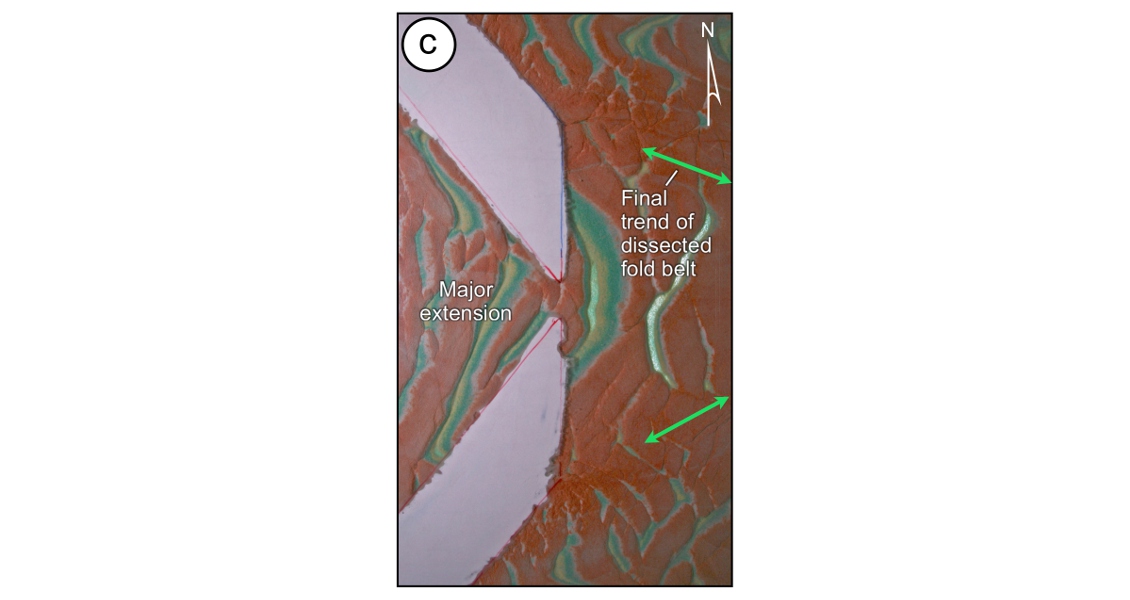
Map view of the final modeling run showing what happens to early formed structures in a gravity-gliding salt system. (a) A double plunging arch (downdip limit outlined with white dots) and rotated, displaced fold belts downdip from the arch (Source: Tim Dooley, AGL)
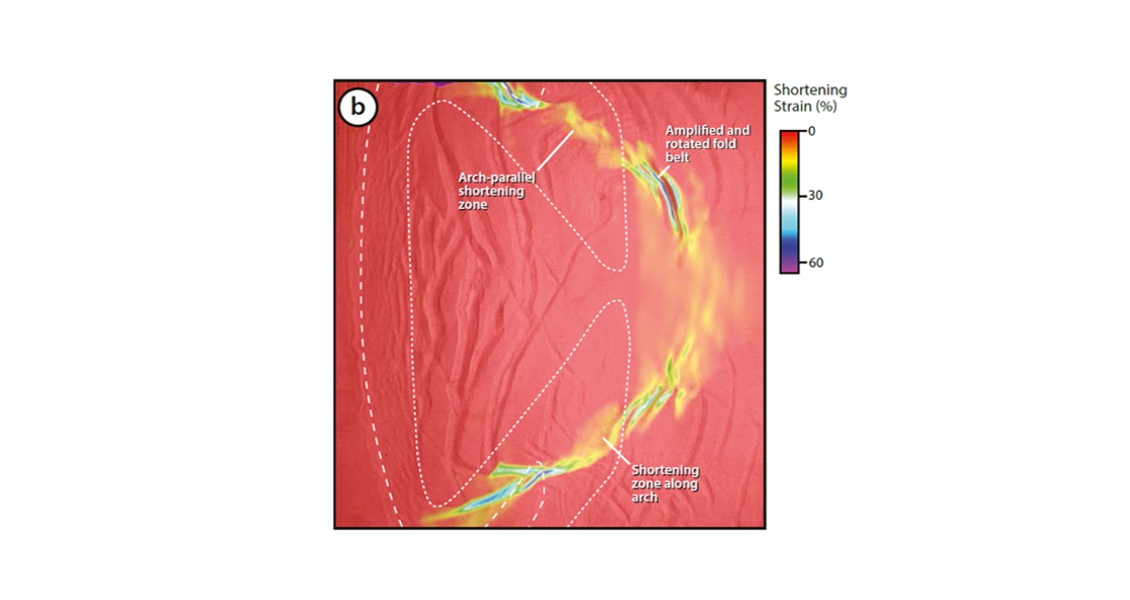
Map view of the final modeling run showing what happens to early formed structures in a gravity-gliding salt system. (b) shortening zones parallel the arch but become rotated as they are transported downdip. Source: Tim Dooley, AGL)
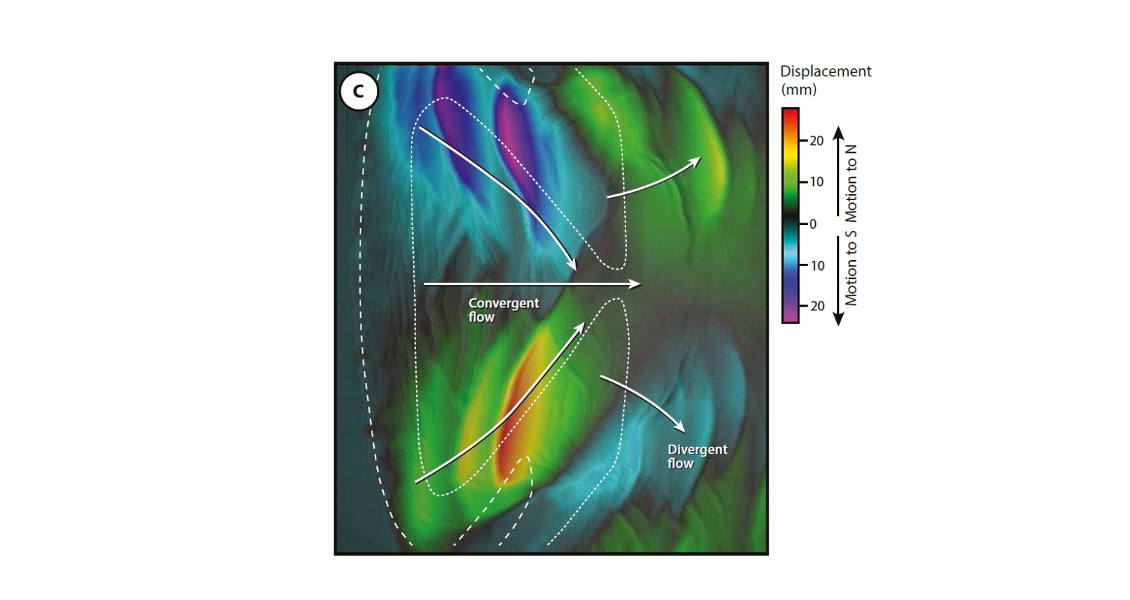
(c) salt flowing off the flanks of the arches creates convergent flow on the updip side and divergent flow on the downdip side. Convergence creates compression and shortening structures which can be carried and rotated great distances, creating a puzzling array of structures.
It took them several runs to produce a model that clearly reflected what was being seen on the seismic data. “Once we had the correct formula, the models formed shortening structures due to the variation of salt flux from thick to thin and back to thick salt as you go from the embayment onto the arch and then off the arch,” says Tim. “The DIC data was key in that it clearly showed the zones of shortening. Initially, shortening structures formed parallel to the arches and were gradually rotated into an orientation that was dip subparallel with increasing displacement, which is similar to the situation seen on the seismic data from offshore Florida. The underside camera clearly captured the rotation process once the earlyformed folds were buried under younger synkinematic sediments.”
Norphlet Petroleum System and Beyond
“The modeling illustrates that the shortening structures, and thus potential petroleum traps, can form in areas where traditional models would not have predicted,” says Tim. “A traditional view of a gravity-driven system typically predicts updip extension, a zone of translation, and downdip contraction where the salt pinches out or is buttressed and inflates by salt drainage. Our models show that basement topography and resultant changes in salt flux and flow velocities can produce shortening structures surrounded by extensional structures far updip from where previous models would have predicted. Once these structures have formed, they can be translated great distances, thus making it difficult to understand why they formed in the first place.”
In the case of the Norphlet play in the north-eastern GOM, recent studies certainly back the modeling work. In a recently published paper in Interpretation, entitled ‘Jurassic raft tectonics in the northeastern Gulf of Mexico,’ Pilcher et al. concluded: “The Upper Jurassic source rock (lime mudstones) of the Smackover Formation and the eolian sandstone reservoir intervals of the Norphlet Formation are structurally segmented and entirely contained within the raft blocks. The main episode of rafting occurred after deposition of the Smackover and Haynesville Formations and broke the Jurassic carbonate platform into raft blocks 2 to 40 km in length, which were then translated 25–40 km basinward from their original position.” Their mapping also shows a divergent rotation of individual raft blocks similar to that shown in the physical models.
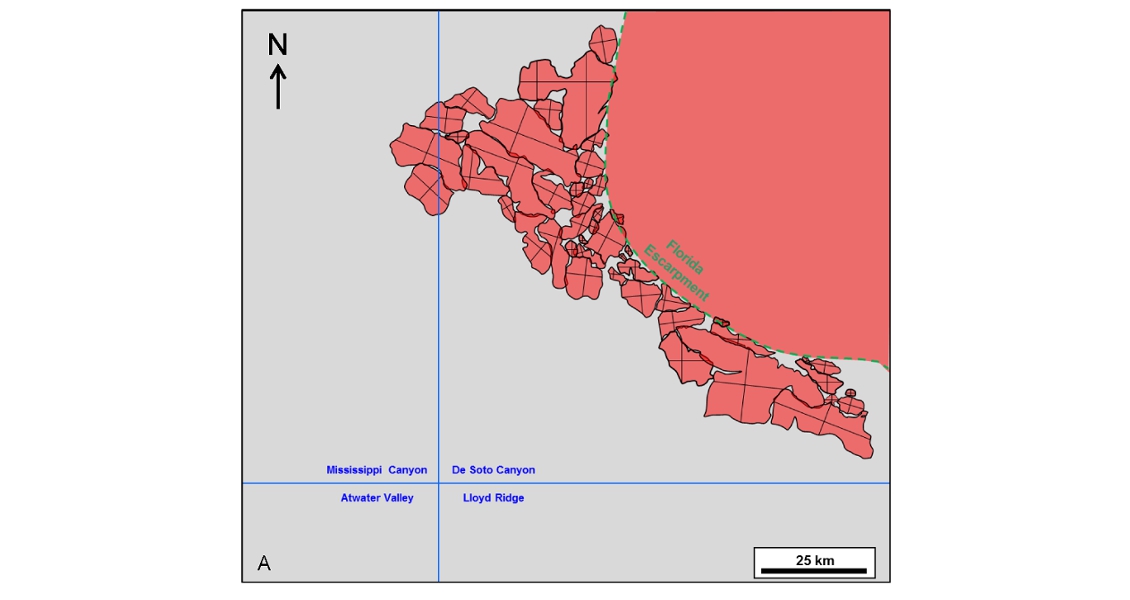
Map A shows the pre-glide and map B present-day locations of blocks in the eastern GOM. Individual blocks have been rotated and translated up to 40 km from their original positions. (Source: Pilcher, Murphy and Ciosek, 2014)
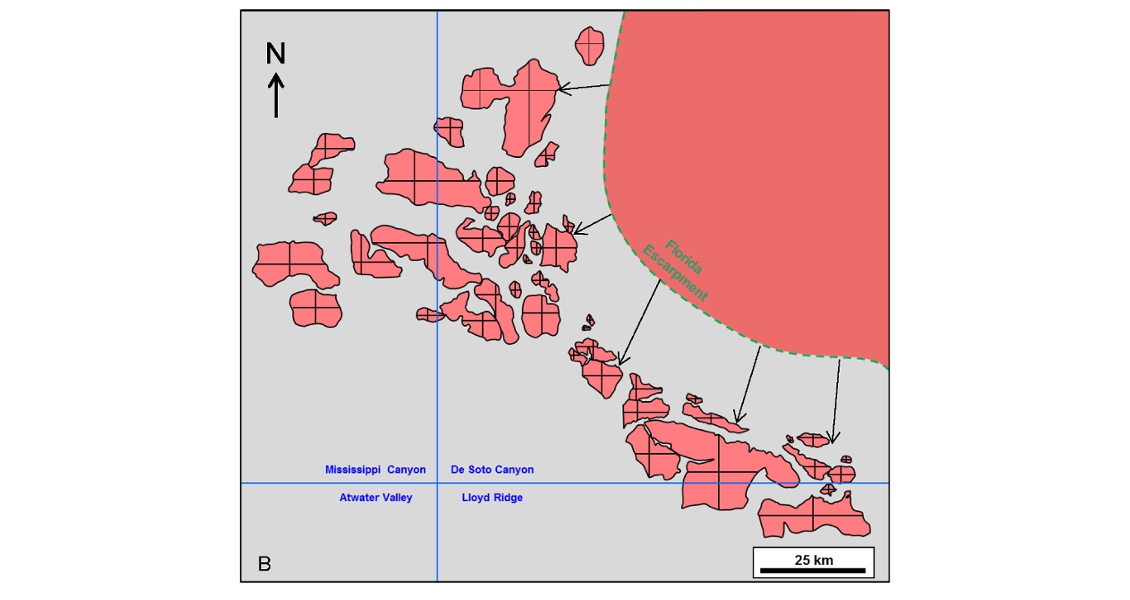
Map A shows the pre-glide and map B present-day locations of blocks in the eastern GOM. Individual blocks have been rotated and translated up to 40 km from their original positions. (Source: Pilcher, Murphy and Ciosek, 2014)
The observed structures in the northeastern GOM are similar to those found along the West African and Brazilian margins. Tim’s modeling shows that shortening structures and possible hydrocarbon traps can be formed in many different parts of a gravity-driven system and not just at the downdip buttress.
In conclusion, the modeling demonstrates two highly prospective areas of interest in these salt-driven petroleum systems: firstly, in and around complex salt pinchouts in the updip parts of the basin; and, secondly, fold belts formed due to the presence of subsalt topography that are subsequently rotated and translated far downdip of where they formed.
Reference:
Pilcher, R. S., Murphy, R. T., and Ciosek, J., 2014, Jurassic raft tectonics in the northeastern Gulf of Mexico: Interpretation, Nov. 2014, pp. SM39-SM55.
Acknowledgements:
A special thank you to Dr. Tim Dooley and Dr. Mike Hudec for their assistance with this article.