Reducing Risk in Offshore Planning and Development
Ultrahigh resolution 3D seismic methods not only bridge the gap in continuity between the shallow subsurface and seafloor, but also the gap in communication between geoscientists and engineers.
Responsible development of offshore hydrocarbon resources demands an in-depth understanding of the risks associated with shallow geohazards. These hazards include seafloor and shallow subsurface geologic features such as shallow gas and shallow water flows, mass transport complexes, shallow faulting, shallow buried channels, mud volcanoes, gas hydrates and mounds, incompetent sediments, and over-pressured zones. Particularly, as exploration and development have moved into deeper and more complex offshore settings, the potential impact of failing to understand and mitigate these hazards has increased dramatically.
Often, these failings are the result of economic factors, and the associated inefficiency of using multiple imperfect tools to produce a composite image of the intermediate depth subsurface and seafloor. Here, we propose a different strategy, utilizing the relatively new tool of ultrahighresolution 3D seismic (UHR3D) for geohazard delineation and characterization pertaining to planning and offshore development.
Legacy Geohazard Methods
Historically, the industry has widely embraced the combined use of conventional 3D seismic data reprocessed for high resolution, high-resolution 2D seismic and AUV (autonomous underwater vehicle) mounted sensor suites (such as chirp subbottom profiler, dual-frequency side-scan sonar, or multibeam echosounder) for the planning and site-specific/drilling/ installation/as-built stages of development. The AUV provides excellent, sub-meter scale, bathymetric, seafloor texture and very shallow subsurface information. However, the sub-bottom profiler is still a 2D tool with a widely variable and limited penetration in the order of 5–150m. The highresolution 2D provides a nice profile, usually down to 2 seconds or more, but these data are inadequate and potentially dangerous since any seafloor or subsurface features with cross-line dip will be incorrectly located and imaged. Moreover, the typical line spacing of conventional 2D geohazard surveys (~150m to 300m) is so coarse that the geohazards of interest may not even have been recorded, much less imaged. And finally, the reprocessed 3D, though enhanced in frequency content, is often distilled from data collected at low sampling rates and large bin sizes. Here, in many cases, significant hazards are blurred, inscrutable or simply unresolved.
The overarching problem with the above methodologies is continuity, both spatially and in resolution. None of these tools, alone or in combination, provide a complete, continuous picture from the shallow subsurface through to the seafloor. This is of paramount importance to the interpreter for accurately characterizing hazards, but almost as important, this complete picture is essential in creating the visualizations and products necessary for effective communication between geoscientists and engineers.
UHR3D provides the solution to the issue of continuity. It comprehends the 3D nature of both the seismic wavefield and the geologic features of interest, thereby enabling the accurate imaging of these features in their true subsurface locations. And, as an added benefit, this technology yields hydrographic quality bathymetry which rivals that of a ship-mounted multibeam echosounder, and is quite suitable for planning, and in some cases, development.
Gulf of Mexico UHR3D
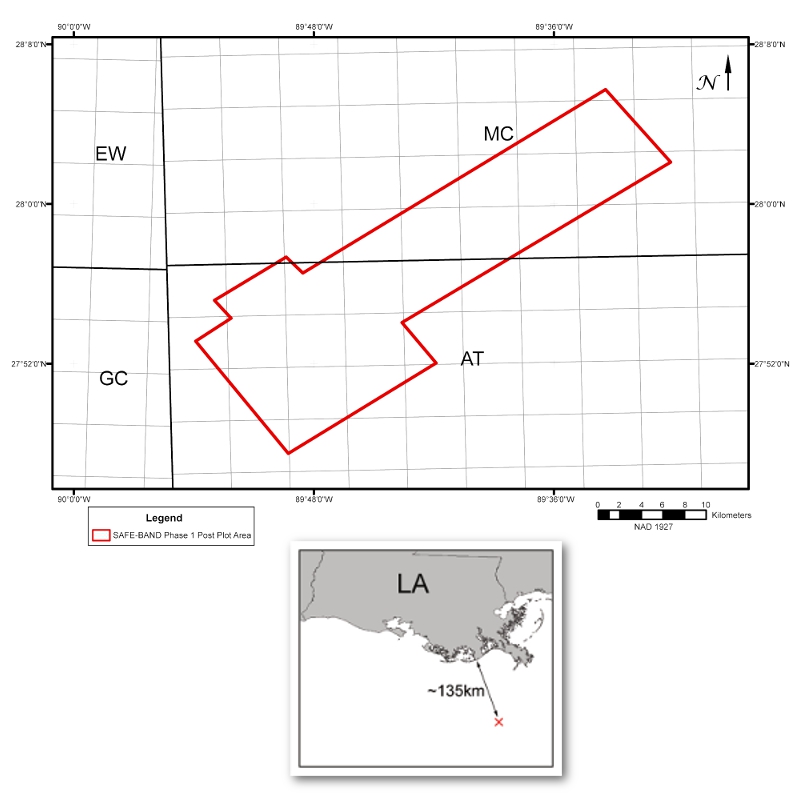 Map showing the post plot area of SAFE-BAND Phase 1 near the ‘four corners’ area offshore Louisiana along the west flank of the Mississippi Canyon.As an example of this type of dataset, a consortium consisting of NCS SubSea, Geotrace, and Spec Partners recently conducted a regional UHR3D survey in the central Gulf of Mexico near the ‘four corners’ area of Alaminos Canyon, Mississippi Canyon, Ewing Bank, and Green Canyon. This survey, known as SAFE-BAND, was acquired with P-Cable technology employing an 18 x 100m streamer spread with a group interval of 6.25m and a cross-line spacing of 12.5m. This configuration, totaling 288 receiver groups, yielded four-fold coverage at a shot spacing of 12.5m with a natural bin size of 3.125m x 6.25m. The data were collected with a 0.25 millisecond temporal sampling interval, and were later subsampled to a 0.5 millisecond interval during processing.
The fine detail that UHR3D is able to image in this complex geologic setting is particularly impressive given the limited offset range of the recorded data, which can lead to illumination issues for steeply dipping events. This offset limitation precludes the measurement of seismic velocities from the recorded data, and as a result, stacking and migration velocities must be obtained from an external source – in this case a velocity model developed by Geotrace using check shot data. The quality of the imaging results obtained using this velocity model validates the soundness of this approach and the suitability of this type of velocity data for ultrahigh resolution imaging applications.
Although processing of this dataset is still underway, preliminary time migrated results show an astonishing level of detail and clarity in imaging the shallow subsurface geology and the seafloor geomorphology. Of particular interest are the shallow faulting, shallow gas, mass transport deposits and fluid expulsion features.
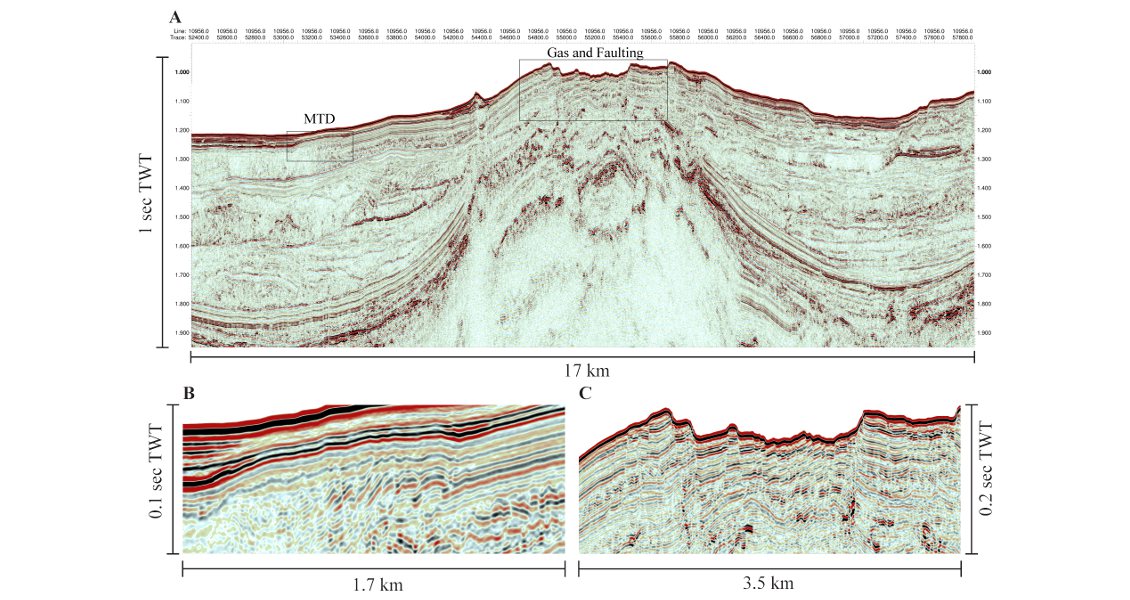
A) Representative profile from the preliminarily processed SAFEBAND Phase 1 3D cube. Two areas of particular interest are highlighted; (B) Blow-up illustrating the upper horizon of a mass transport deposit (MTD); (C) Blow-up illustrating successive faulting and graben features forming an intraslope/ collapse basin over the top of a salt feature. Note the small, discrete gas anomaly at around 1.130 seconds TWT.
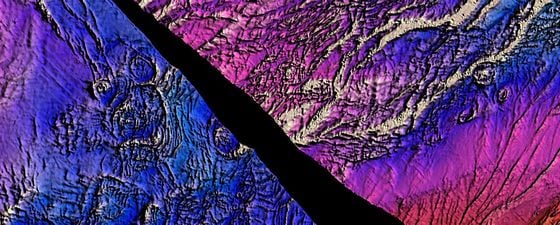
The figure below illustrates the subsurface and seafloor expressions of multiple fluid expulsion features. This figure presents five hypothetical stages of maturity resolved in the preliminary SAFE-BAND data. The two upper images (A and B) represent two portions of the interpreted seafloor horizon picked at the first zero crossing from negative to positive. These sections of seafloor lie immediately above two areas of salt diapirism, and highlight not only the fluid expulsion features, but also fault scarps and very subtle drainage pathways. From left to right, figures C through to G, represent mound initiation, rapid flux/mud volcanism, hydrate formation and free gas, exposed hydrate with nearly breaching free gas and, finally, collapse. The definitive nature and exact flux level of these features is still the subject of ongoing research. However, these features certainly present a multi-faceted engineering concern in regard to both seafloor stability and gas-charged, over-pressured subsurface zones. In addition to the engineering concerns, the seafloor geomorphology expressed here is almost certainly prime habitat for chemosynthetic communities which must be avoided. Accurately delineating and characterizing this type of feature, and the wide range of variability, is critical for successful subsea planning and development.
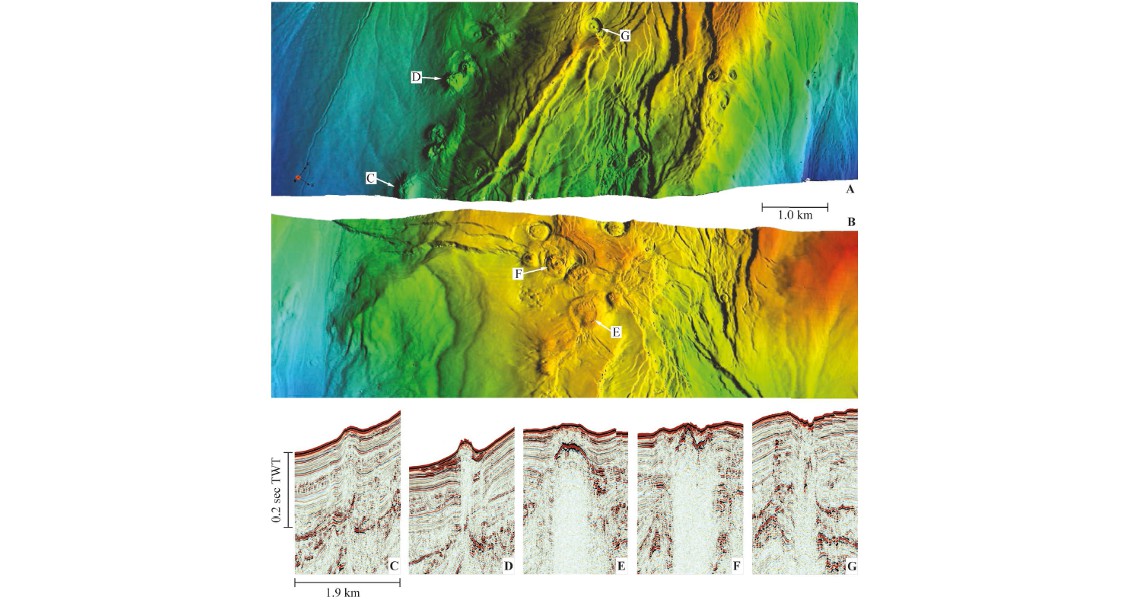
A, B – Portions of the interpreted seafloor horizon taken from the south-west (A) and north-east (B) portions of the SAFE-BAND Phase 1 area. Area A corresponds to the salt feature shown in the seismic image above. Five features are profiled below: C – Expulsion mound initiation. D – Rapid flux/mud volcanism. E – Hydrate formation and free gas. F – Exposed hydrate with nearly breaching free gas. G – Collapse feature.
Economic Benefits
Beyond the scientific merit of this technology, economic benefits also come into play. The acquisition costs of UHR3D are roughly equivalent to deepwater AUV acquisition or conventional 2D high resolution seismic acquisition. There are many scenarios, especially in the planning stages for lease acquisition, well placement and pipeline routing, that sub-meter scale, AUV-acquired, hydrographic data is overkill. However, the sub-bottom penetration is insufficient to illuminate the subsurface hazards that may pose an eventual failure risk. In these cases, such as intermediate to deepwater pipeline route assessment surveys, UHR3D may be the perfect and most economical tool. As opposed to the combination of AUV and 2D seismic data, UHR3D provides a three-dimensional swath of coverage penetrating to well beyond the depths necessary for successful assessment of route viability. The relevance of UHR3D for such applications is infinitely enhanced by the availability of real-time binning and on-board, near real-time geophysical QC and preliminary imaging products such as near trace gathers, brute stacks and seafloor arrival to echosounder reconciliation. With these products available, the client representative, party chief and lead geoscientist can make on-the-fly decisions about further route development while on site. And, given the swath coverage of UHR3D, the route development can be undertaken efficiently and with minimal further passes beyond the initial route corridor.
The same concept of practical and economic suitability also applies to large-scale lease surveys in intermediate to deep water. Here again, AUV level hydrographic precision is costly, unnecessary, and does not paint a complete picture, requiring the addition of reprocessed 3D and/or highresolution 2D seismic. In this scenario, UHR3D can provide all of the data necessary for planning, and in many cases, can take the place of further AUV and 2D seismic surveys often necessary for development. UHR3D data also provides a complete, 3D regional perspective allowing for easy correlation between successive well locations.
Currently, there are very few major operators reaping the benefits of UHR3D. However, as more geoscientists and engineers are exposed to this type of data and the communication it fosters between them, the tide will ultimately turn, and UHR3D will become the norm. There is no substitute for the continuity of data and fit for purpose applicability that this technology provides. And, where safety and environmental considerations dramatically influence the bottom line, how can one afford not to make an investment in UHR3D?