Mapping sub-salt and sub-basalt structures from magnetic and gravity data
The acquisition of modern high-resolution airborne magnetic and gravity data has revolutionized the use of potential field methods in oil and gas exploration. Archimedes Consulting is one of the companies at the forefront of these new techniques.
The combination of more sensitive sensors, especially the introduction of the caesium vapour magnetometer, together with multi-component sensors, closer flight lines, lower altitude, and more stable flight paths afforded by differential GPS guided flights, means that the quality of airborne magnetic and gravity data has significantly improved and the quantity of data acquired has multiplied by orders of magnitude. Within these data sets there is significantly more information which must be extracted to achieve full value from the survey.
Innovative processing and interpretation techniques, with resolution and detail far superior to traditional approaches, are now routinely being applied in the petroleum industry to more focused areas where seismic is not of good quality or simply not available.
These techniques can add significant value to the results of high-resolution magnetic and gravity surveys for petroleum exploration. As well as the conventional processes such as reduction to the pole, Bouguer correction, and depth to basement, new methods and techniques can be applied to the interpretation of the data.
Of special note is the value that these techniques can play in areas where seismic data is either non-existent, very expensive or difficult to obtain, or of very limited value due to the geology of the area. Sometimes seismic results can be as disappointing where the presence of important features have been masked by an area of extensive thick salt, and these may be elicited by the techniques described here.
Two of the newest techniques which can be applied to the interpretation of the data are Energy Spectral Analysis and Automatic Curve Matching.
Energy Spectral Analysis: Mapping Hard-To-See Horizons
Energy Spectral Analysis (ESA), with related filtering and required transformations, is a method used in mapping geological horizons and trends from gridded magnetic or gravity data sets. The application of ESA involves using a moving window (ESA-MW) technique, combined with a Multi-Window Technique (ESA-MWT) to detect and map horizons such as basement, shales, carbonates, salt and basalts.
ESA applied to magnetic or gravity grid data allows calculation of an average depth to ensembles of the causative bodies. The depth is calculated from the slope of the linear segment of the spectrum graph, as depth is a function of the decay of the spectrum function within a corresponding frequency interval. A plot of the logarithm of the radially averaged energy spectrum versus the radial frequency from gridded magnetic or gravity data shows the decay of this function, which indicates depth to the modeled prism. These depths are unique and are not dependent on assumed or measured susceptibilities or densities.
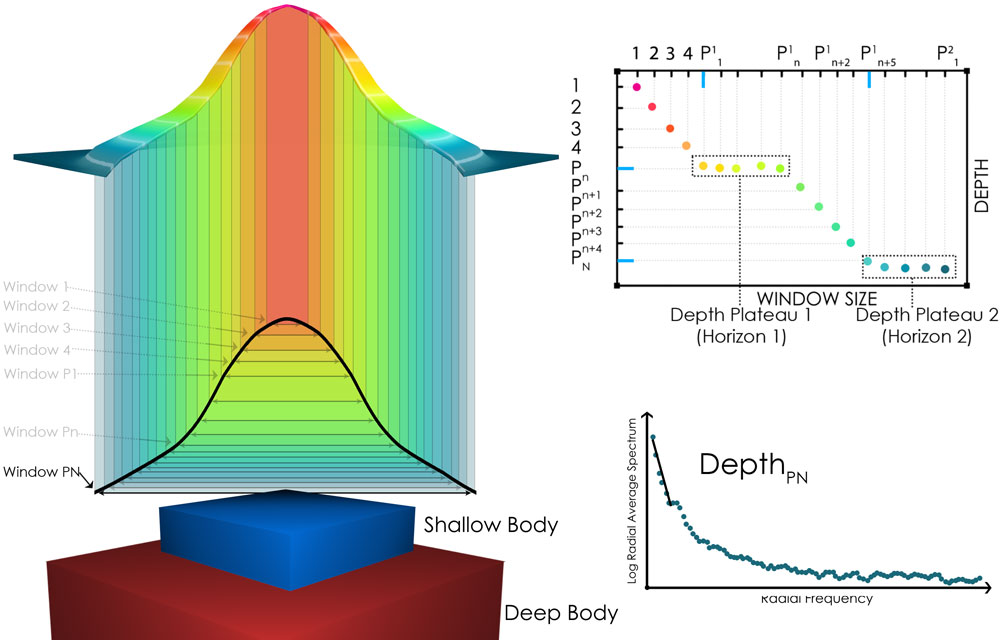
The main features of the ESA methodology. Two simple magnetic ensemble bodies are represented, a smaller blue body, atop a deeper and larger magenta body. The two result in a combined magnetic field, shown as the bell-shaped curve above. Energy spectra generated across this field are computed with the window centred over the bodies, and with a size that starts small relative to the extent of the overall anomaly, and is incremented step by step to be large relative to the field. An individual spectrum is depicted in the lower right, where a section of spectra displays the distinctive straight segment in the decay that occurs when a strong magnetic ensemble exists. The slope of the segment is directly related to the depth of the body. The plot at upper right depicts the plateau effect: as the window is enlarged, the depth detected by the spectral method simply falls as a function of window size. When the window is large enough to detect bodies at the depth they lie, the detected depth stabilizes and a plateau of depths becomes evident. Once the window is significantly larger the depth drops again as the window increases in size, and the plateau ends. Source: Archimedes Consulting
The areal extent of the subset of data analyzed (the window) limits the maximum depth being investigated. For a given horizon depth, there is an optimal window size that detects the horizon with the least noise, and greatest stability. To determine an optimal window size, the window size is varied over the same location. For each window, the spectrum is computed and the depth interpreted. As an optimal window size is approached, the increasing window size detects depths which cluster around the same value; such clusters are termed depth-plateaus.
Depth-plateaus correspond to the interfaces between magnetic or gravity interfaces (surfaces or sources), where contrasts exist. Contrasts may be in magnetic susceptibility for magnetic data, or density for gravity data. Depth plateaus can indicate the presence of a crustal inhomogeneity, that may correspond to the basement surface, an unconformity, or the top of an intra-sedimentary lithological boundary. Window sizes are chosen to focus on different depths of investigation; small windows target shallow depths, as the shallow sources produce high frequency anomalies, and larger windows target greater depths with the deep-seated bodies generating long wavelength anomalies. Analysis may find two or more plateaus at the same location, which implies two or more superimposed sets of anomalies, indicating multiple geological interfaces, such as the base of salt, basement horizon, or base of basalt.
A Credible Model
The analysis window may be moved around the data set to build up a skeleton depth-grid of the interpreted horizon. The process begins with an initial low resolution interpretation (with sparse points of analysis) to establish a credible geological model. The results are then gridded and mapped for quality control, including comparisons against other geological or geophysical information, such as well or seismic data. This process is necessarily more expensive, as a very large number of spectra are analyzed, involving significant human effort.
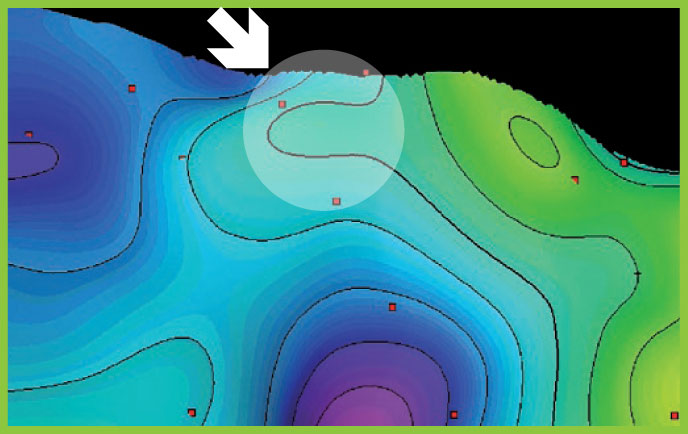
Skeleton Analysis: A horizon found from a skeleton analysis, from a prospect in the Middle East. Red points denote the locations where analysis has been done. The circled area shows a possible nose structure which may be connected to the anticline to the right. Source: Archimedes Consulting
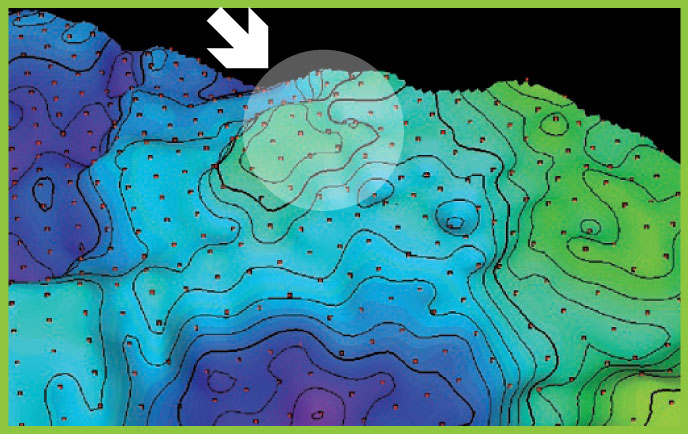
Detailed Analysis: High resolution detailed mapping shows the structure in the skeleton anaylsis is actually separate, and has a higher likelihood of being a structural trap. Source: Archimedes Consulting
Once a skeleton grid is created, it is possible to in-fill the grid to a higher resolution to produce a high resolution detailed map of the surface. Although still requiring significant human effort in interpreting spectra, the skeleton grid can be used to provide guidance to limit the amount of work required, and thus the in-fill operation is tractable. High resolution interpretation is, however, dependent on the line spacing of the acquired data. The objective, independent depth solution obtained from the spectra decay and this high density analysis (fine depth-grid) is what differentiates the Archimedes approach and produces the final high resolution map of the geological horizon.
The same process is repeated for the deeper horizon or lower frequency anomalies, indicated by presence of the second plateau. The final product, a structural depth map of the horizons, is produced.
The detailed approach (fine depth-grid) distinguishes the new methods from conventional modeling techniques. They seek to extract the full high resolution information gathered in the acquisition phase in the processing and interpretation phase. Greater effort produces higher resolution results.
Tap image to see a movie that depicts a number of labeled horizons mapped by Energy Spectral Analysis, as described in the text. Source: Archimedes Consulting
Automatic Curve Matching: Identifying Anomalies
00:00
01:08
Profile Extraction: The ACM ProcessAutomatic Curve Matching (ACM), another new technique pioneered by Archimedes Consulting, is applied to the original magnetic flight-line data and profile data. This method works by identifying a magnetic anomaly on a profile, comparing the unique sets of components of the observed anomaly with one that is computed for a theoretical prism, plate, or edge model, then varying the model’s parameters, finally choosing the solution which provides the best fit to the observed data.
For example, fault interpretation can be undertaken using ACM, by analyzing each magnetic anomaly along a flight line or profile extracted from a gridded Total Magnetic Intensity (TMI) field in a purely automatic manner.
The ability to identify faults can be affected by several factors including the extent of magnetization along the fault plane and the contrast in magnetic susceptibility of the rocks on either side of it. These factors can make identification of both non-mineralized and mineralized faults possible. When the ACM results from all the profile directions supports the presence of a fault, and the lineaments can be correlated laterally and at depth, a fault plane can be gridded in 3D.
This approach to the interpretation of high resolution aeromagnetic data allows the detection in 3D of faults, associated structures and even fracture patterns within different sedimentary formations, as well as the underlying basement. These techniques extract the maximum information and deliver a detailed interpretation to aid in further exploration and development.
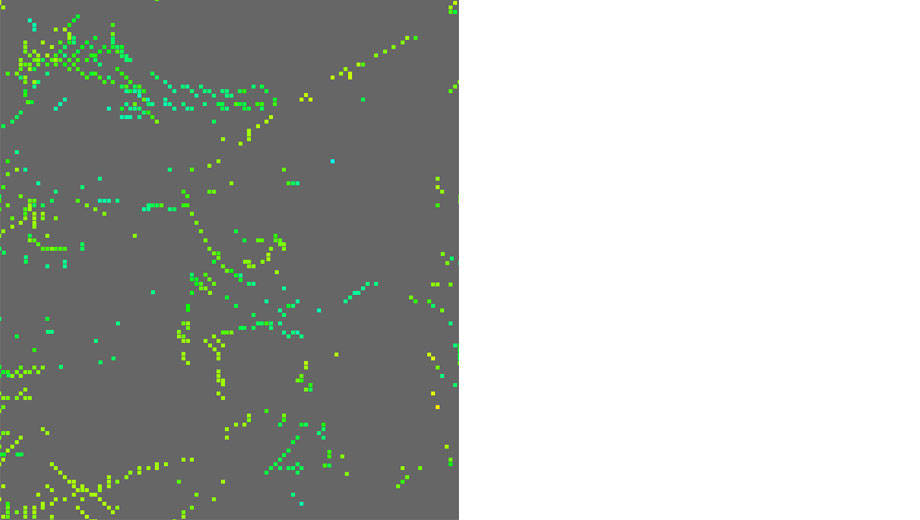
Magnetic Bodies Identified by ACM. Source: Archimedes Consulting
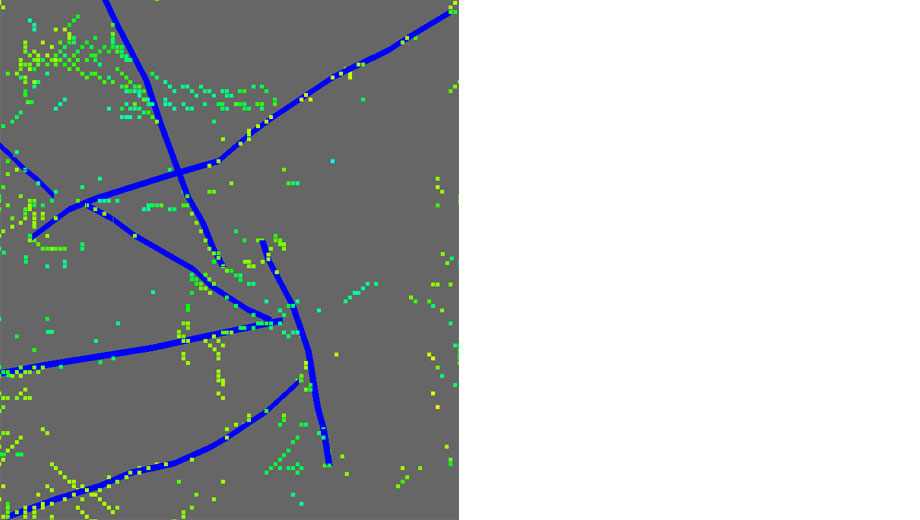
Magnetic Bodies with Interpreted Lineaments. Source: Archimedes Consulting
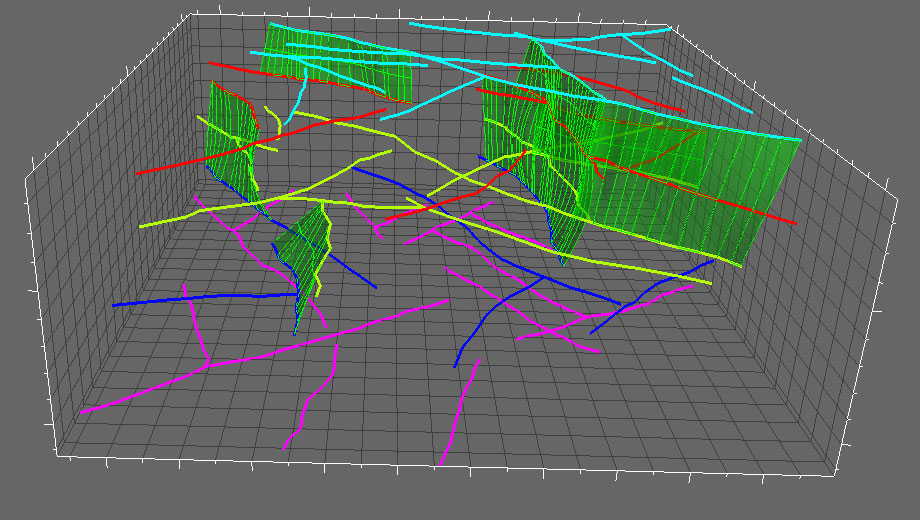
ACM Results of the Project in 3D. Source: Archimedes Consulting
Imaging Sub-Salt Geology Using Magnetic Data
A rift basin with known hydrocarbon potential was investigated in order to image the basin structure and identify potential leads. Despite extensive reprocessing of available 2D seismic, the presence of thick evaporite sequences throughout the area hindered any clear understanding of the sub-salt basin architecture. Therefore, the application of other techniques was required in order to image structures below the salt. Archimedes was engaged to image the base of salt and the basement horizon and to delineate fault patterns within the area of interest using magnetic data.
Archimedes employed the Energy Spectral Analysis – Moving Window (ESA-MW) method to image the base of salt and basement by detecting the depth-plateaus that correspond to these horizons. These depth-plateaus then determine the optimal window size to scan the whole area using ESA-MW.
Final results from ESA-MW horizon interpretation are shown below. The mapping of these surfaces provides an insight into the structural trends of the area. The base of salt horizon with its relatively simple monoclinal dip is in contrast to a more structurally complex basement horizon. The magnetic results clearly show that the sediments below the salt vary considerably and are highly influenced by the basement architecture. The ability of delineating closed structures below the salt is enhanced.
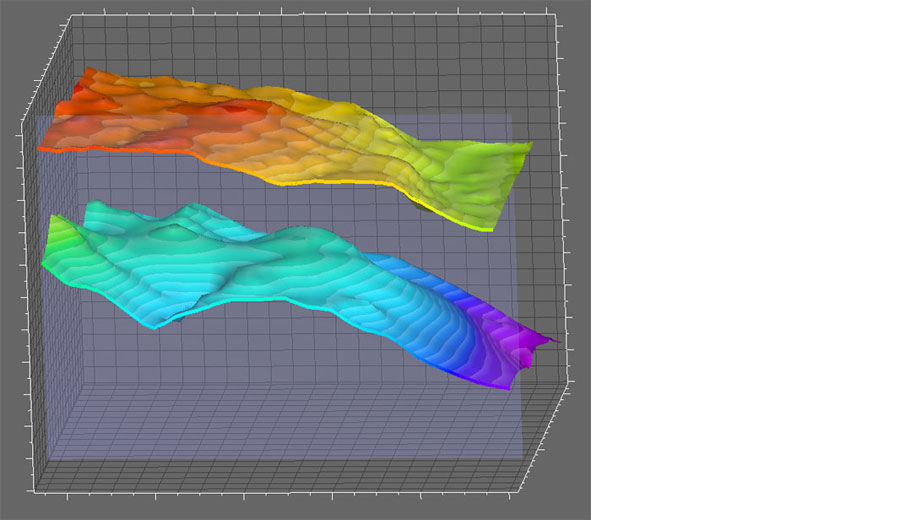
Final results from ESA-MW horizon interpretation. Source: Archimedes Consulting
Automatic Curve Matching results give a clearer understanding of the basin architecture. Source: Archimedes Consulting
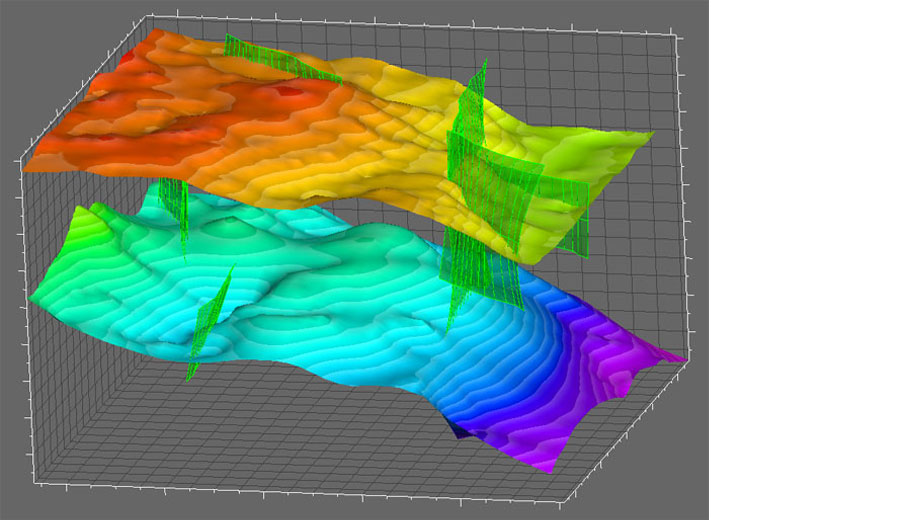
Once both horizons and fault planes are mapped, the interpretation is integrated into a 3D model, where structural correlations between the two can be observed. The horizons and structures in the integrated model form the basis for the final quality control process. Forward modelling and inversions are used to validate the interpretation against observed potential field data that has been filtered to, for example, remove higher frequencies from shallower sources. Further, any additional information that may be available for the area (such as seismic or well data) can be used. This ensures both a credible geological interpretation, and one that agrees with the known data.