Pressure Prediction in Exhumed Basins
Predicting pressure in basins that are exhumed or contain rich source rocks is difficult. We look at a case study from the Barents Sea region.
The dominance of gas over oil in the Norwegian Barents Sea has been one of the major factors in slowing the development of the region. The lack of oil has often been attributed to the exhumation and erosion during Cenozoic times that affected the Norwegian barents Sea, removing as much as 2,500m of sediment. For example, during exhumation the cap rocks could have fractured over large areas, allowing oil to escape from the reservoir rocks below them. At the same time the decreased pressure from above allows dissolution of gas from the oil, while the expansion of the gas forces the oil out of the reservoirs.
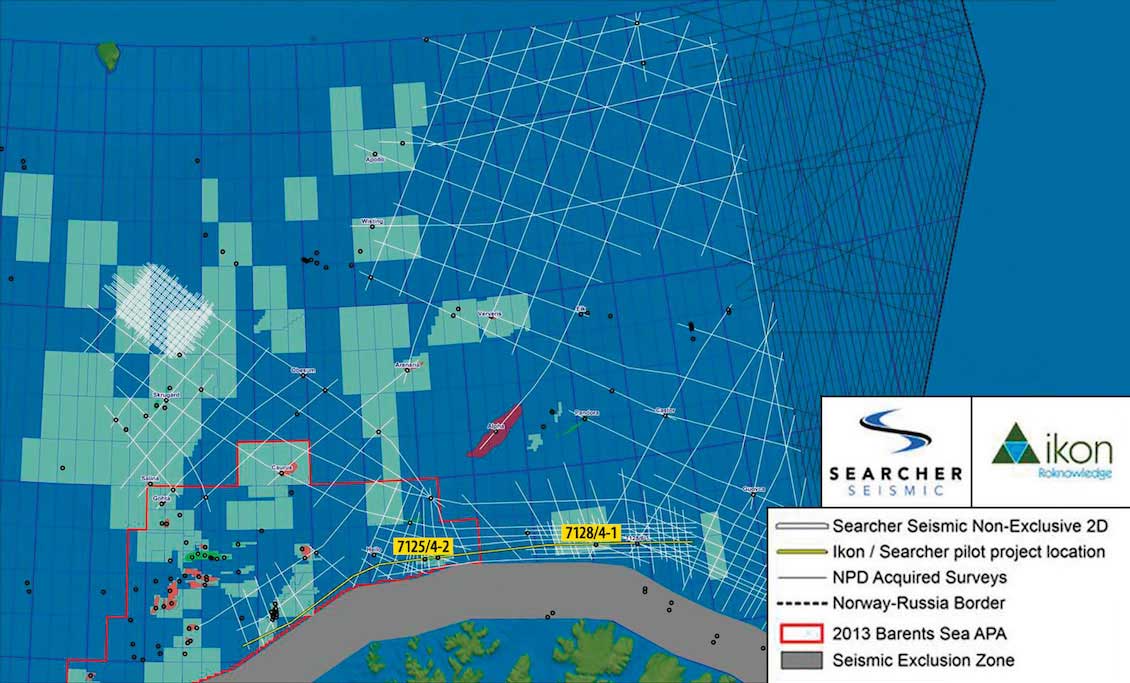 Figure 1: A series of 2D lines extending west–east towards the Norway/Russian boundary. These data have recently been derived by Searcher Seismic, Perth, as part of an acquisition process in the Barents Sea in 2013.Fracturing of cap rocks (as opposed to membrane leakage) is, at least in part, due to elevated pore pressure. The potential of high pore pressure also becomes a drilling risk, bringing uncertainty into the selection of a mud weight programme and influencing well design. Therefore, a full understanding of the pressure regime becomes a prerequisite for exploration in the Barents Sea, both for planning new drilling and for understanding the effects on trap failure and petroleum migration.
This article presents a series of steps giving an integrated approach to pressure prediction in the East Barents Sea. Multiple techniques and data types are used to predict pore pressure, including seismic amplitudes, provided by Searcher Seismic (to visualise structure and unconformities); Apatite Fission Track data (AFTA) (to understand exhumation history), supplied by GeoTrack, Melbourne; and log data and drilling reports to understand well histories. This is the first stage before seismic interval velocities can be used to predict pressure along 2D lines of seismic velocities that will over time extend into the Russian Barents Sea.
Step 1: Seismic Acquisition
The first stage is to acquire the seismic data to aid visualisation of the chosen area, which is the Finnmark Platform (Figure 1).
Step 2: Understanding the Geological History
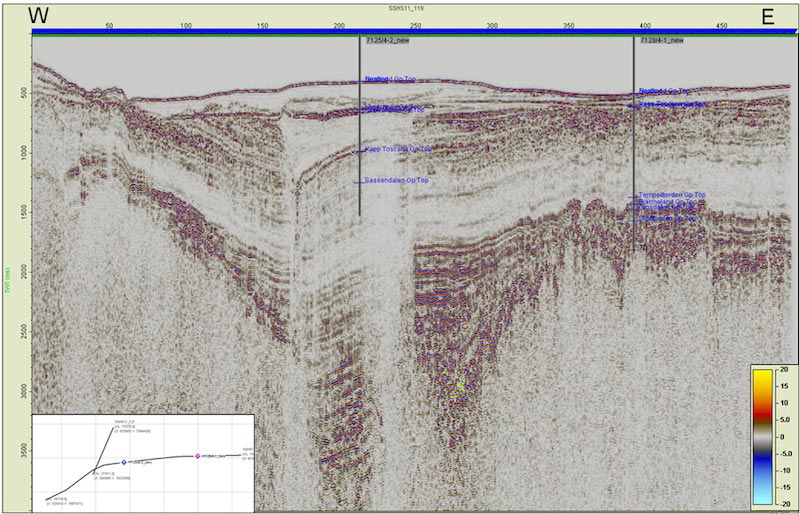 Figure 2: A seismic line running west–east from the recent Searcher Seismic survey of the East Barents Sea. Two key wells, 7125/4-2 and 7128/4-1, are shown.
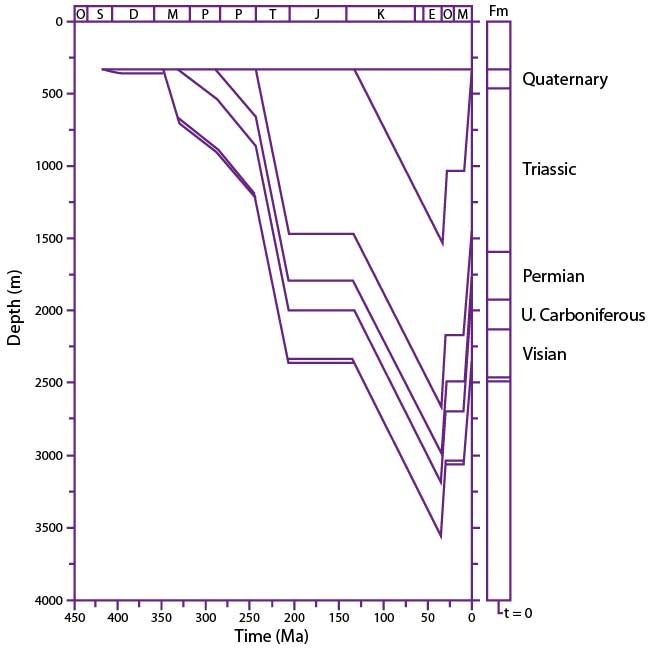 Figure 3: Possible burial history reconstructions consistent with the the thermal history reconstruction in well 128/6-1.Figure 2 shows the seismic amplitudes and the structural positions of two wells, 7125/42 (Masøy Fault Complex) and 7128/41 (Finnmark Platform). The 7125/42 well lies in a more basinal position and is dominated by Jurassic/ Triassic sands and shales and contains the main Barents Sea source rock (Hekkingen Formation). The 7128/41 well is in a structurally higher position, and penetrated the Permian carbonates, shown in Figure 2 as the strong reflectors, and the Carboniferous including coal horizons beneath. A pronounced unconformity is present in the shallow section. The stratigraphy at the unconformity in each well suggests relative exhumation by 300ms or approximately 400m.
To the east of 7128/41, not shown on Figure 2, lies a dry hole, 7128/61. Using a combination of AFTA and Vitrinite Reflectance (VR) data, it has been possible to reconstruct the burial history of this well (Figure 3), and doing so gives us an understanding of the exhumation on the Finnmark Platform. Exhumation is represented as erosion of 1,200m of section on the unconformity at the top of the Triassic beginning at 35 Ma. This erosion is shown to have occurred in two episodes with 500m eroded 35–30 Ma and 700m eroded between 10 and 5 Ma. This was followed by only minor reburial of several 100s of meters (200ms TWT on Figure 2). Therefore, from the assessment of exhumation, the 7125/42 well has been much less affected, i.e. is closer to its maximum burial depth and has some source rock preserved.
Knowing the geological context of these wells is an important step for pressure prediction. overpressure distribution is governed by fluid retention and hence an understanding of pressure loss from sequences is critical in understanding how overpressure builds up and dissipates (Yardley et al., 1995). For all realistic permeability and seal thickness, all pressure would dissipate in less than 1 Ma. Deming (1994) concluded that to maintain pressure over geological time requires nano darcy permeability. These shales are unlikely to have permeability of this magnitude.
Step 3: Pressure Prediction
In porous intervals such as the Lower-Middle Jurassic Stø Formation in the Hammerfest Basin, direct pressure tests can be used to measure reservoir pressures. This is not possible in impermeable lithologies such as shales. The challenge therefore is to reconcile pressures that are measurable with those that have to be inferred from rock properties in shales. A set of standard techniques exists for this latter task, which rely on detection of anomalously high porosity for depth of burial, whereby porosity is preserved at depth in shales as pore pressure increases. Data used to detect this porosity include sonic, density and resistivity log data as well as seismic interval velocity. These data are compared to those values expected at a given depth assuming the rocks are normally compacting with hydrostatic pore pressure, which is much more complicated if the rocks are not at their maximum burial depth. This is the case in exhumed basins such as the Barents Sea, where up to four phases of exhumation are possible, depending on the area (Green et al., 2004; Green and Duddy, 2010).
The key factor to successful prediction of shale pressure is to understand what processes are causing the pressure in the first place as this dictates which algorithm to use. One technique to identify these processes is to crossplot log Vp and rho data. What if the shales were affected by fluid expansion caused by gas? Gas generation and its expansion during exhumation could have occurred and this can significantly increase pore pressure. The main source rock in the Barents Sea is the Hekkingen Formation; however, the earlier analysis shows that on the Finnmark Platform this formation is largely eroded. Gas in well 7128/41 must have therefore migrated in. On the Finnmark Platform, Triassic source intervals are too shallow to generate hydrocarbons (Ohm et al., 2008), and the Permian Ørret Formation is only oil mature in a zone fringing the Loppa High and along the rim of the Finnmark Platform. Therefore gas is only likely to have affected pressures in 7125/42.
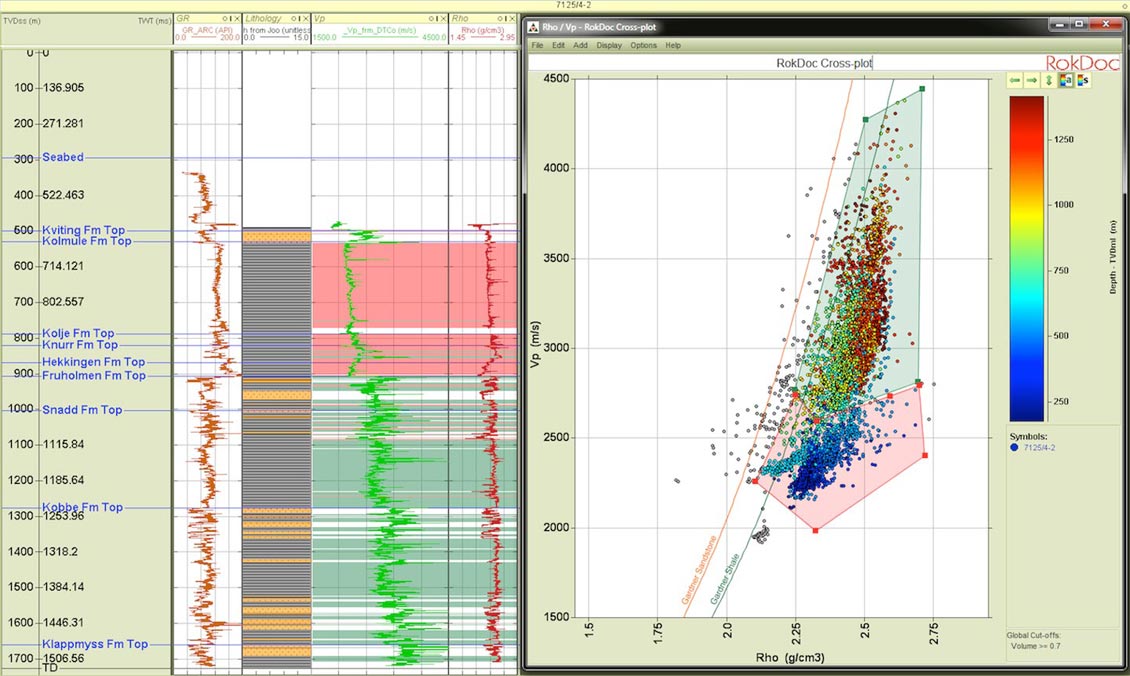
Figure 4: Vp/Rho cross-plot from well 7125/4-2. Only shale data is plotted as defined by a Vshale cut- off (green line is Gardner Shale). Two shale populations are suggested. Overall, the data is parallel to the Gardner, suggesting disequilibrium compaction or normal compaction is present. Red shale data plots at higher density for a given velocity. This could be lithological or imply diagenetic changes in the shale, reducing porosity.
In this well, evidence from the Total gas Analysis (%) shows increased levels through the source rock interval as well as in the Triassic shales, suggesting that there is gas in the system. Crossplotting Vp/rho shale data suggests there could be two populations of shale. Logs have a distinct break at this depth, perhaps related to a discontinuity. An overall trend parallel to the Gardner shale for the Jurassic and Triassic shale is suggested with no evidence for fluid expansion. There is a deviation off the trend in the deep Triassic shales (to higher density for a given velocity) and this is associated with density of 2.5 g/cc, i.e. low porosity. This deviation may reflect some chemical change in the shales, reducing porosity. This process can result in additional overpressure in other basins but the effect here is minor as the reduction in velocity is small. The overall interpretation is that the process of overpressure generation is disequilibrium compaction despite the low porosities in deep shales. This approach of using crossplots is summarised in Swarbrick (2012).
Figures 5 and 6 show that in the shale intervals, the Vp and Rho logs are steadily increasing in magnitude with increasing depth. This is also true of the checkshots in 7125/42. This suggests that the shales are either normally compacting or have only small magnitudes of overpressure. In the first main shale package in 7125/4 2, Vp and Rho show sharp cutbacks, particularly at 800 to 900m TVDss. This interval corresponds to the Hekkingen Formation which is the source rock. These low log values can be interpreted to be elevated pore pressure, whereas, in fact, they represent a lithology effect. Interestingly, the deep resistivity tool seems to show a general reduction through this package, which could be interpreted as some pressure. Another lithology effect can be seen in 7128/41 in Figure 6. The Carboniferous interval has inferred high pore pressure. This is due to the ‘soft’ coals present.

Well data 7125/4-2. Blue line = hydrostatic gradient: Red line = overburden. Black line represents the normal compaction curve. Vp, density and resistivity logs are displayed as well as pressure interpretation (Vp green, check-shots blue). The first shale package is the source rock Hekkingen Formation.
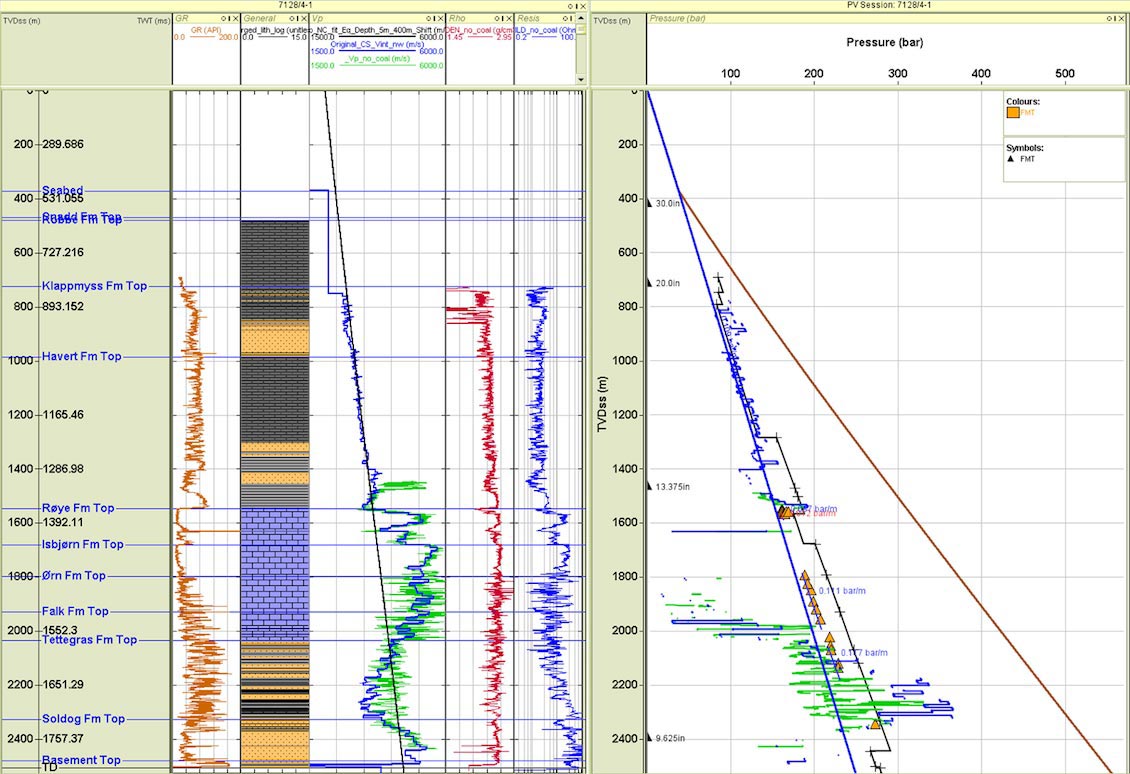
Figure 6: Well data 7128/4-1. Yellow triangles represent direct pressure tests in porous units. Fluids are interpreted. The source rock is absent here due to more significant exhumation. Note the very fast carbonate lithology – this is another added complication for pressure prediction in East Barents as carbonates do not have a porosity/effective stress relationship so cannot be modelled in the same way as shale using remote data such as seismic velocity. Note lithology effect of the Carboniferous coals giving inferred pore pressure
Assuming disequilibrium compaction is considered primary, a velocity/effective stress relationship can be derived, and pore pressure can be calculated by solving for the Terzhagi (1934) equation. These interpretations for pressure in the shales are shown as the green profiles on the Pressure Depth plots in Figures 5 and 6. Checkshots in 7125/42 are also used to produce a profile for pressure (blue profile). A single velocity/effective stress trend is used and based on a normal compaction relationship shown on these figures as the black line. This approach highlights the difficulty of predicting pressure where source rocks are present, as the Hekkingen Formation interval is inferred to have some overpressure. A single trend line for compaction therefore may not be sufficient where source rocks are present; that is, a second relationship is potentially required as the pressures in this interval may not be ‘real’ but rather caused by organic content in the shales making them slower (Passey, 1990). A possible solution is to use Vs data which will not have the gas effect. However, as a first approximation this single model matches well history (and our geological prediction that the unconformity would let all previous pressure bleed off). Pore pressure has to be less than mud weight, as there are no well control problems such as kicks when thin sand units are present in the shale packages.
Looking Forward
The approach featured in this article highlights just how difficult predicting pressure is in basins that are both exhumed and/or contain rich source rocks such as those in the Barents Sea region. Unconformities allow time for pressure to return to hydrostatic. These discontinuities may also require multiple compaction models and velocity/ effective stress relationships in order to successfully predict pressure. Velocity logs, and therefore by implication seismic interval velocities, can be affected by gas causing compressional wave slowing. Source rocks that are rich in Total Organic Content (TOC) can result in slow, less dense shales that appear ‘overpressured’ when they may not actually be so. The solution though, despite all these uncertainties and complexities, is to constrain pressure prediction by use of a geological model in exhumed basins.
Looking forward, the next stage is to use the processed seismic velocity data to interpret pressure below current well depths in this part of the east Barents Sea. When the shooting season re-opens, we hope to use some of these observations farther to the east into the Russian Barents Sea to produce pressure interpretation that will de-risk drilling in this new frontier area. For instance, as the Hekkingen Formation source rock becomes more deeply buried to the east, and consequently has higher maturities, fluid expansion may become a problem for pressure prediction and this will need to be factored in