Remote Sensing Underground
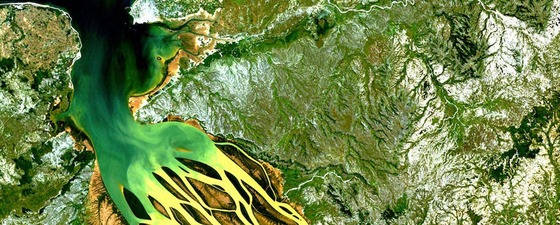
Satellite remote sensing uses specific frequency bands to reveal details about the surface of the earth. By borrowing this idea and applying it to broadband 3D seismic data, reservoir heterogeneities are illuminated enabling optimal reservoir development. Nexen Inc. are using this technology to shed light on Canadian oil sands reservoirs.
How does one map a three-dimensionally complex reservoir in order to position horizontal wells precisely and optimally? This is the challenge facing many geoscientists, particularly those who are working to develop McMurray oil sands plays in western Canada. By applying spectral techniques borrowed from satellite remote sensing to 3D seismic data, the reservoir ‘sweet spots’ can be identified, allowing more efficient heavy oil production.
The Challenge
The challenge: how do you achieve precise well placement in a complex reservoir?
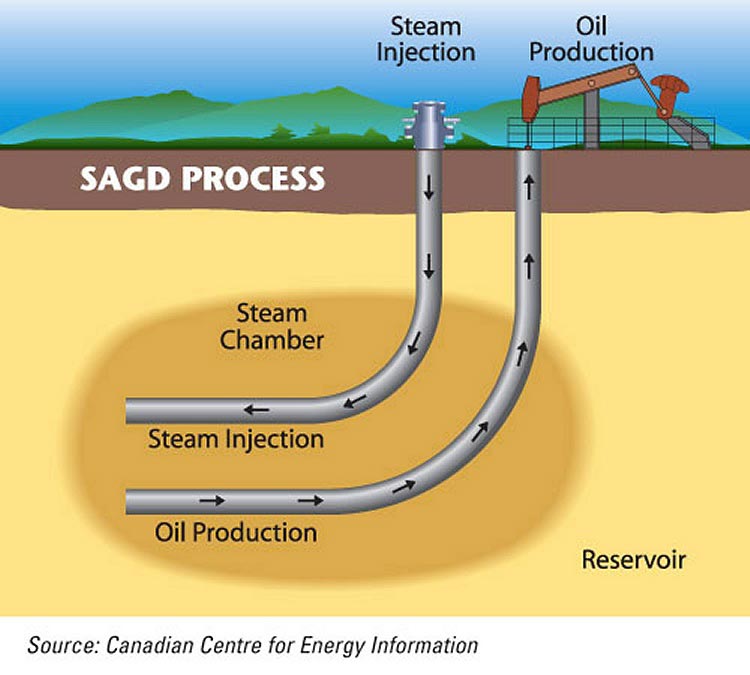 Illustration of the SAGD process where the injector and producer well pairs must be placed at the optimal position, orientation and inclination. Source: Canadian Centre for Energy InformationThe Lower Cretaceous McMurray Formation in north-eastern Alberta contains an estimated 1.7 Tbo oil in place. But this significant hydrocarbon resource is in the form of bitumen: a heavy, viscous oil which is not simple to extract. An in-situ method which is being applied at a number of oil sands projects is Steam Assisted Gravity Drainage (SAGD). In SAGD, horizontal well pairs with five metres vertical separation between them are drilled; high pressure steam is injected into the reservoir through the upper (injector) well heating the bitumen so it can flow down to the lower (production) well via gravity. Drilling pads supporting eight or more SAGD well pairs are not uncommon. That is to say, SAGD production is a significant capital investment and placement of the well pairs within the sand reservoir is critical to achieving production rates and recoverable reserves, as well as minimising steam requirements – both for efficiency and environmental concerns.
To optimally place these expensive horizontal well pairs within the sand reservoir, one must find a way to reveal a detailed picture of the reservoir. While the geologic model of the reservoir is always being updated with new knowledge, the depositional environment can generally be described as one of broad valleys infilled with tidally influenced meandering river point bar deposits and associated sediments. The stacked point bar sandstones are interbedded with mudstones characterised by highly variable dip, known as inclined heterolithic stratification (IHS). Some of these mudstones extend laterally for kilometres, and can be permeability barriers or baffles between the injector and producer wells, reducing the effective pay length of a well pair.
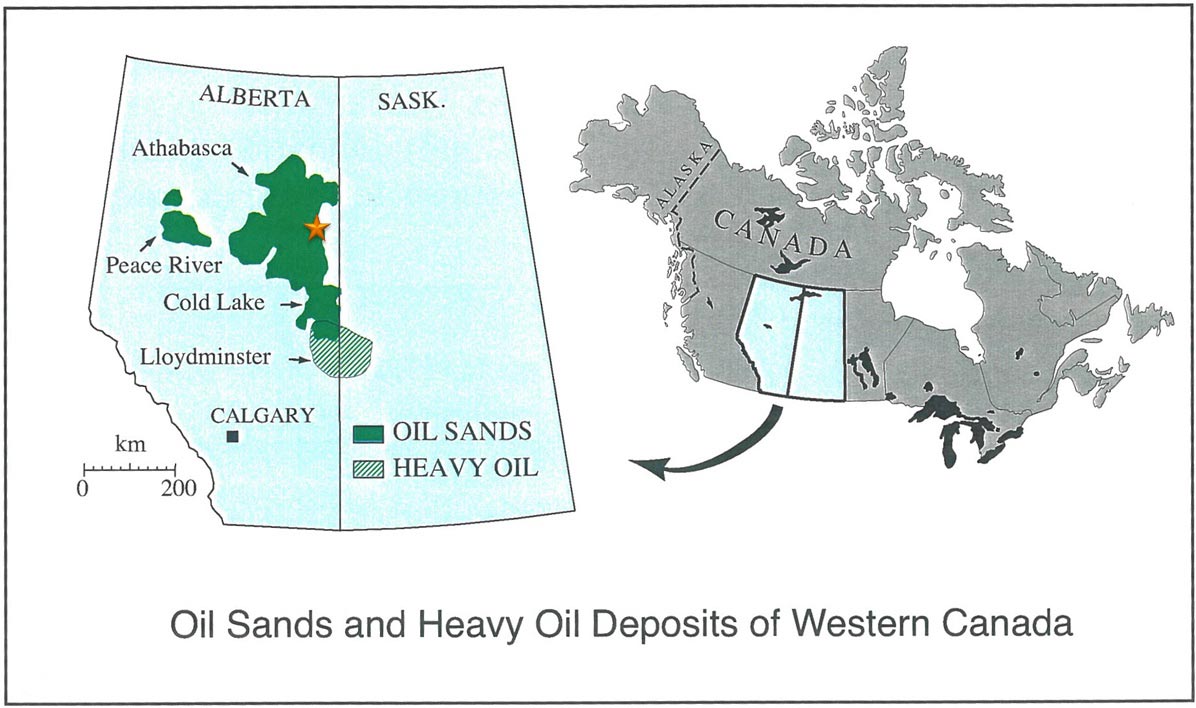 These new techniques were used to help understand the complex reservoirs at the Kinosis 1A project (starred). Source: NexenPlacing both injector and producer wells in continuous, high permeability cross-bedded sand lithofacies is best. It is therefore critical to find a way to reconstruct the three-dimensionally complex riverbed with as much detail as possible. Like a roller-coaster track: where does it rise and fall? Where are its stacked sand bars; where do they thin and thicken? In addition, one must delineate the extent and varying inclination of the potentially harmful interbedded mudstone layers. Underestimating the three-dimensional complexity of the reservoir could be a very expensive mistake.
Working with OpenGeoSolutions, Inc., Nexen Inc. applied various spectral ‘remote sensing’ techniques to a 120 km2 3D seismic survey from the Kinosis 1A project, including Spectral Decomposition, Spectral Discontinuity™, and Spectral Inversion. At Kinosis, Nexen expects to drill 29 SAGD wells, with steam injection anticipated in 2014; production from these wells is expected to average 15,000 to 25,000 bpd at peak rates. Understanding the complex reservoir is essential for successful reservoir development.
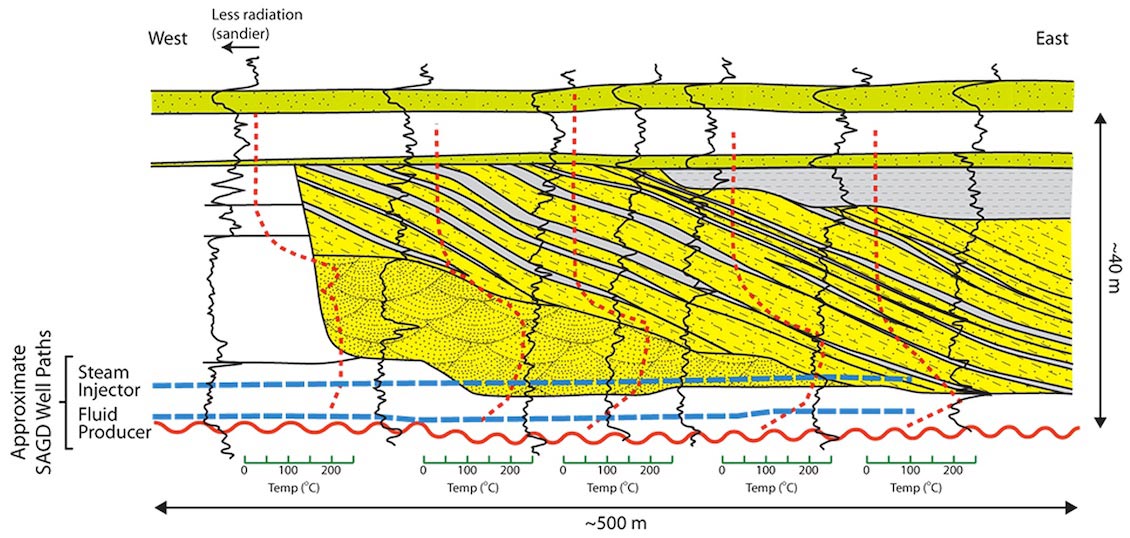
Block diagram showing the lateral continuity of mud stone inter beds (grey) with in the McMurray Formation that impede oil production. It is critical to identify their potential vertical SAGD permeability barriers. Source: Modified from Labrecque, 2011
Unlocking Spectral Information
 Curvature Indicates Localised Structure Curvature, a measurement of the degree of bending of a reflecting surface, is strictly an attribute of the geometry of a seismic reflector, independent of any spectral qualities. Curvature indicates the localised structure, ranging from dome-shaped hills to bowl-shaped valleys. Curvature calculated on the seismic volume may indicate the morphology of the local structure. Assuming differential compaction, the domes – localised structural highs – correspond to areas of the channel which are sand-filled; concave bowls correspond to softer mud-fill. This interpretation, based on a purely geometric attribute, is in agreement with, and independent of, the spectral results. Source: Nexen IncTraditional seismic interpretation uses broadband seismic data – as wide a frequency range as possible. This broadband data contains detailed information about the reservoir, but one must remember that it provides a view of the subsurface that is biased to what the dominant frequency band of the conventional seismic data can ‘see’. The problem is to unlock the valuable spectral information to reveal details of the reservoir that cannot be seen with the broadband data. A helpful analogy is to consider remote sensing of the earth’s surface from satellite data. We get one understanding of the surface from what we can see with the broadband visible light spectrum, but by restricting the frequency range to sub-bands, various details can be revealed. For instance, frequencies in the visual blue sub-band reveal detail for mapping the depth of lakes; frequencies in the mid-infrared sub-band are used for forest fire detection.
The following are some examples of the way in which applying specific frequency bands to broadband 3D seismic data are illuminating and adding to the information which can be obtained from seismic data.
Spectral Decomposition Reveals Relative Thickening and Thinning
The geology lights up using horizon slices at the McMurray reservoir level using different Spectral Decomposition volumes. Relative thickening, thinning, stratigraphic edges, faulting, and geologic packages (sandstone vs. mudstone) are highlighted in valuable detail. Source: Nexen Inc
The geology lights up using horizon slices at the McMurray reservoir level using different Spectral Decomposition volumes. Relative thickening, thinning, stratigraphic edges, faulting, and geologic packages (sandstone vs. mudstone) are highlighted in valuable detail. Source: Nexen Inc
The geology lights up using horizon slices at the McMurray reservoir level using different Spectral Decomposition volumes. Relative thickening, thinning, stratigraphic edges, faulting, and geologic packages (sandstone vs. mudstone) are highlighted in valuable detail. Source: Nexen Inc
The geology lights up using horizon slices at the McMurray reservoir level using different Spectral Decomposition volumes. Relative thickening, thinning, stratigraphic edges, faulting, and geologic packages (sandstone vs. mudstone) are highlighted in valuable detail. Source: Nexen Inc
The geology lights up using horizon slices at the McMurray reservoir level using different Spectral Decomposition volumes. Relative thickening, thinning, stratigraphic edges, faulting, and geologic packages (sandstone vs. mudstone) are highlighted in valuable detail. Source: Nexen Inc
The geology lights up using horizon slices at the McMurray reservoir level using different Spectral Decomposition volumes. Relative thickening, thinning, stratigraphic edges, faulting, and geologic packages (sandstone vs. mudstone) are highlighted in valuable detail. Source: Nexen Inc
The geology lights up using horizon slices at the McMurray reservoir level using different Spectral Decomposition volumes. Relative thickening, thinning, stratigraphic edges, faulting, and geologic packages (sandstone vs. mudstone) are highlighted in valuable detail. Source: Nexen Inc
The geology lights up using horizon slices at the McMurray reservoir level using different Spectral Decomposition volumes. Relative thickening, thinning, stratigraphic edges, faulting, and geologic packages (sandstone vs. mudstone) are highlighted in valuable detail. Source: Nexen Inc
The geology lights up using horizon slices at the McMurray reservoir level using different Spectral Decomposition volumes. Relative thickening, thinning, stratigraphic edges, faulting, and geologic packages (sandstone vs. mudstone) are highlighted in valuable detail. Source: Nexen Inc
The geology lights up using horizon slices at the McMurray reservoir level using different Spectral Decomposition volumes. Relative thickening, thinning, stratigraphic edges, faulting, and geologic packages (sandstone vs. mudstone) are highlighted in valuable detail. Source: Nexen Inc
In remote sensing, sub-bands of electromagnetic frequencies are used to map interference patterns at the surface of the earth to depict soil, vegetation, moisture content, and so on. In Spectral decomposition, much lower seismic frequencies are used to examine interference in the subsurface: interference caused by a variable rock mass.
Spectral Decomposition allows us to view subsurface seismic interference at discrete frequencies throughout the entire bandwidth of usable signal. This discrete spectral view provides substantially more detail and fidelity than attributes or amplitude extracted from a single full bandwidth signal. Full bandwidth seismic and attributes provide a view of the subsurface that is skewed towards what can be seen just at the dominant frequency of the seismic wavelet. Spectral decomposition exposes a signal-band view of the subsurface that reveals stratigraphic and/or structural edges as well as layering complexity and relative thickening and thinning. Fault definition is often superior to conventional edge detection methods.
The geology lights up using different frequencies. In this example, to image a stratigraphic feature that varies in thickness, the Spectral Decomposition images use red-green-blue (rgb) composites in order to portray the spectral information. If the frequency content is high, thinner stratigraphic features will be tuned in and highlighted by the higher amplitude, in this case in blue. If the frequency content is lower, thicker stratigraphic features will stand out, depicted by the red colour.
Spectral Discontinuity Exposes Stratigraphic Edges and Faulting
Source: Nexen Inc.
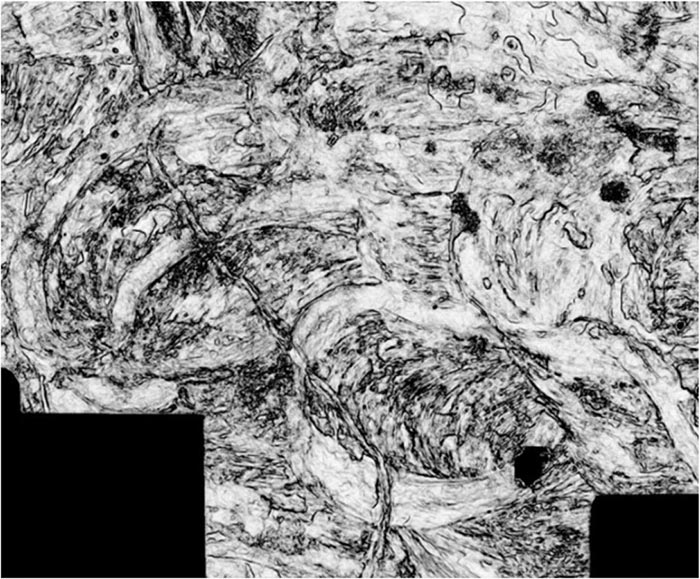
Spectral Discontinuity is an additional spectral tool to reveal stratigraphic and structural discontinuities. By staying clear of wavelet tuning pitfalls that can afflict broad band data, this approach offers distinct advantages over traditional coherency-based fault definition methods, providing less dip-sensitive detection of faults and terminations. The Spectral Discontinuity images are displayed using a grey scale where light tones represent areas of continuity, dark represents discontinuities.
Spectral Inversion Highlights Geologic Packages
Source: Nexen Inc.
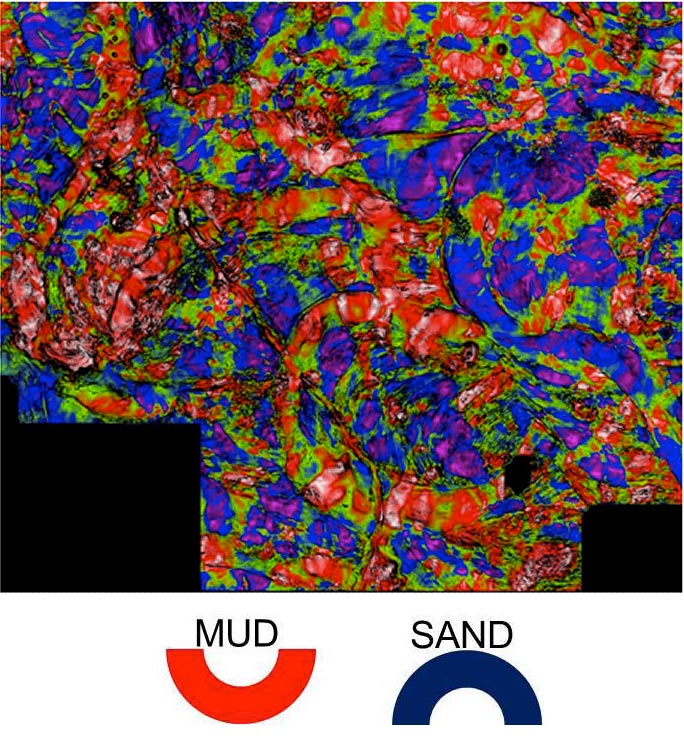
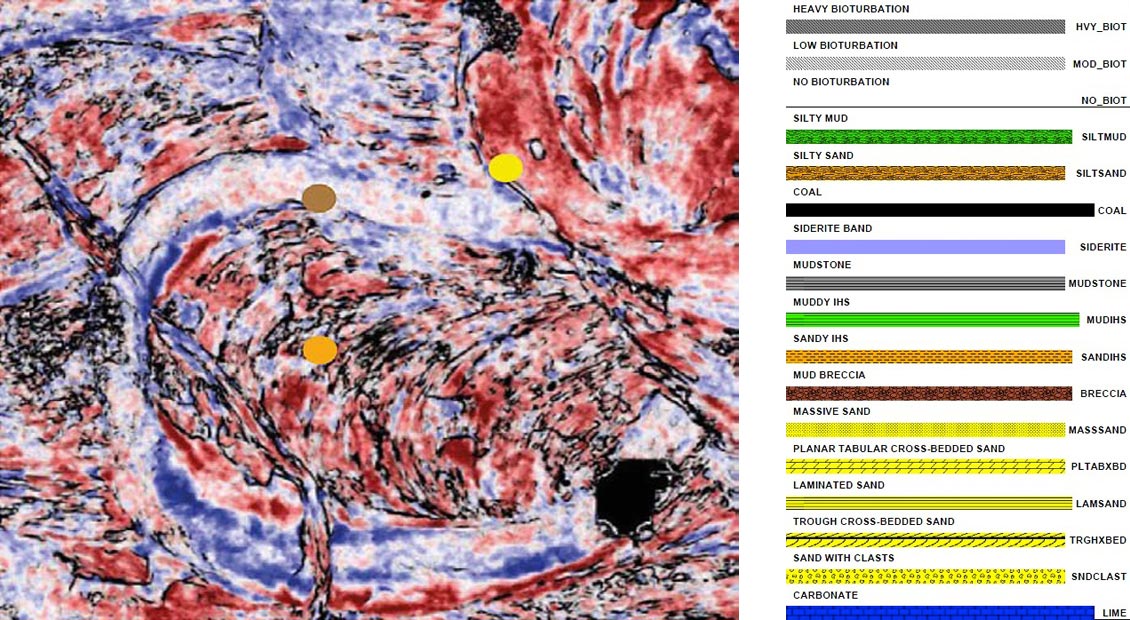
Spectral Inversion is a statistical inversion to answer the question: is a given layer in the interbedded sequence likely to be sand or mud, and what is the associated probability? Spectral Decomposition data are inverted to binary layer type: that is, only two materials are allowed: relatively soft (sandstone shown in red) or relatively hard (mudstone). Additional analysis can be conducted to compute thickness and associated confidence levels. Well log data, cores and Formation-Images (FMI) logs, as this example shows, are integrated into the seismic results to anchor the seismically-derived estimates to direct measurements.
Dip Azimuth Locates the Sweet Spot
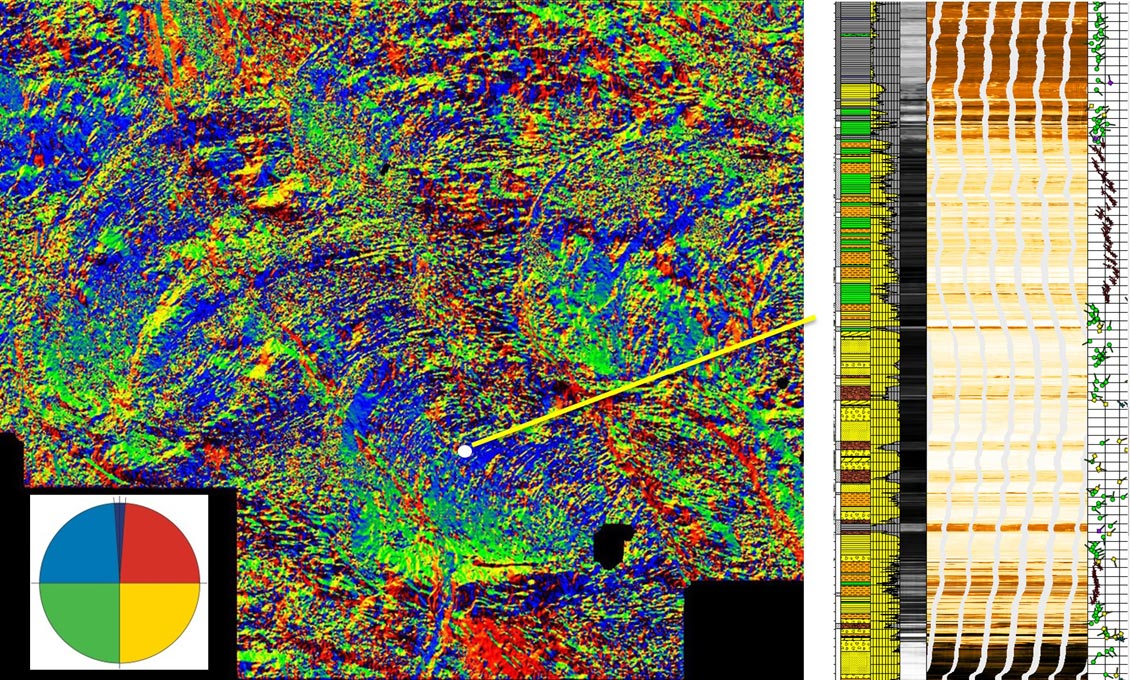
Source: Nexen Inc.
Inspired by the detail revealed by the spectral methods, the team developed a technique to detect the sweet spot of the point bar reservoir. Assuming the bitumen accumulation is associated with stacked point bars deposited by tidally influenced meandering rivers, one may exploit the relationship between the stream flow direction and the dips in the point bar to identify the size of the point bar and channel geometry, and hence infer which portion of the bar will most likely contain the cleanest sand.
From the paleogeography of this region, we know the general stream flow direction: the surface sloped gently down to the north or north-west, toward the sea. To estimate dips, ‘dip azimuth’ volumes – extremely localised estimates of dip magnitude and dip direction at the McMurray surface – were computed from the 3d seismic data.
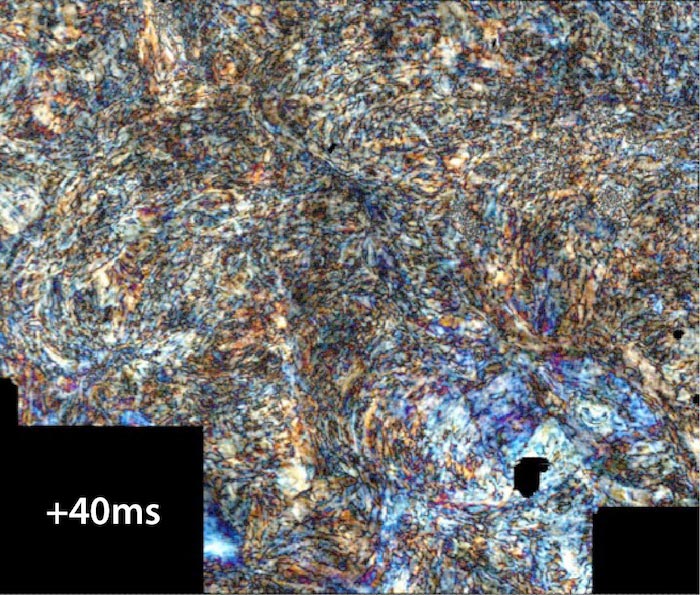
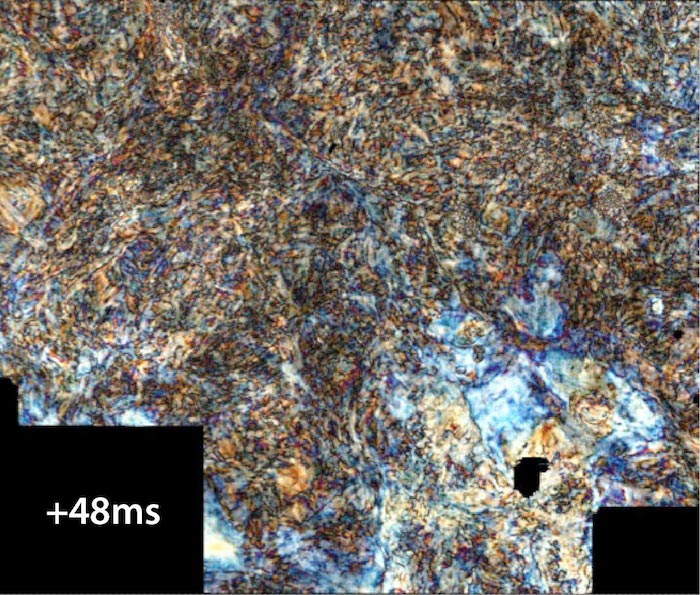
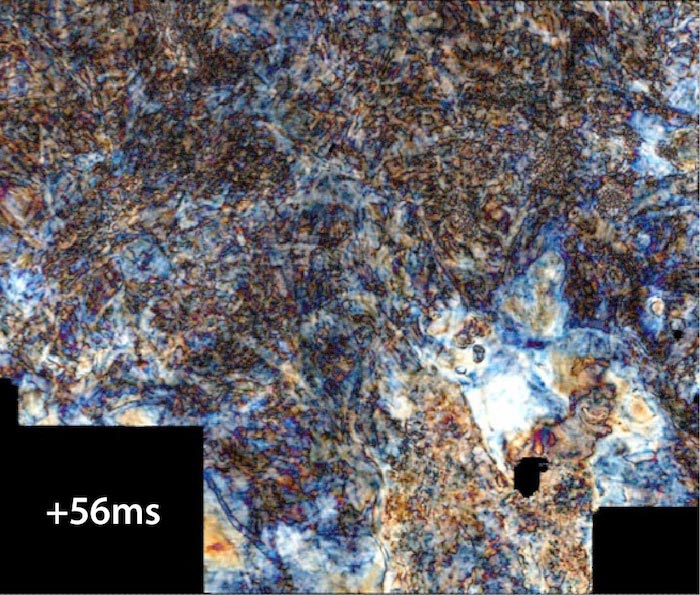
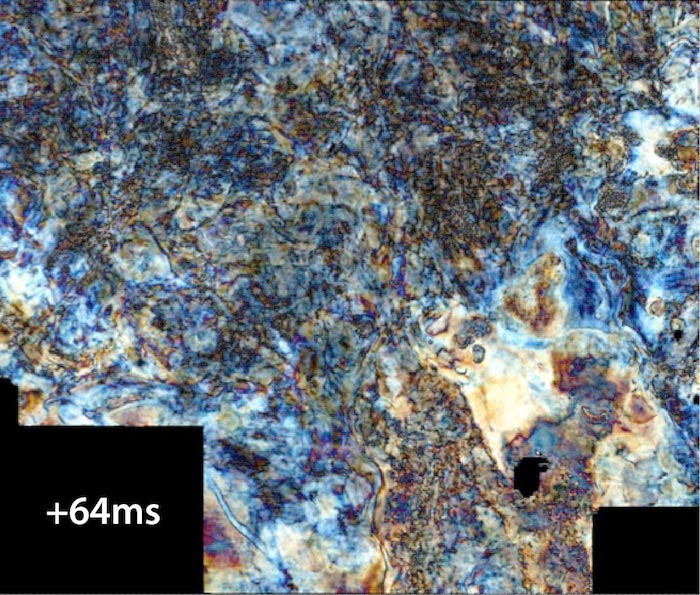
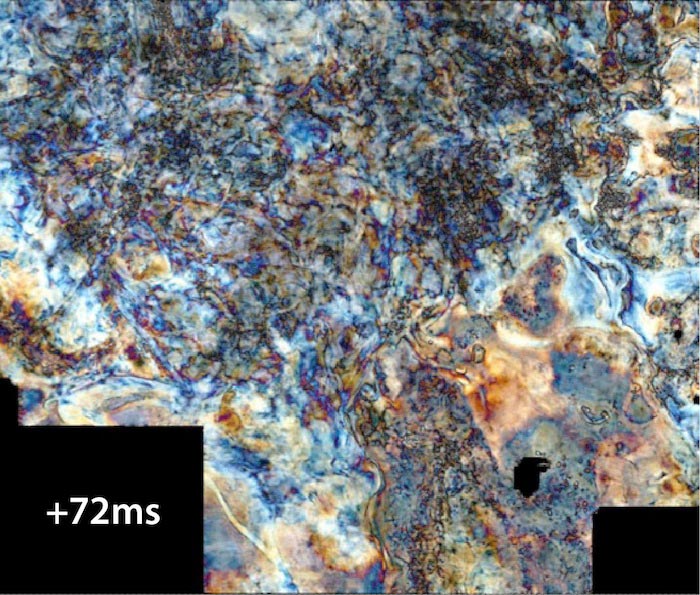
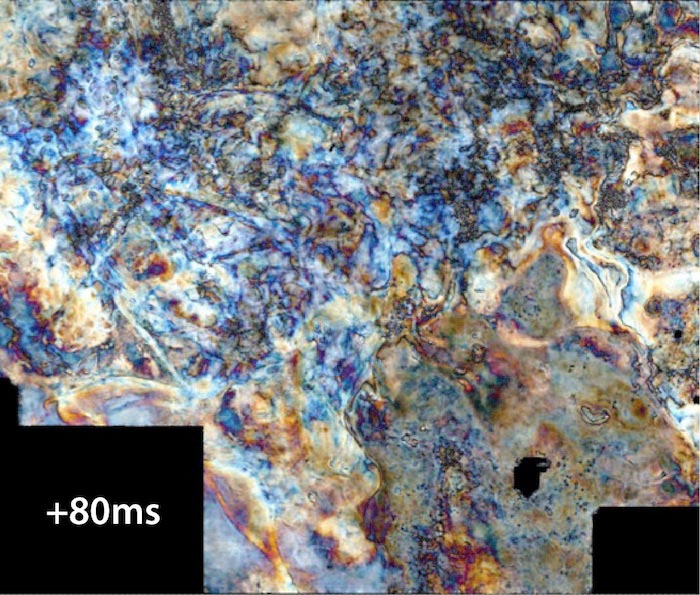
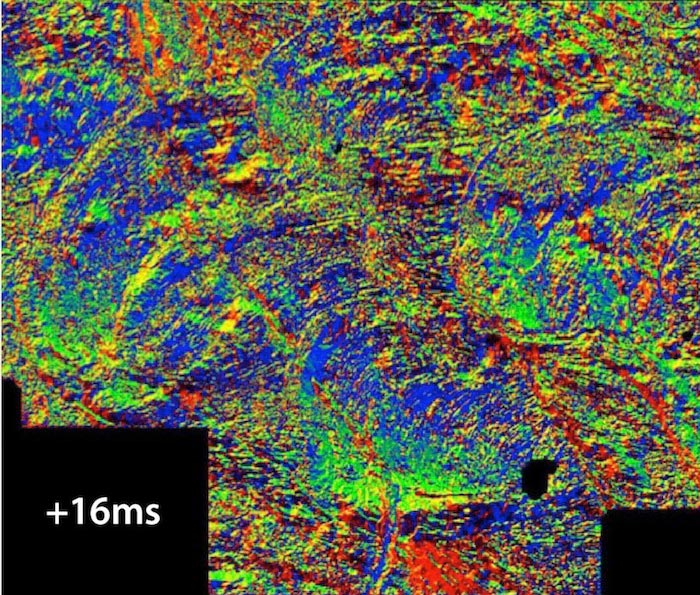
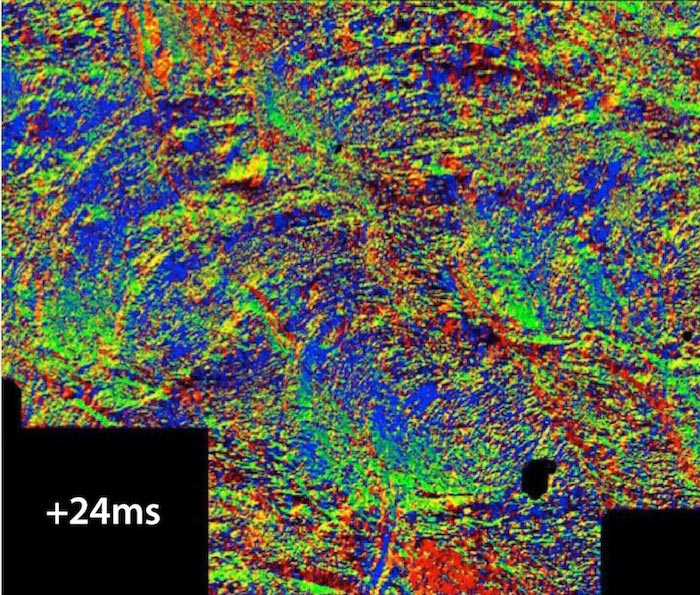
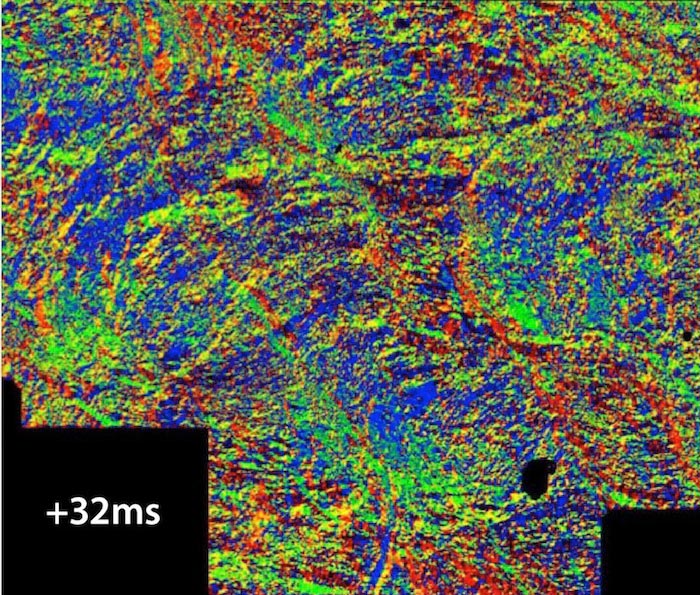
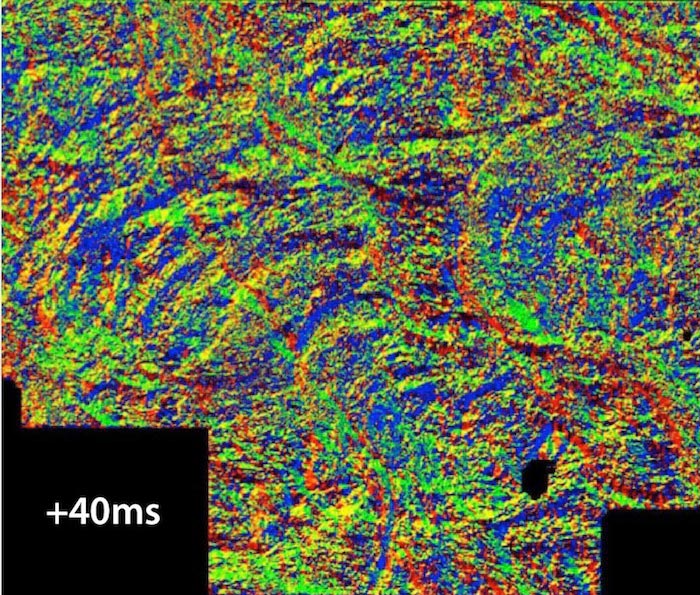
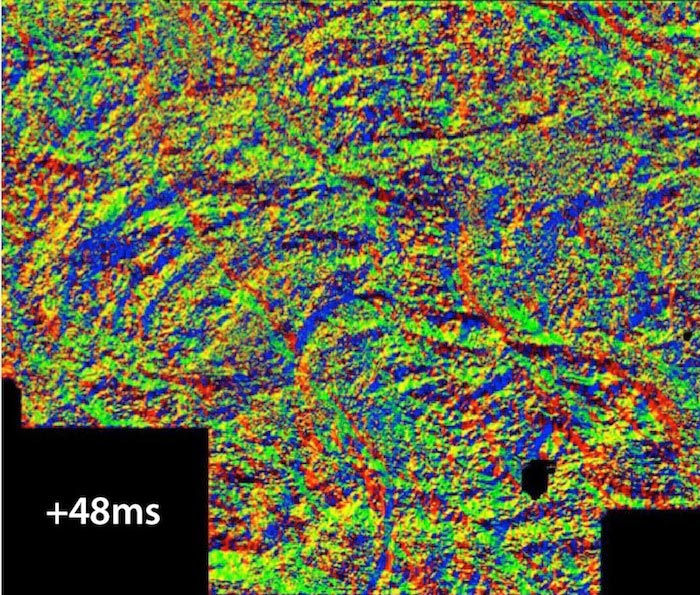
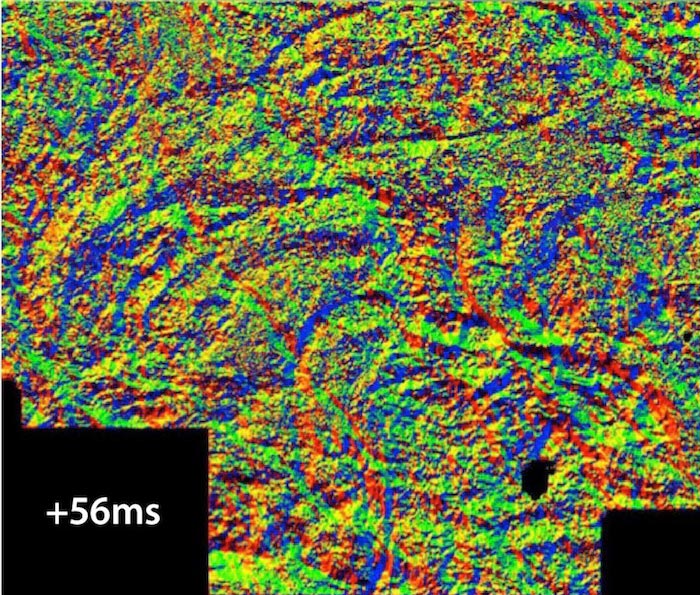
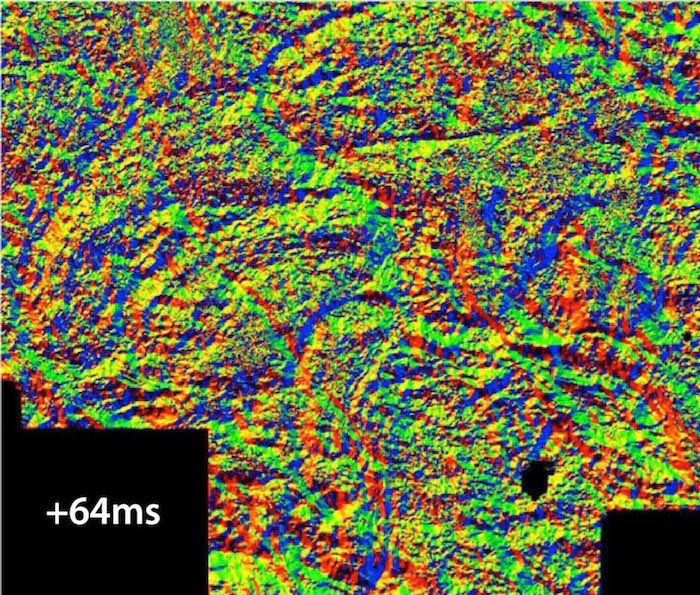
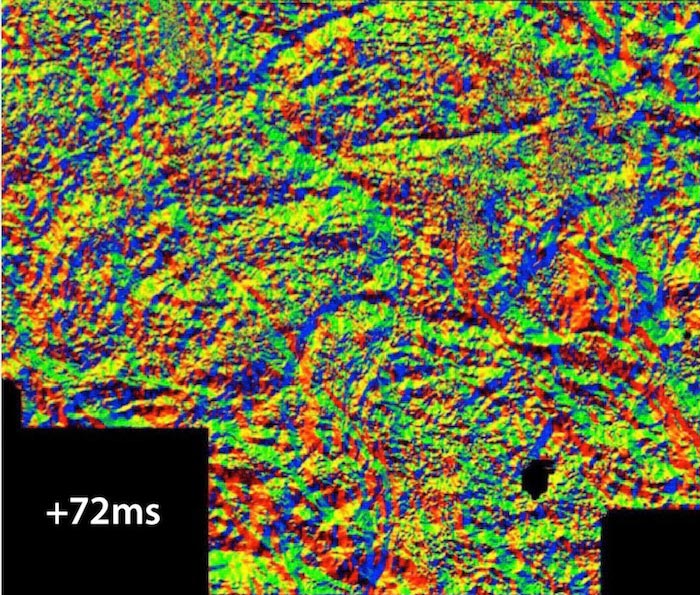
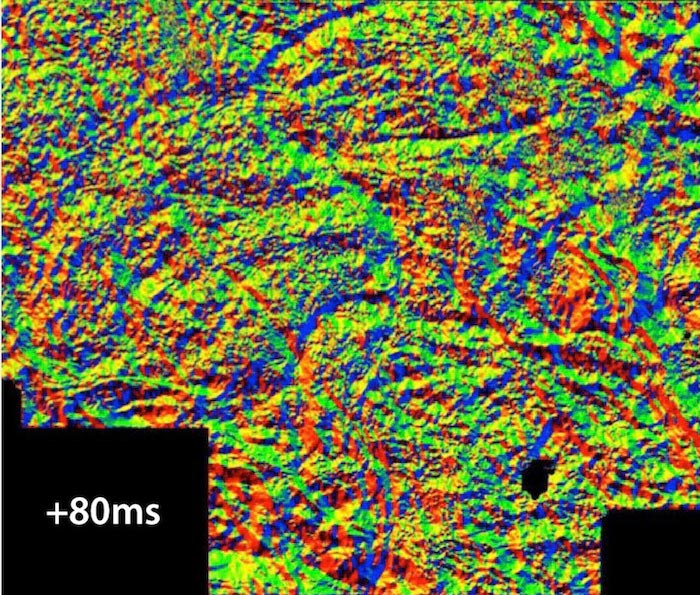
When combined with Spectral Discontinuity, the resulting image reveals, in considerable detail, the internal structure of the point bar deposits, showing the dip regime within the point bar sequences. Continuous IHS mud beds typically correspond to lateral accretion: they are deposited on the inside bends of point bars, accumulating as they migrate over the life of the meandering channel. By assembling a ‘movie’ of dip azimuth slices, the interpreter can investigate the downstream migration of the stacked point bars through palaeo-depositional time.
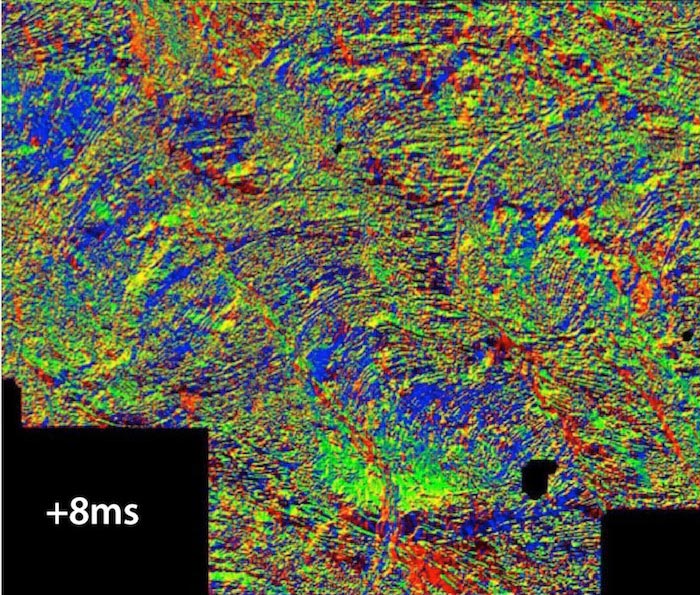
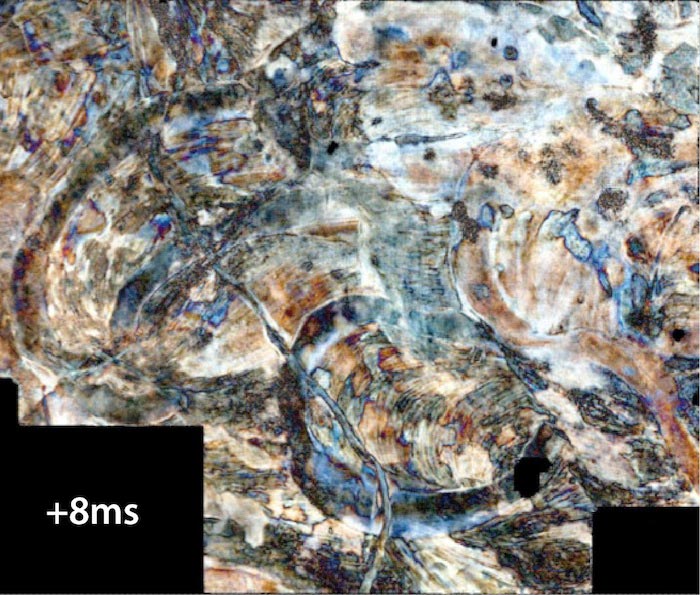
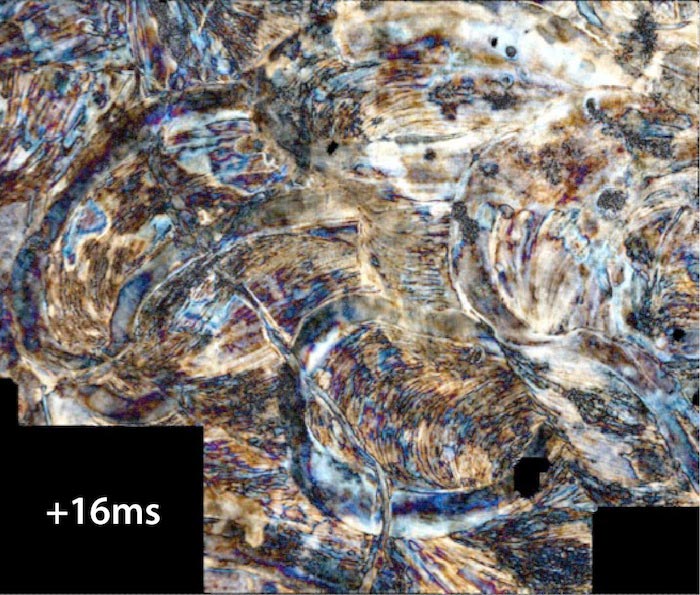
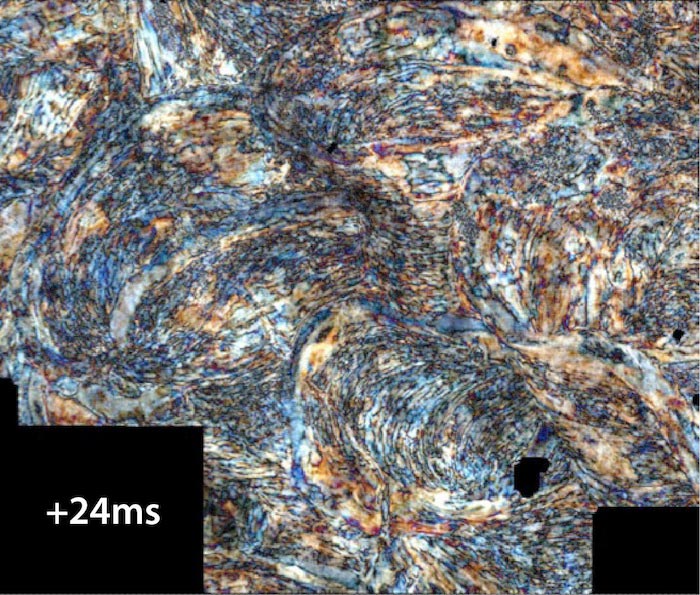
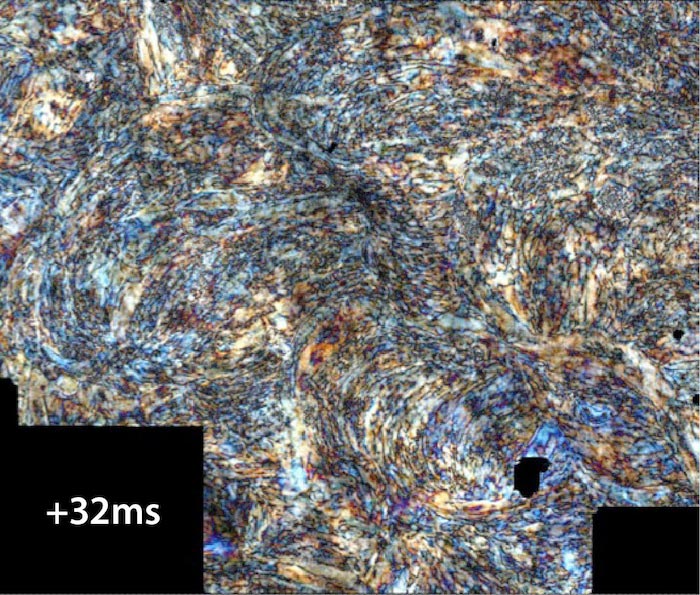
A ‘movie’ of Dip Azimuth slices allows the interpreter to investigate the downstream migration of stacked point bars through paleo-depositional time. Source: Nexen Inc.
A ‘movie’ of Dip Azimuth slices allows the interpreter to investigate the downstream migration of stacked point bars through paleo-depositional time. Source: Nexen Inc.
A ‘movie’ of Dip Azimuth slices allows the interpreter to investigate the downstream migration of stacked point bars through paleo-depositional time. Source: Nexen Inc.
A ‘movie’ of Dip Azimuth slices allows the interpreter to investigate the downstream migration of stacked point bars through paleo-depositional time. Source: Nexen Inc.
A ‘movie’ of Dip Azimuth slices allows the interpreter to investigate the downstream migration of stacked point bars through paleo-depositional time. Source: Nexen Inc.
A ‘movie’ of Dip Azimuth slices allows the interpreter to investigate the downstream migration of stacked point bars through paleo-depositional time. Source: Nexen Inc.
A ‘movie’ of Dip Azimuth slices allows the interpreter to investigate the downstream migration of stacked point bars through paleo-depositional time. Source: Nexen Inc.
A ‘movie’ of Dip Azimuth slices allows the interpreter to investigate the downstream migration of stacked point bars through paleo-depositional time. Source: Nexen Inc.
A ‘movie’ of Dip Azimuth slices allows the interpreter to investigate the downstream migration of stacked point bars through paleo-depositional time. Source: Nexen Inc.
A ‘movie’ of Dip Azimuth slices allows the interpreter to investigate the downstream migration of stacked point bars through paleo-depositional time. Source: Nexen Inc.
Ongoing Work
Nexen Inc. continues to advance the application of innovative spectral methods such as Spectral Decomposition, Spectral Discontinuity and Spectral Inversion, along with Dip Azimuth Investigations. To date, these tools are revealing heterogeneity detail within the McMurray reservoir beyond classic seismic resolution, helping the geoscientist to estimate layering architecture, thickness variability and probability of sand, as well as sweet spots within the sand bars.
Ongoing work includes integrating these reservoir characterisation estimates with a comprehensive database of core, well log and FMI data, in order to independently verify the seismically-derived relationships and patterns of sediment distribution throughout the reservoir, and bring this knowledge to further refining the next iteration of the solution.
About the Author
Dragana Todorovic-Marinic is a Staff Geophysical Specialist and a member of the Kinosis Development Team. “I am working on re-thinking the limits of seismic data and incorporating advanced seismic attributes to characterize oil sands reservoirs” she explains. “I feel there is more information relevant to bitumen reservoirs that historical approaches with seismic data have extracted. I’m interested in integrating geophysics with geology to get better detail into models of the oil sands reservoirs, for best placement of the horizontal well bore and ultimately to optimize the oil sands resource.”
Geophysics is not the career Dragana originally had planned. She was enjoying her work as a physicist at the centre for Material Research in Srajevo, former Yugoslavia, when civil war tore the country apart. Dragana and her family emigrated to Canada and settled ni Calgary in 1993, where she enrolled in graduate studies, eventually transitioning to geophysics. She has been working in the oil industry since 1997 and joined Nexen in 2011.
Acknowledgements
The author gratefully acknowledges Nexen Inc. and CNOOC for permission to show these results.
These findings were first presented at GeoConvention 2012 in Calgary in the paper titled: Shedding more light on an Oil Sand reservoir by applying integrated spectral method analysis – Case Study; co-authors David Gray, Dale Vanhooren and Greg Osiowy of Ne