3D Contrast Property Mapping
One of the major challenges in understanding the nature of the subsurface is to accurately depict geology when data are sparse. By combining well logs and seismic data, seismic inversion can be used to visualize subsurface geostructures in a realistic form.
Volume rendering tools for visualizing the subsurface have seen significant advancement over the past 15 years, with the introduction of 3D texture for interpretation of large data sets. Although very useful for global reservoir characterization, these tools are often less suitable for highly detailed geological interpretation because available rendering methods lack the required resolution and require substantial computing resources. In addition, they generally do not include the required specialist interpretation tools for fine scale analysis. As a result, interpretation is still mostly done using classical 2D software that offers more flexible tools and workflows.
An alternative technique for fine scale analysis has been developed recently which is not subject to these limitations. Incorporating ‘bump mapping’, this technique adds textures and patterns to an object’s surface without heavily taxing computing resources. Detailed grayscale bump maps and volumes are created to bring out the underlying 3D texture in contrast map, panel and section displays to visually emphasize structural information to the displayed properties.
A recent study of a prospective field in the Dutch North Sea illustrates the technique’s effectiveness in the interpretation of seismic inversion results. GdF SUEZ commissioned the study to determine the probability of gas sands in a new area of their license, where multiple wells were already producing gas. Seismic surveys in the new area showed a promising bright spot, but its location below the gas-water contact in the producing area added unacceptable risk. In addition, the company was concerned that the thick salt overlay was affecting the seismic amplitude.
The contrast property mapping technique was used to generate contrast maps, panels and sections with which to closely inspect and differentiate gas sands from tight sands, shales and high reflectivity artifacts caused by the overburden Zechstein formation.
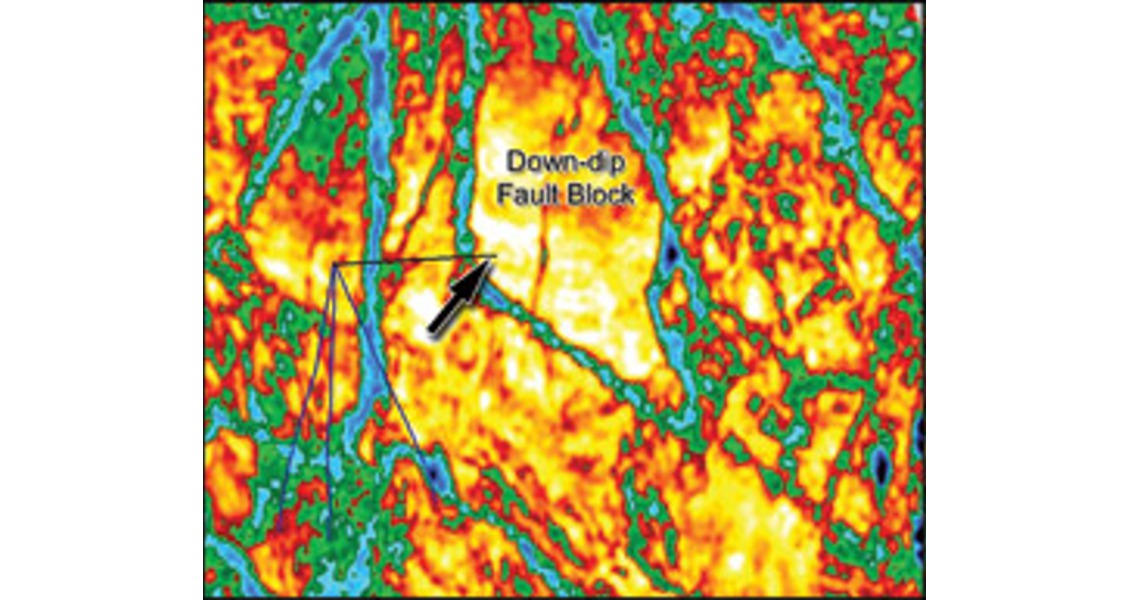
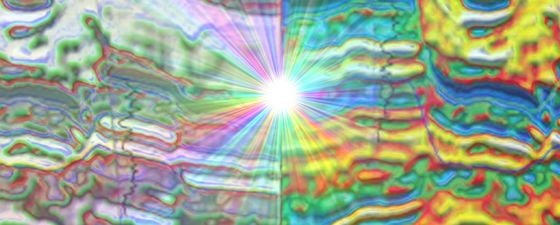
Minimum P-impedance map at Rotliegendes reservoir level. Low P-impedance at reservoir level indicates high probability of gas bearing sands for a newly drilled well in the adjacent fault block (arrow).
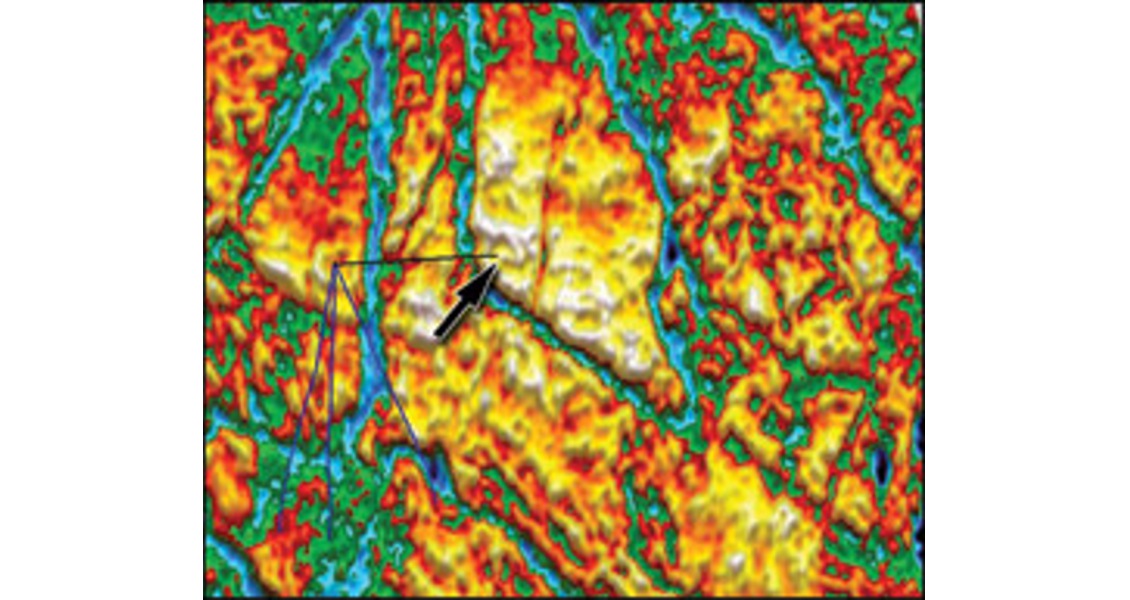
3D texture from shading provides additional detail by adding gray zones just around the minimum P-impedance extremes. emphasising reservoir quality variations and faults. Based on this interpretation, GdF SUEZ successfully drilled the new well in the down-dip structure as indicated by the black arrow.
Rock Properties from Seismic
GdF SUEZ has been producing gas for a number of years from the Permian Upper Slochteren fluvial/aeolian sandstones in the Dutch North Sea where the regional top seal is a Zechstein evaporitic sequence. Several deformation phases from Triassic to recent have resulted in the present day complex structural setting.
The objective of the reservoir characterization study was to combine sonic and density well logs with seismic data in a common domain and use that information to determine the rock properties in the Rotliegend sands. The study began by combining general geologic insight with specific petrophysical data recorded in nine nearby wells, five of which had encountered gas in the Upper Slochteren of the Rotliegend Group.
Two zones were chosen for well log quality control, one in the evaporitic Zechstein formation, which gives a very distinct sonic log response, and the second in the reservoir. Rock physics modeling was applied to make up for the lack of acoustic logs, for elastic log correction and simulation of different reservoir fluid conditions.
The petrophysically corrected well logs were then used to determine the seismic wavelets at the various offset ranges. Analysis of the seismic gathers showed the seismic response was severely disturbed below the thickest portion of the Zechstein salt. A simultaneous inversion was run using a set of laterally varying wavelets to compensate for the apparent energy absorption below the Zechstein.
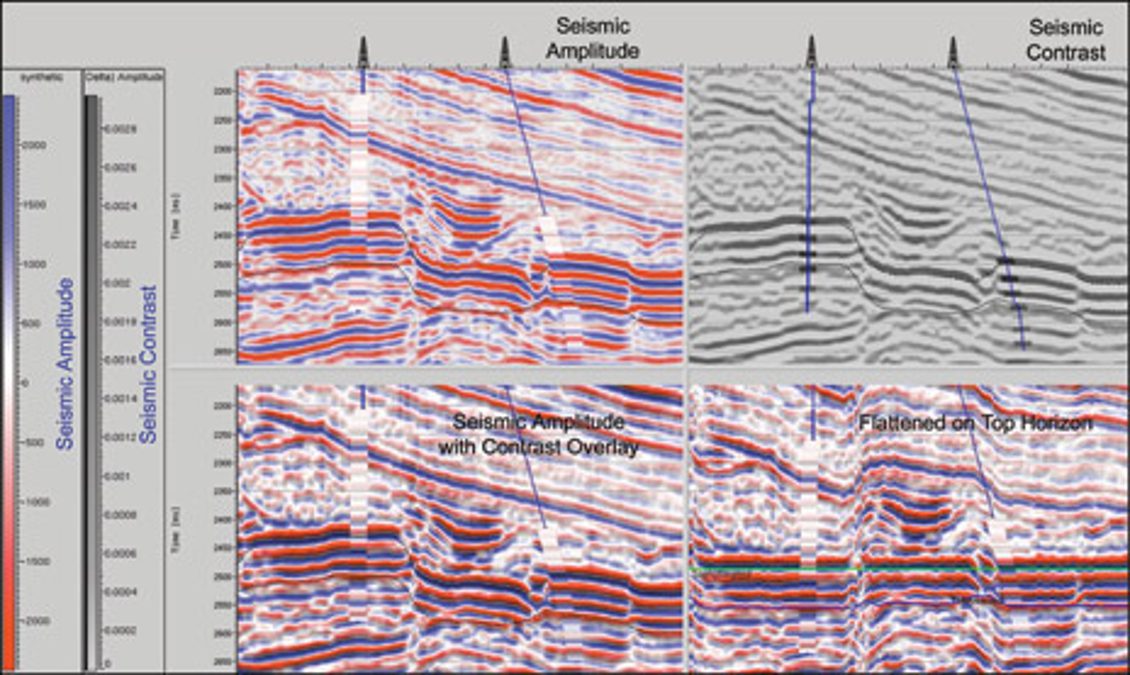
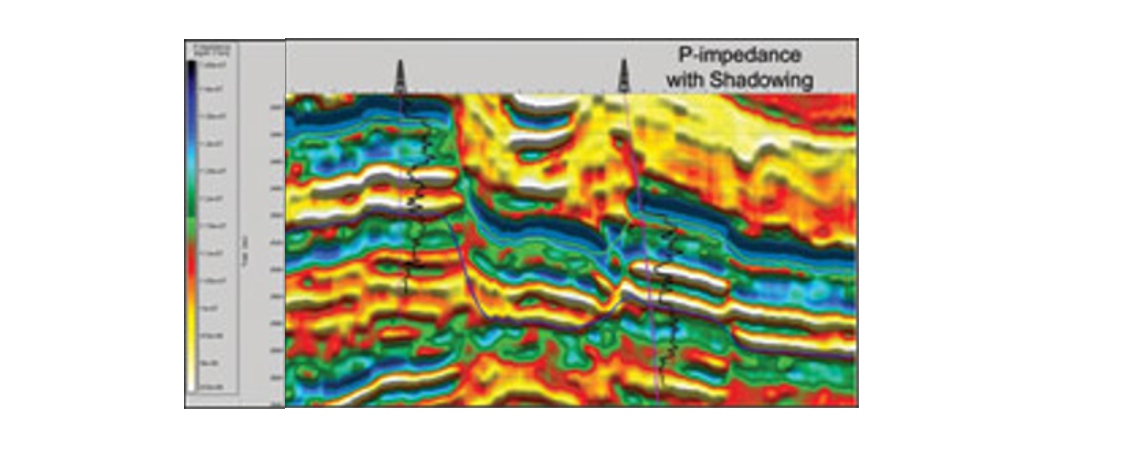
Seismic panel through two wells, with a seismic property panel overlain by the grayscale map calculated from seismic contrast to create the illusion of lighting and shadowing, enhancing lateral variations. Warmer and bright colors appear nearer in depth to viewers than cooler colors, shading is added to reds, orange or yellows so that these amplitudes appear to protrude. The technique enhances structural features and layer connectivity, to aid the interpreter.
Gaming showed the way
Over the past decade, the advent of PC gaming and entertainment has added greater realism in 3D rendering, as gaming companies introduced a fresh approach to texture through light and shadow. The human brain relies on colour, shading and lighting to provide clues into the nature of the object under review. For example, colour helps differentiate an apple from an orange, lighting and shading distinguishes a circle from a sphere, even in a 2D space. Similarly, lighting and shading can also indicate texture, showing the distinction between a smooth sphere, a fuzzy tennis ball and a bumpy orange. The angle of the light and its nature – ambient, diffuse, specular or emissive – also affect how the object is perceived.
Initial implementations of this new approach relied on a technique called bump mapping, which uses shading and lighting to give the impression of a 3D surface without the high computational overhead of full 3D rendering. This was used to improve fault mapping, and structural interpretation of seismic, and the method was later expanded by adding 3D texture to maps to identify faults and discontinuities with lighting effects used to enhance the display of seismic data in 3D.
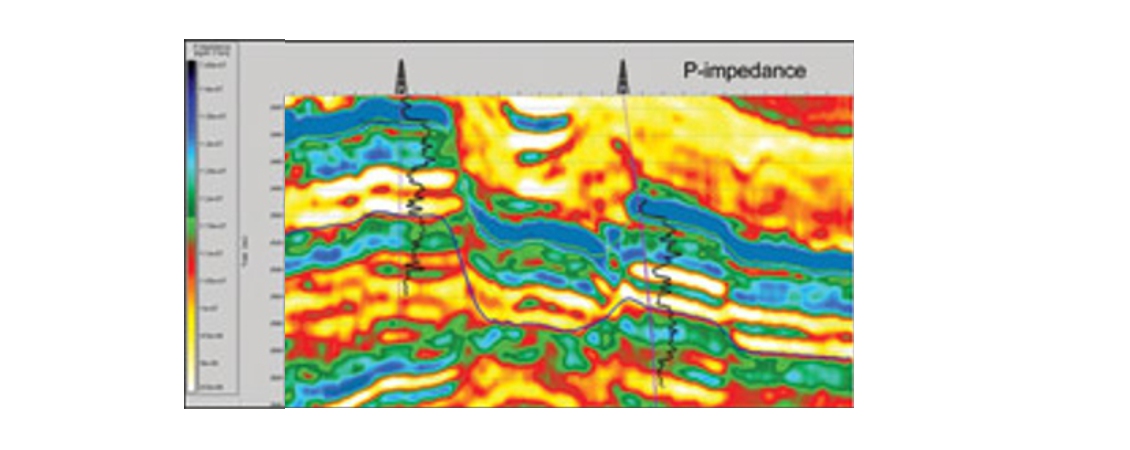
P-impedance from seismic inversion through the newly drilled well location, demonstrating increased contrast and fine detail of the inversion results. The reservoir sands appear as low P-impedance layers, showing continuation of down-dip sands in the down-dip block (right). Added shadow aids delineation of geological features.
P-impedance from seismic inversion through the newly drilled well location, demonstrating increased contrast and fine detail of the inversion results. The reservoir sands appear as low P-impedance layers, showing continuation of down-dip sands in the down-dip block (right). Added shadow aids delineation of geological features.
3D contrast mapping
Building on this foundation, 3D contrast property mapping is now used to add texture to map and section displays without the need for computer-intensive 3D volume-rendering tools or sophisticated calculations. Shadow and lighting effects are applied to properties using semi-transparent grayscale property overlays, which improve realism and add visual depth to the image, very useful in as map or section display. Contrast property mapping can be performed on any type of laptop or desktop computer without the need for specialized hardware or software.
 Gas sands probability derived from inversion result shows the derived pay probability. The well to the right, drilled in the down-dip block, showed good quality gas bearing sands as predicted.With light and shadow, artifacts are far clearer and the details are more apparent. Any property can be displayed in this manner, including seismic, elastic properties from inversion, derived porosity and pay probability data. The technique can easily be combined with traditional interpretation tools to better understand subtle geometric relationships between layers.
The data is drawn on a plane but made to appear as if it is drawn in 3D. Although the grayscale maps and impedance are somewhat affected by seismic attenuation caused by the salts and anhydrites deposited just above the reservoirs, it is clear that the technique adds significant contrast and structural information to the property map. It is much easier to see potential boundaries between reservoir sections and identify subtle variations in reservoir quality.
Successful well
By using modern 3D visualization techniques, GdF SUEZ was able to highlight the consistently high probability of gas sands and distinguished them from non reservoirs and seismic artifacts caused by the Zechstein formation. The technique proved fast and efficient, running without specialized 3D software or expensive hardware, and can be combined with all the benefits of 2D interpretation tools. This technique has the potential to aid geological understanding related to stratigraphy, structural connectivity and faults, and to improve communication among asset team members and with management.
And, as always, the proof was in the final result. Following this study, GdF SUEZ decided to drill, chose a location with the help of these images – and found good quality gas bearing sands as predicted.