The turnaround time for end-to-end workflows in reservoir characterisation, going from interpretation via modelling to prediction is typically quite long. The handover of results and insights between domains is mostly manual, and it is difficult to keep track of different versions of raw data, derived data, and interpretations.
Lack of automation leads to late integration of data and prohibits continuous and iterative improvements. Until recently, workflow automation and work step customisation required software developer skills. However, recent advancements in cloud computing, cloud storage, data liberation, and open-source and cross-platform developments have permitted and started the journey of democratising innovation.
Here, we address the challenge of updating reservoir models with key information from subsurface-related observations in an automated and efficient manner. By quickly screening the impact of different scenarios, the team can more easily identify crucial domain work and make better decisions. This is exemplified in a case study from the Ekofisk Field in the North Sea.
In this article, the terms Actionable Insights and Recipes are introduced:
Actionable insights are a set of images that highlight key aspects of subsurface data and models, and thus motivate and drive domain work and support decisions. By automating how these insights are created, links between a decision, data, and assumptions available at the time of the decision can be established.
Recipes are based on a set of open-source extensible Python libraries. The recipes perform regular tasks in subsurface analysis workflows, such as gathering and visualizing data. Data liberation enables automated data management within each recipe, allowing the user to focus on generating and sharing insights from the data.
Figure 1 illustrates the aspects that are addressed. Teams and individuals have access to all the data and insights throughout the process. Each domain brings data from processing, modelling and interpretation steps as needed, feeding a set of customized displays. These displays allow quick audits within the domain, and knowledge sharing with other domains.
Figure 1: Generation of actionable insights, driving domain work and supporting decisions.
Case study: Ekofisk
The Ekofisk Field is a Chalk field, where water injection helps displace the oil mostly sitting in low-permeability, high-porosity matrix rock. The background for this case study was the start-up of a new water injector, which caused a huge increase in water cut at a nearby producer. Several attempts were made to mitigate the problem (Aamodt et al. 2018), but the producer was eventually shut down.
The objective of the analysis was to identify and characterize possible fluid pathways between the injector and the producer by using injection and production data, time-lapse seismic data, and reservoir simulation models. The problem statement was as follows: “Given the data available, identify possible flow connections between the injector and the producer, and translate the identified connections into reservoir model updates to enable an uncertainty/scenario screening loop.”
Some of the analysis steps that connect information from geology, geophysics, and reservoir engineering data are presented. All steps are combinations of reusable analysis recipes implemented in Python.
Data gathering and selection of time and space subset for study
The first step of the analysis is to automatically extract all relevant data, with the name of the injector as the only required input. Figure 2a is an image produced as a reference when extracting the injector startup time. The injector startup time is inferred from historic water injection data. The display confirms that the date extracted is representative.
Figure 2b shows the location of the injector (I1) and producers (P1-P7) in the vicinity of the injector that are active within 1 year after injection startup. Figure 2c shows the producers sorted according to the maximum water cut within 1 year after injector startup to confirm the issue of increased water cuts. As can be seen from the figure, the producer that experienced a dramatic increase in water cut can automatically be identified.
By using injector startup time, injection rates, and production water cuts, relevant time-lapse seismic surveys (S1-S9 in Figure 2d) are identified.
Figure 2: Selection of time and space subset for study; a) Time interval of interest at I1, b) wells in area of interest, c) water cut information of nearby producers (P1–P7) in time interval of interest d) seismic time lapse data of interest (S1–S9).
Generation of actionable insights
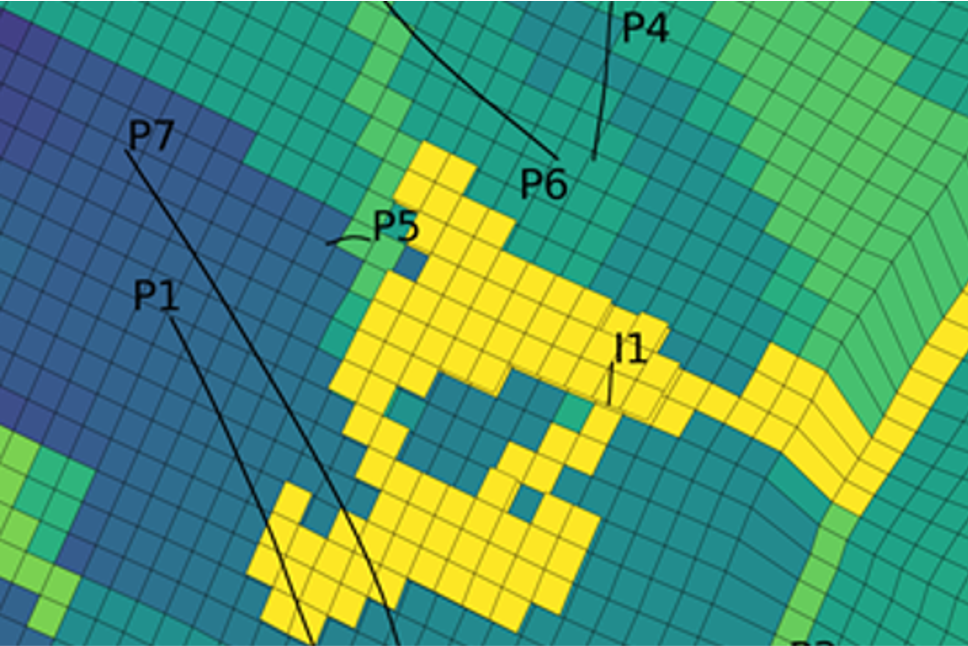
Actionable insights are generated based on the gathered information. Figure 3 provides an example of such actionable insights which are produced with the same zoom-in for easy comparison: (3a) A seismic amplitude map and available horizons to identify if any of the relevant horizons are not signal consistent, (3b) a fault map in seismic resolution, (3c) small-scale fractures not captured by standard fault interpretation workflows, and (3d) 4D seismic time strain information to look for interpretable hardening/softening effects.
Figure 3c shows a high degree of small-scale fractures (rock fabric) between the injector I1 and producer P1. The rock fabric is a seismic attribute that captures subtle, small-scale changes in seismic reflections usually not depicted in common fault extraction techniques (Haege et al. 2013). Boersma et al. (2020) validated the rock fabric attribute with well data and suggest its usage as an indication of potential fluid pathways within the Ekofisk Field. Figure 3d indicates a 4D time strain response in the same area, which represents fluid movement and/or a pressure change.
Figure 3: Actionable insights generated automatically from relevant geoscience and reservoir engineering data based on well names and time span. All information is shown in top and side views. The top views are at the reservoir level. Side views are along the producer P1. a) seismic amplitude, b) faults, c) small-scale fractures, d) 4D time strain. Polygons in c) and d) delimit extracted geobodies.
Both insights, i.e. rock fabric and 4D time strain observations, can carry information about the flow connection between the injector and producer. Therefore, one of the possible actions is to extract those observations as geobodies. The geobodies are extracted automatically with the condition that they are connected to the injector (see Figure 4).
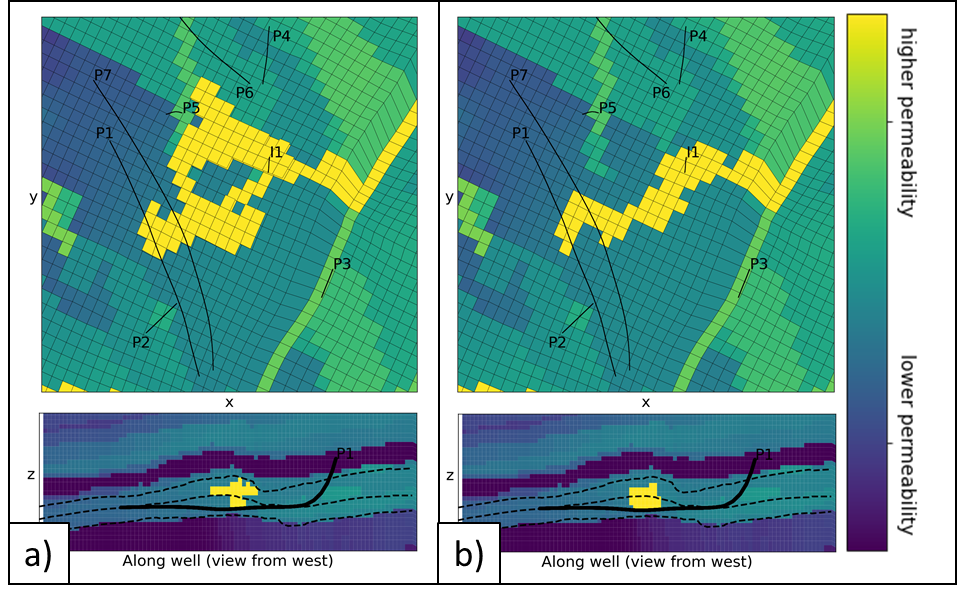
The next step is to turn those geobodies into grid properties to update the reservoir model. One of the recipes links each geobody to a set of grid cells in the reservoir model, and allows flexible property modifications in those cells only, keeping the rest of the grid property unchanged. Figure 5 shows an example of an updated permeability model scenario using upscaled rock fabric as well as upscaled 4D time strain information. The rest of the permeability model is left unchanged.
Figure 4: User-driven automated extraction of possible flow connections, a) rock fabric, b) 4D time strain. The outline of the geobodies is highlighted with polygons in Figure 3 c) and d).
An important aspect of this workflow is that a flexible uncertainty and sensitivity analysis can be performed. This includes, for instance, the mapping of features into different grid resolutions to investigate potential upscaling issues (e.g., preserving fault and fracture connectivity in the model), parameter permutations of seismic attributes to generate an ensemble of plausible geological scenarios, or a signal-to-noise analysis based on seismic time-lapse data.
All those investigations can be run automatically in an uncertainty loop to screen various scenarios. The outcome of the re-evaluated model is available immediately and shared across domains, based on which a decision can be made by the team. The lesson learned can be automatically applied to other parts of the field and refined as needed.
Figure 5: Extracted potential flow connections translated into grid property updates, enabling uncertainty and scenario screening loops. The property shown is the permeability model with upscaled a) rock fabric and b) 4D time strain information update.
Assisting the decision-making process
In this article, we introduced a new concept of actionable insights. The insights are generated by a set of recipes and contain key information of subsurface-related observations that are directly used to update reservoir models. All steps are performed automatically with limited input required from the petrotechnical expert, which makes those insights reproducible at any time.
The recipes are designed in Python such that they can be used and customized by non-developers, and enabled by data liberation and cloud computing technologies. The outcome assists the decision-making process by presenting all available data and various scenarios in a fast and efficient manner to the stakeholders.
Acknowledgments
We thank ConocoPhillips Skandinavia AS and the PL018 license partners (TotalEnergies EP Norge AS, Vår Energi ASA, Equinor Energy AS and Petoro AS) for providing the data. We further acknowledge the Research Council of Norway and the industry partners, ConocoPhillips Skandinavia AS, Aker BP ASA, Vår Energi ASA, Equinor AS, Neptune Energy Norge AS, Lundin Norway AS, Halliburton AS, SLB Norge AS, and Wintershall DEA, of The National IOR Centre of Norway for support. We note however that the opinions presented are those of the authors and do not necessarily represent those of ConocoPhillips Skandinavia AS.
References
Aamodt, G., Abbas, S., Arghir, D. V., Frazer, L. C., Mueller, D. T., Pettersen, P., Prosvirnov, M., Smith, D. D., Jespersen, T. and Mebratu, A. A. [2018]. Identification, Problem Characterization, Solution Design and Execution for a Waterflood Conformance Problem in the Ekofisk Field–Norway. Paper presented at the SPE Improved Oil Recovery Conference, Tulsa, Oklahoma, USA, April 2018. SPE-190209-MS. DOI
Boersma, Q., Athmer, W., Haege, M., Etchebes, M., Haukas, J. and Bertotti, G. [2020]. Natural Fault and Fracture Network Characterisation for the Southern Ekofisk Field: A Case Study Integrating Seismic Attribute Analysis with Image Log Interpretation. Journal of Structural Geology, 141 (104197). DOI
Haege, M., Maxwell, S., Sonneland, L. and Norton, M. [2013]. Rock Fabric Characterisation Using 3D Reflection Seismic Integrated with Microseismic. Paper presented at the 75th EAGE Conference and Exhibition Incorporating SPE Europec, London, June 2013. DOI