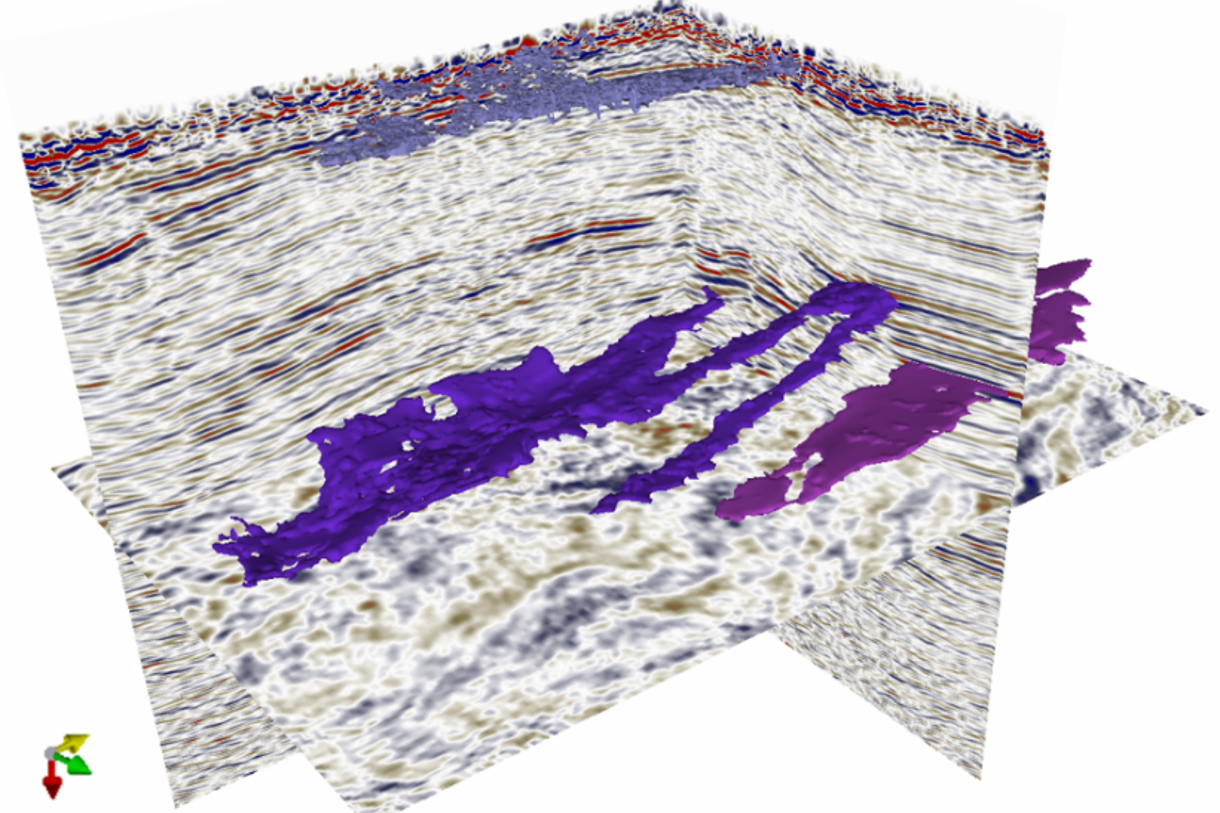
3D viewer showing the three areas of highest potential of gas in place.
Adapting conventional E&P workflows to scale up hydrogen and helium exploration
Natural hydrogen and helium exploration is booming worldwide. The combined production of hydrogen, helium and carbon dioxide in the Earth’s subsurface provides alternative resources that could revolutionize the path to a low carbon future. Geophysical data could play a key role in finding a way to detect these accumulations.
In the context of climate change and the search for new energies to reduce our carbon footprint, natural hydrogen and helium exploration has been underway for years. Accumulations of these gasses have been identified in many countries and new volumes are still being discovered around the world.
Decades of oil and gas exploration have significantly trimmed interests in other natural energy resources, hence leading to a limited amount of data and articles dedicated to hydrogen, helium and carbon dioxide exploration. More recently however, exploration of such resources has experienced renewed interest at an unprecedented level.
The Fonts-Bouillants project in France is one of these projects. It involved the acquisition of surface and geophysical data, which will hopefully lead to the detection of the hydrogen, helium and carbon dioxide accumulations. A better understanding of their distribution and volumes forms another major goal.

The Fonts-Bouillants project scope
The Fonts-Bouillants area is located onshore in the Paris Basin, around 270 kilometres south of Paris. The area was a producer of sparkling water until the 1980s due to high gas concentrations in subsurface water reservoirs. Nowadays, Fonts-Bouillants is the very first project in France for helium, carbon dioxide and potentially natural hydrogen exploration.
The present study is mainly based on the Fonts-Bouillants 3D seismic cube, which was acquired in 2022, 2D seismic lines, a CSEM cube and ERT profiles. The seismic cube records Permian to Holocene formations and is centred around the major Saint-Parize fault, known to be the focal point of surface gas escape.
A detail structural framework is the critical factor to consistently assess gas accumulations in this area. With no deep wells available, the intensely studied Paris Basin geology is an asset to perform an approximation from freshly acquired surface data. With that approximation, the reservoir corresponds to the Triassic deltaic sandstones of the Buntsandstein formation.
Structural and stratigraphic interpretation
The entire seismic volume is interpreted using a comprehensive approach combining structural and stratigraphic analysis. The fault network modelling relies on a hybrid process that allows to pinpoint the highest probability of the fracture occurrence in the seismic signal, avoiding noise detection common for fair to poor seismic data quality.
Advanced structural gradient attributes are generated from input multi-trace attributes to enhance the fracture images and ultimately extract 3D fault objects.
The early-built fault network is then used to structurally constrain the horizon interpretation. Seismic horizons (Peak, Trough, Zero Crossings, and eventually Inflection Points) are simultaneously auto-tracked across the full seismic volume, chronostratigraphically sorted and subsequently used as geometrical constraints to generate a signal-driven Relative Geological Time model (RGT model).
The RGT model has been refined to ensure consistency between the reflection events and auto-tracked horizons. Due to the importance of faults for migration pathways, attention has been paid to the termination of surfaces against them.

Geological interpretation and results
The RGT model gives access to an unlimited number of isochronous surfaces enabling to strata slice the seismic cube at a sub-sample resolution. The whole batch of extracted isochrones is mapped with a series of attributes derived from seismic traces.
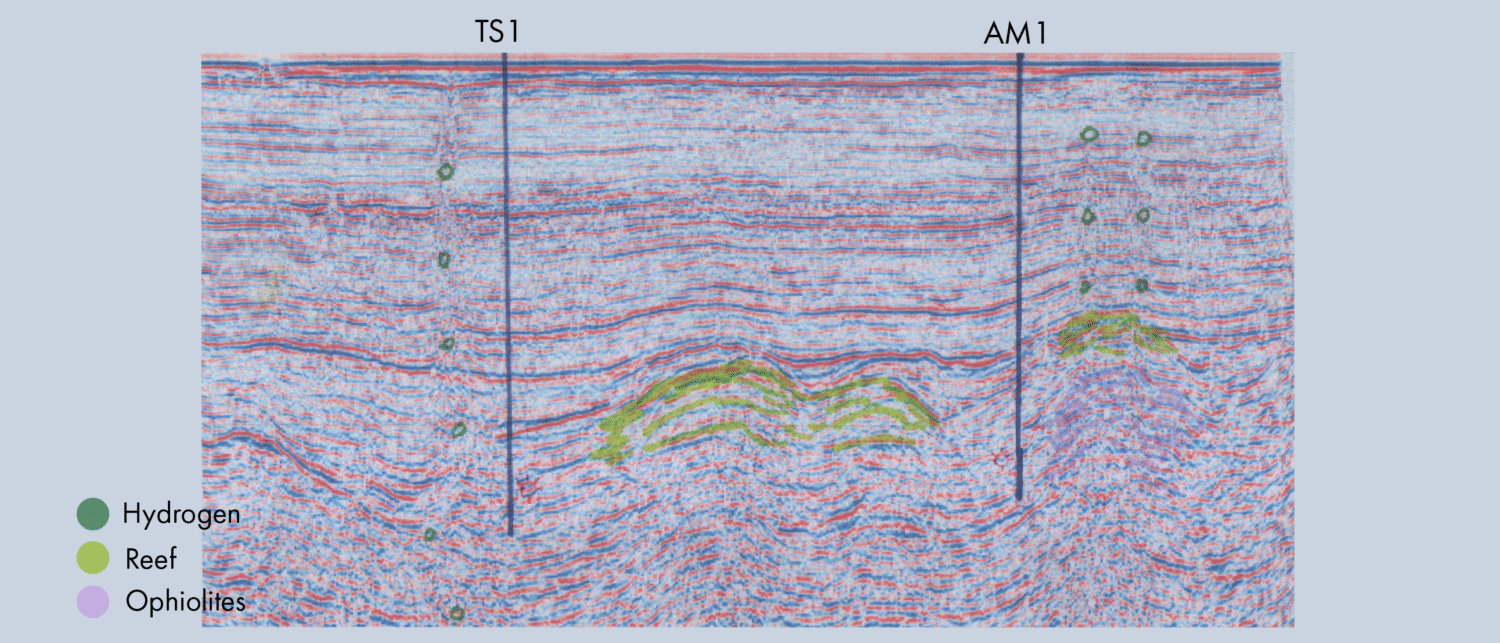
Three of those attributes are here computed to enhance physical property contrasts in different ways: Root Mean Square amplitude (windowed high amplitude maximum), Sweetness (energy signature changes driven by trace envelope and instantaneous frequency) and Relative Acoustic Impedance (estimation of apparent acoustic impedance variation).
Relative Acoustic Impedance values are interrogated from cross-correlated high values of RMS and Sweetness within a cross plot, both in vertical sections and stratal slices. This multi-attribute workflow emphasizes zones of higher probability of non-metal (hydrogen), carbon dioxide and noble (helium) gases accumulation, lately correlated with high CSEM values.
Multi-attribute seismic expressions are ultimately converted into three geobodies, eventually classified as shallow gas stock (light purple-coloured) and deeper gas stock (dark purple and pink-coloured). The shallow stock has recently been drilled and therefore confirmed a helium-rich reserve.

The right approach for detecting gases
The comprehensive seismic interpretation approach based on automated processes (faults and horizons extraction) and driven by the exploitation of a signal-driven relative geological time (RGT) model unlocks new perspectives of non-metal and noble gases detection from seismic expressions. The successful application on the Fonts-Bouillants project highlights a high potential for helium, hydrogen and carbon dioxide extraction, essential for further drilling campaigns and replication of the method on other projects.
Marc-Antoine Dupont, Emmanuelle Baudia, Nicolas Daynac, Eliis
Acknowledgements
The presented workflow was obtained using PaleoScan™ software developed by Eliis. The authors would like to thank 45-8 Energy for the dataset.