How cutting data help decode the subsurface
Through the integration of geochemical data from cuttings in the exploration workflow, important uncertainties can be further narrowed down.
“De-risking future targets should be done through the integration of all sources of information at hand. The enormous dataset now available via the Released Wells Initiative helps us a lot,” says geologist Tore Grane Klausen from M Vest Energy where he uses Glex Energy’s platform to analyse the data.
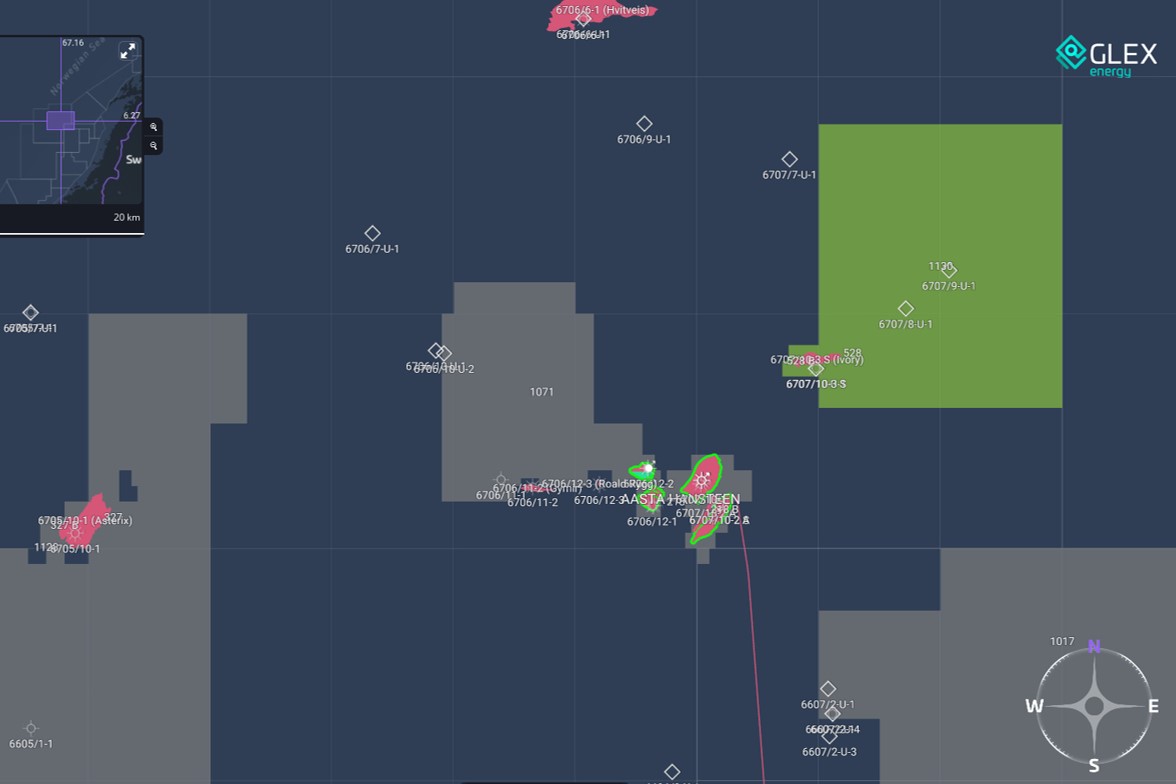
Tore shows an example from the Aasta Hansteen area in the Norwegian Sea. “We are currently looking at the prospectivity of the area, where the Cretaceous interval hosts the most important reservoirs,” he says.
“Our ongoing study of the cuttings geochemical analyses reveals distinct trends in the XRF data, for which we find similarities in the literature,” Tore adds. For example, in a published study from the interior US, XRF data from formations of different ages have been linked to degrees of terrestrial input. In short, a positive correlation between silica and zirkonium is associated with terrestrial influx, while a negative correlation tends to be associated with biogenic silica.
Similar trends are observed in the case study from the Norwegian Sea. More importantly, formations have very different reservoir qualities and from an exploration perspective it is important to understand what is the mineralogical cause for this.
Do you want to hear more about this exciting study or are you interested in the application of new technology on subsurface workflows?
Attend the DIGEX 2022 Conference in Stavanger next month and hear all about it.

The critical role of the overburden
However, just looking at the reservoir section is not enough. The overburden is equally important since the prospects are quite shallow and the timing of burial versus migration and charge is critical with regards to which phase and amount to expect. For depth conversion, the overburden is also important for getting the velocities right.
As always, the problem with the overburden is that data are often lacking. That’s where the cuttings dataset comes in again. “It is rarely the case that cuttings are available for the entire overburden, but most often at least parts of the stratigraphic interval of interest is sampled. And with data from enough wells, as the Released Wells Initiative offers, we have been able to get full coverage of the critical boundaries,” explains Tore.
“The main uncertainty the cuttings data helps narrow down in this area is where the boundary between the Cenozoic and the underlying Cretaceous lies,” Tore adds. Wells in the area show quite a large distribution in thicknesses of the Paleocene Tang Formation, which sparked the question whether this has a genuine geological explanation or is rather the result of uncertainty as to where to place the boundary.
The cross-section below shows a number of wells from the study area and the variable thickness distribution of the interpreted formations (the coloured bars on the left side of the mineralogy plots). But is it correct?
In the well second from the right, there is a clear mineralogical change from the Upper Cretaceous Springar Fm to the Paleocene Tang Fm above. Both are deposited in a deep marine environment, but the change in mineralogy does suggest they are two distinct units.
However, this mineralogical transition is seen in nearby wells as being entirely within the Upper Cretaceous (Campanian to the Maastrichtian). This interpretation is supported by independent biostratigraphic studies, and suggest the well top depth reported on NPD Factpages is incorrect. As a consequence, the base Tertiary should be placed at a shallower depth.
Independent dataset
“Cuttings data offer an objective and independent dataset to verify biostratigraphic zonations which could be subject to interpretation and sampling bias,” Tore says. Sometimes one report disagrees with the other, especially in areas prone to reworking. Then it is useful to have another dataset at hand.
He also stresses that the main uncertainty in the present case study is associated with the overburden. However, biostratigraphic ambiguity is a common problem, also in reservoir sections of the Upper Jurassic across the NCS and UKCS as an example. For that matter, cuttings data might be useful as an independent dataset.
In summary, it is the integration of data that leads to a better assessment of the stratigraphic ages of the overburden, which in turn leads to a better understanding of the timing of burial and uplift, and hence hydrocarbon charge and retention. The work by Tore and the team at M Vest Energy is a perfect example of how the dataset from the Released Wells Initiative helps decode the subsurface.
HENK KOMBRINK