Provides a higher recovery factor
[Longread] The underlying motive for the development of PRM technology is to get the most oil and gas out of the reservoirs safely.
– Permanent reservoir monitoring is a powerful tool and an important part of the complicated work of producing as much as possible of oil and gas in the most cost-efficient way. The greatest value for us is to understand changes in the reservoir, or in the layers above and up to the seabed, changes which we do not expect, and that we discover something that we did not know beforehand.
With these two sentences, Mona Andersen summarises why Equinor for more than 15 years has invested heavily in the development of seismic technology that can be used for permanent reservoir monitoring (PRM). She is heading Equinor’s competence group Geophysical Reservoir Monitoring, which consists of four people, and one of their tasks is to assist the company’s acquisition plans and applications around the world.
– The task is to understand how the fluids move through the reservoir in response to hydrocarbon production and gas and water injection. If we can better understand this pattern, then we can better place the wells in relation to each other. Hopefully, we can also identify brand new pockets with remaining oil and gas, says Andersen.
The principle is basically simple; it involves monitoring changes in the reservoir pore pressure and fluid saturations, which can be recorded with repeated 3D seismic investigations (4D). Fluid saturation changes means that oil, gas or water has moved as a result of production. However, how large changes we get in the seismic due to changes in pressure and/or fluid saturation will vary from field to field, and will also vary with reservoir, depth and type of fluid.
– 4D studies can be done by three different technologies, says Olav Barkved, Senior Consultant in geophysics in Petoro, with 4D and PRM as prime areas, and with broad experience from both 4D and PRM from Geco, Amoco, BP and Petoro.
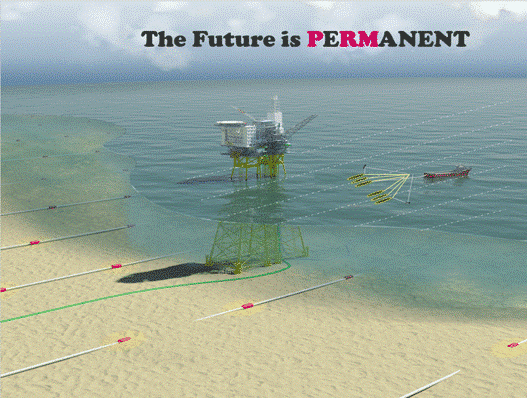
– We can choose from 1) conventional streamers towed in the water by a vessel, 2) nodes placed on the seabed (seabed seismic) and recorded after use (retrievables), or 3) permanent reservoir monitoring (PRM), where the streamers are permanently either buried in the seabed or open on the seabed.
– Conventional 4D with streamers is the cheapest solution, and as a rule of thumb, we have traditionally considered the cost of one PRM to be the same as the cost of two-three node surveys, and five streamer surveys, depending on the size of the field.
Andersen does not fully agree with these ratios, but points out that the large cost differences are due to the fact that PRM with the production of cables and new digging has a much higher investment cost, while acquisition costs per survey are lower than for the other solutions.
Barkved adds that the trend leans towards increased acceptance of nodes on the seabed, as well as of the use of optical listening systems. The node market is growing rapidly, he believes, and continuous new improvements of equipment and field operations allow for higher efficiency, and thus the opportunity to achieve lower costs.
4D gave a billion profit
Seismic data is the most important tool for the geologists in their search for oil and gas. It started with 2D (two-dimensional) seismic in the 1960s and continued with 3D seismic (three-dimensional) in the 1980s.
Developments in efficiency have resulted in major cost reductions, and greatly improved data quality has led to a “3D carpet” on the Norwegian continental shelf. Today, it is unthinkable to drill an exploration well without 3D seismic.
Already in the 1990s, the data quality had become so good that repeated 3D seismic programs, i.e. seismic data acquired at regular intervals, over exactly the same area and with the same parameters, were attempted. The purpose was to use seismic to optimize field production.
Because time had become a factor, geophysicists were now talking about 4D seismic. A major improvement in navigation systems was a huge contributing factor to this development.
– Better positioning allowed new data to be acquired at exactly the same location as the old data was acquired, and the data quality increased significantly, Andersen points out.
A small paradigm shift emerged
– The breakthrough for the use of 4D came in 1995-1996. Statoil then did extensive work on the Gullfaks field where about 20 new drilling targets were defined, and the production from these added value of just over one billion dollars, says Martin Landrø, Professor of geophysics at NTNU (GEO 05/2014: «Gold to Norway)”.
Everyone now understood the value of advanced reservoir monitoring. Therefore, today, 70-80 per cent of all producing fields on the Norwegian continental shelf use 4D seismic to understand the drainage patterns in the reservoirs.
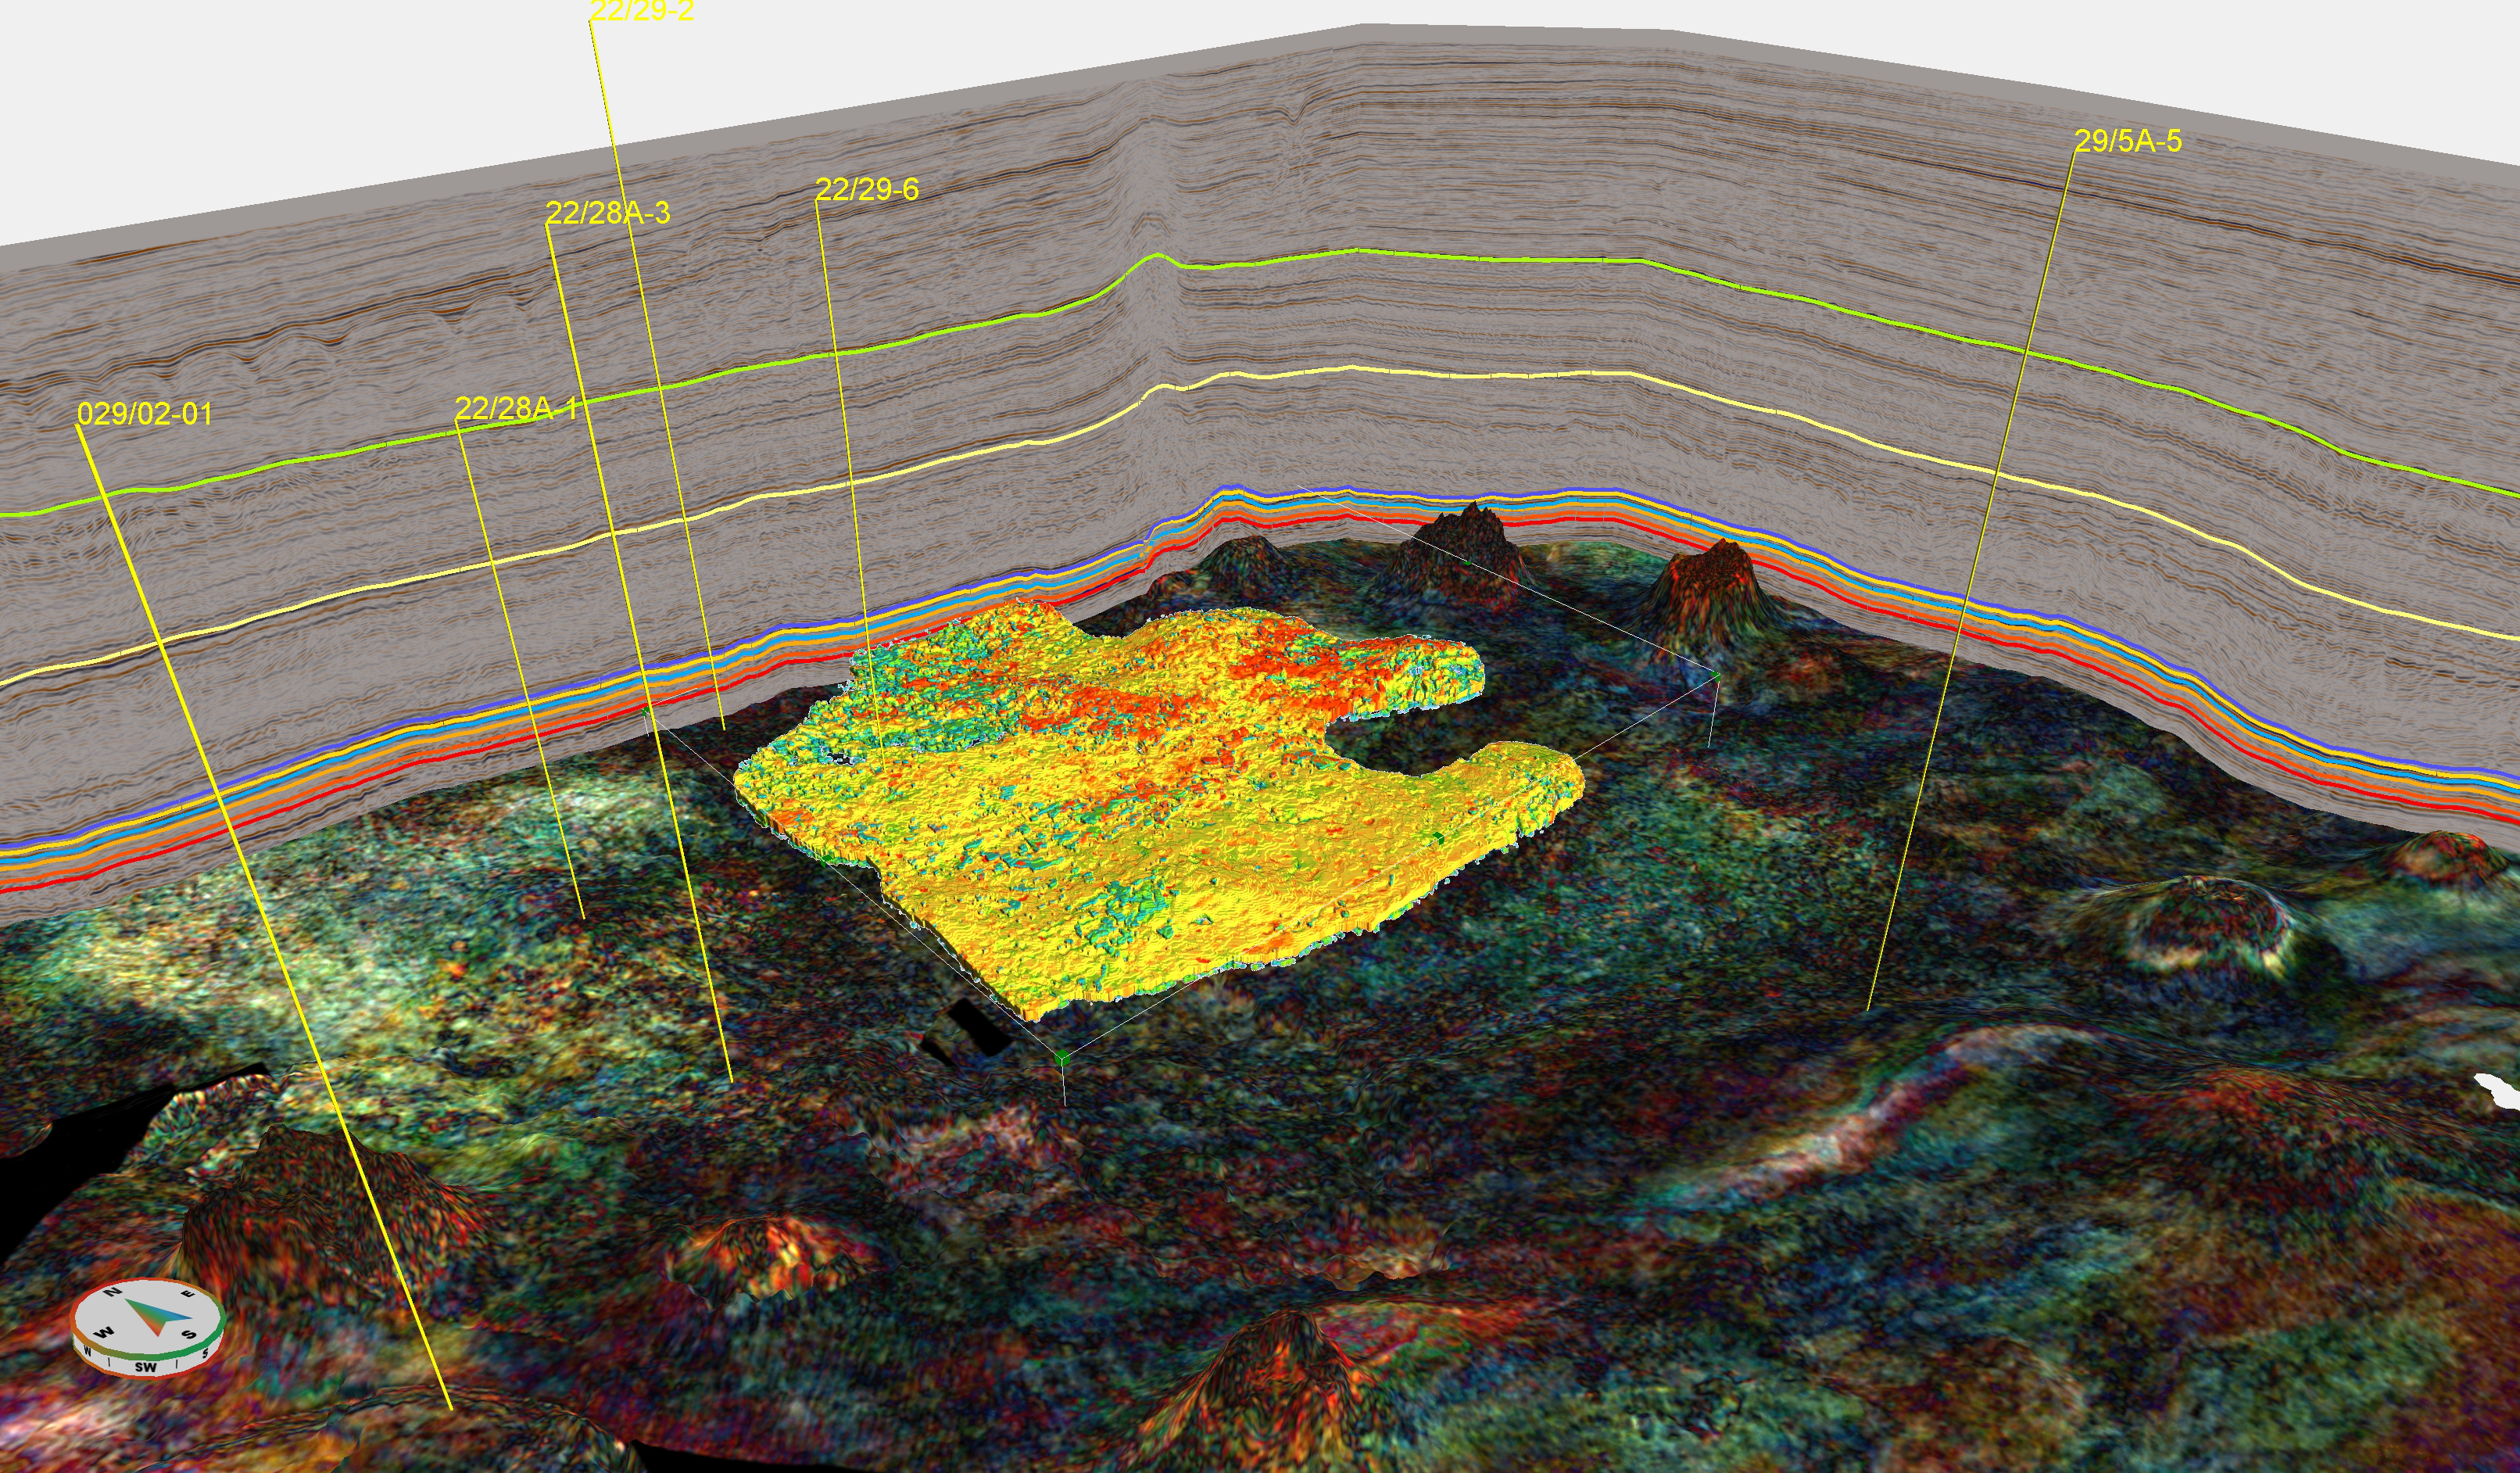
During the 1990s, BP made trials with the PRM in the British Foinaven field. The successful trials made the company install the very first system of permanent reservoir monitoring over an entire field, this time on the Norwegian continental shelf.
– The Valhall field proved to be a good candidate, and in 2003 BP buried 120 km of listening cables just below the seabed over a 45 km2 area, Landrø recalls.
The professor points to Olav Barkved, then BP, as a key person in the planning and implementation of PRM at Valhall. In 2006, Barkved was awarded the Norwegian Geophysicist Award by the Norwegian Petroleum Association for the job he did with the PRM. In addition, Valhall LoFS (Life of Field Seismic) has received a number of international awards.
– PRM began therefore at Valhall, and seven years later, ConocoPhillips followed suit with its own system on the Ekofisk field. Four years later, Statoil (now Equinor) installed the -at the time- largest PRM system in the world, at the Snorre field, and shortly thereafter the Grane field also had its own PRM system. In 2012, Petrobras installed a fibre optic PRM system in the Jubarte field, says Barkved.
– In addition, Equinor has installed a smaller PRM system at the Oseberg field to monitor a specific water injector, Andersen adds.
Valhall was a huge success, and in retrospect, we can conclude that a new paradigm shift was developing, albeit quite slowly.
Heavy investments
– BP invested $ 45 million at Valhall, and today we are talking about investments of between half a billion and one billion NOK’s before the source boat is crossing the field for new acquisition.
Heavy investments ahead of PRM are a major reason why things have moved forward so slowly, Barkved says.
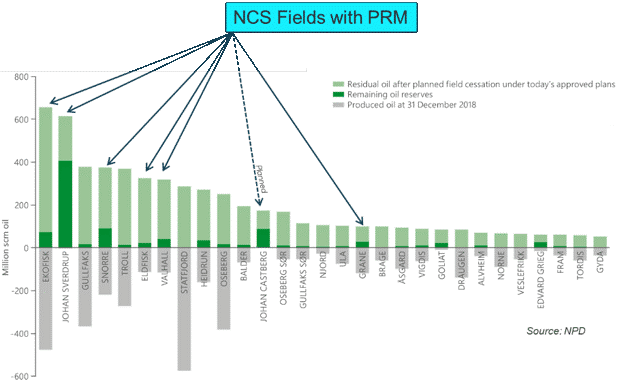
Lots of oil left – more to recover
According to the Norwegian Petroleum Directorate (NPD), about half of the oil and gas found on the Norwegian shelf has already been produced and sold. As is well known, these quantities have formed the basis for the “oil fund”, which is becoming staggeringly large.
Left is, amongst other things, what is called the “reserves” in the professional language. This includes oil and gas from fields that are either in production (e.g. the Johan Sverdrup field in the North Sea) or under development (e.g. the Johan Castberg field in the Barents Sea).
– By thinning only one per cent more out of the reservoirs, we increase the reserves by several hundred million barrels o.e. That is a good motivating factor, Barkved admits.
It is from this perspective interesting to look at how much additional oil it is possible to produce from the Norwegian continental shelf, and how new technology can help.
At the beginning of 2020, the Norwegian oil and gas reserves amounted to approx. 18 Bboe. Also, a number of discoveries made can be combined into reserves (5 Bboe.), while additional resources defined in various fields can be combined and converted into reserves (4 Bboe). Together, this totals approx. 27 Bboe, or put another way: this is equivalent to more than five Statfjord fields, with only one per cent representing 270 MMboe.
The oil companies are therefore working intensively to increase the reserves in every field, both before and after they come into production. The Norwegian continental shelf has developed into a first-class laboratory for the development of new technology that promotes this purpose.
This must be understood in light of the fact of how the Norwegian tax system works. It benefits both the oil companies and the state if the result of special measures for increased recovery will gain (even) more oil and gas from the reservoirs.
This also explains why oil companies are undertaking what they call reservoir monitoring. For this monitoring, they need dynamic data from both wells and seismic.
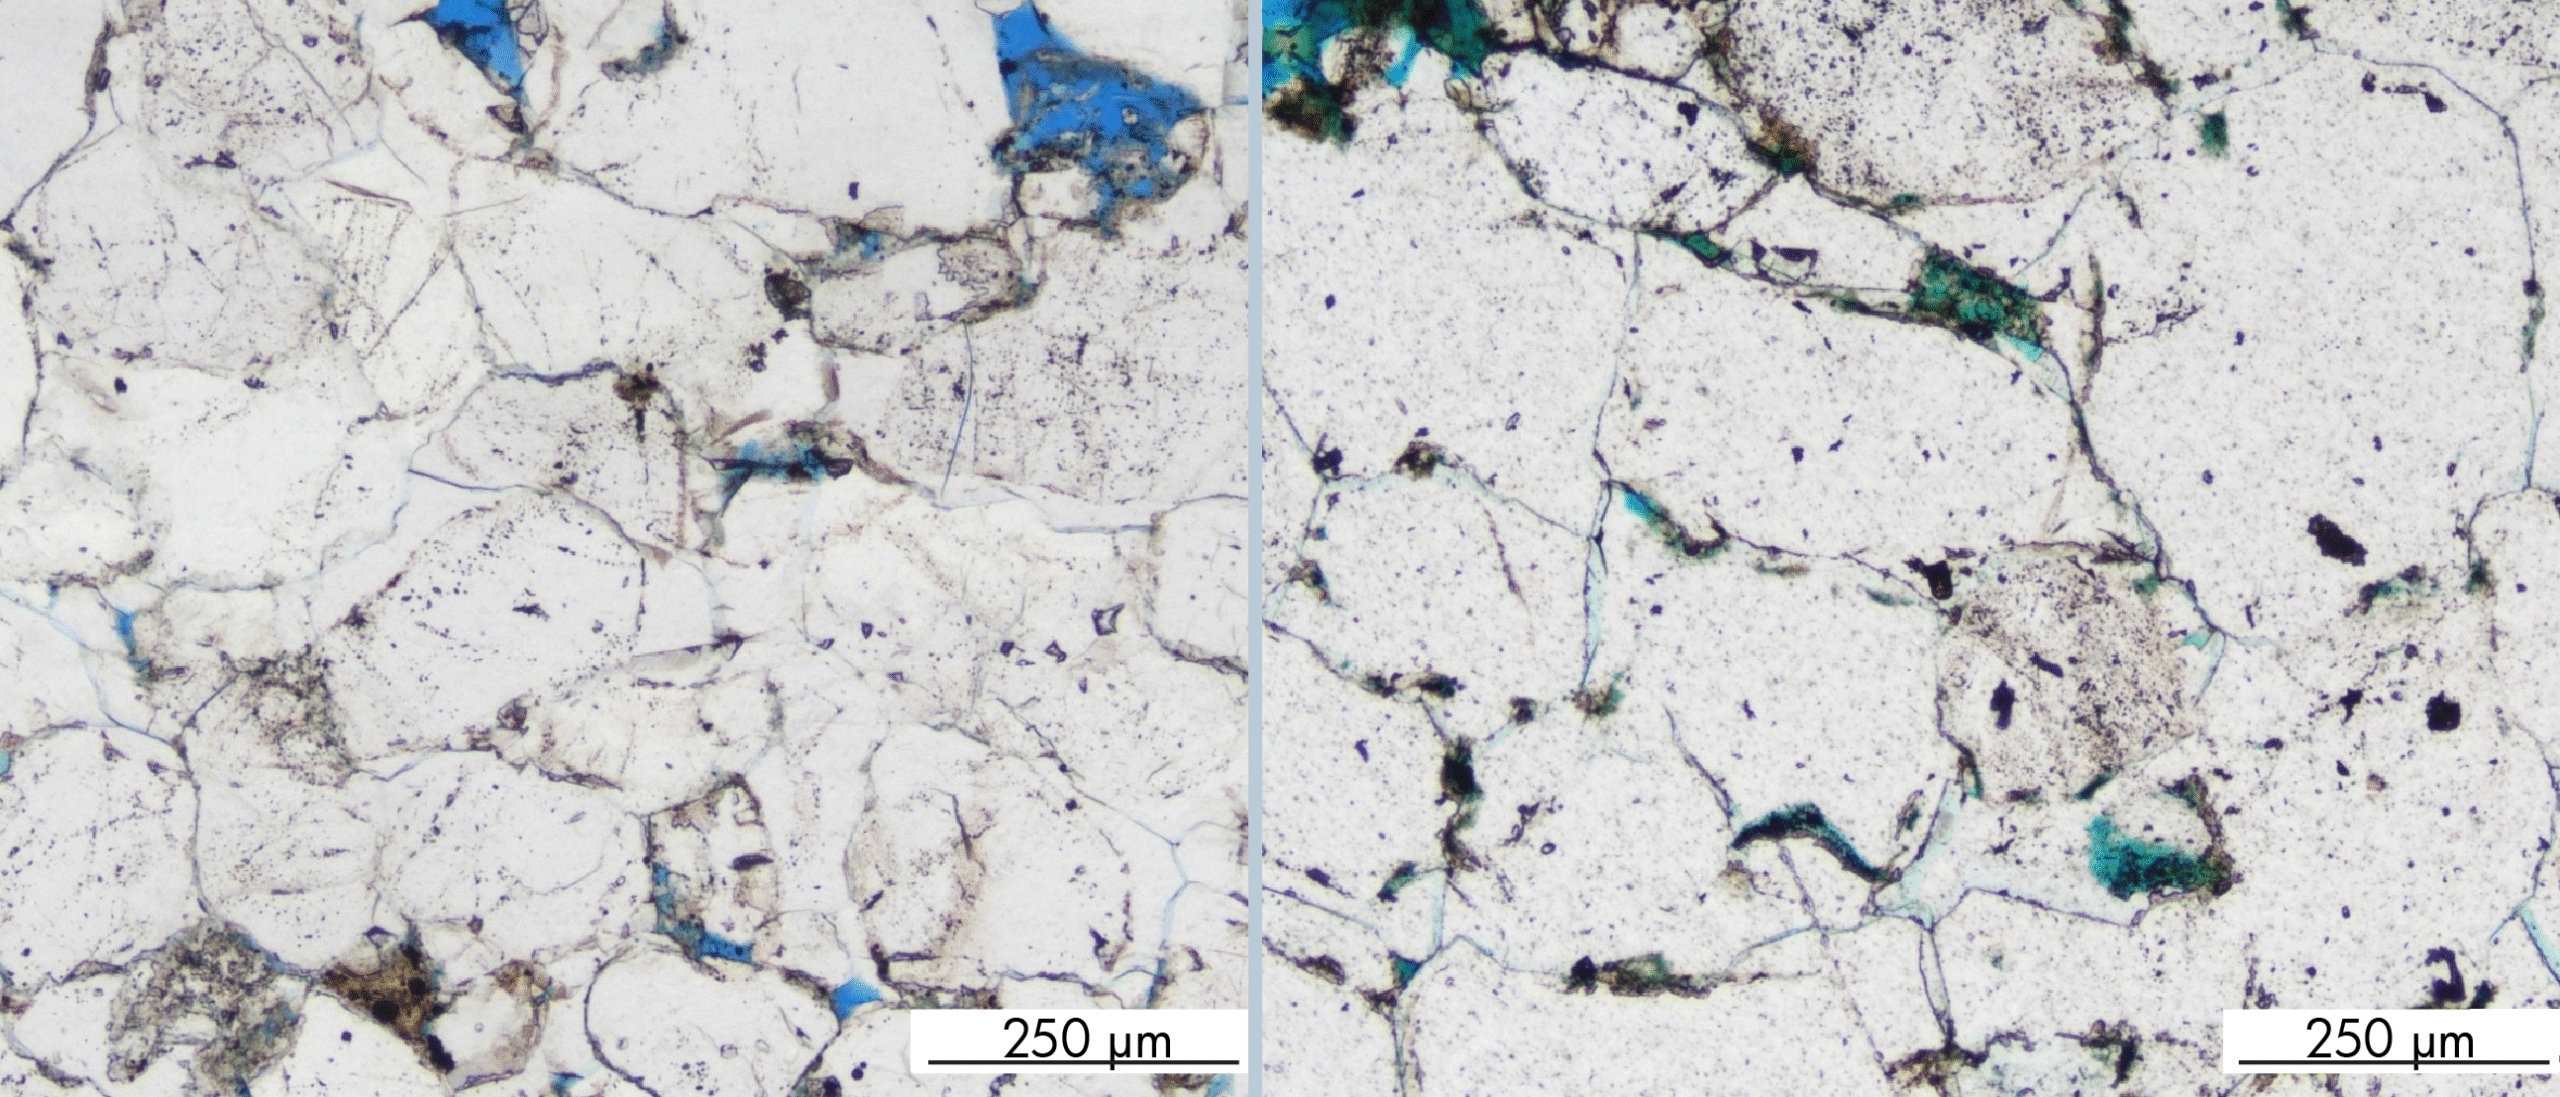
With repeated seismic surveys, reservoir engineers get a great amount of critical data, far away from – and in-between – the well paths.
Recovery factor and reservoir monitoring
Within any oil and gas field, there is a given volume of fluids. This is often referred to as “Stock Tank Oil Originally in Place” (STOOIP) and corresponds to the total volume that is in the reservoir before production begins.
It is never possible to produce this full volume, hence the volume which the reservoir engineers find possible to produce is the volume referred to as “the reserves”.
The ratio of reserves to STOOIP is called the recovery factor and is often stated as a percentage. The recovery factor varies from field to field, mostly due to differences and conditions within the geological framework, but it also heavily relates to the drainage strategy followed, and the technologies applied.
The recovery factor for the Statfjord field has now reached 70 per cent, and the goal is to achieve the same for the Johan Sverdrup field. But these are exceptions, not only in Norway but to a great extent also in the rest of the world.
The Ekofisk field is a good example of what can be achieved when there is a will to succeed: Initially, the operator believed that it was only possible to produce 17-18 per cent of all the oil present in the reservoir. Today, almost 50 years after start of production at Ekofisk, the recovery factor is up to 50 per cent.
To increase the recovery factor it is essential to have a thorough knowledge of the reservoir (“reservoir characterization”), as well as to understand how the fluids move and the pressure changes.
The first requires good seismic and well data, the second requires repeated seismic surveys and dynamic production data that can tell about movements and changes. This is what is called reservoir monitoring.
«Fresh & Frequent»
Ideally (and this is the case with the planned monitoring of the Johan Sverdrup field), a so-called baseline survey is acquired as a reference before production starts. Later surveys will then relate to this (and to each other).
– The key with PRM is that we get “fresh” and “frequent” data with good quality, Andersen points out.
– “Fresh” means that we can have data ready for interpretation as early as 1-3 weeks after the data acquisition. This is a significantly shorter turnaround than for traditional 4D data; then it will take months, and often up to a whole year before the data is ready for interpretation. The consequence is that the data is to some extent outdated when available.
Having fresh data is a value in itself, and we see that PRM data can be used more actively as input to production and injection management than traditional 4D-seismic. For example, it is more difficult to control a well by seismic input if the seismic is up to a few years old, and where there have been major changes in both oil saturation and pressure in the meantime.
With frequent data acquisitions, it is possible to monitor rapid changes in the reservoir. Andersen explains that it will be easier to calibrate the 4D effects to actual changes in pressure and saturation when only 4-6 months have passed, instead of 3-5 years as with traditional 3D.
– The consequence is that we are reducing the uncertainty in the interpretation of the 4D effects and increasing “the use value” of the data. The data can also have an impact when it comes to changing decisions already made, as well as optimizing the drilling program by postponing or accelerating well targets.
Snorre
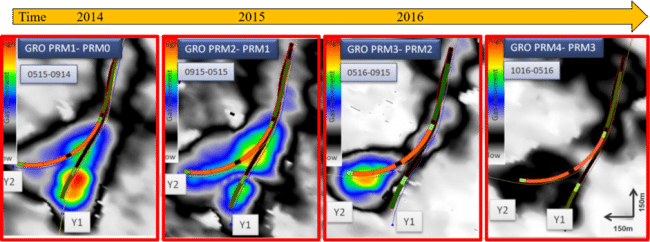
– From the Snorre field and several other fields we also have good examples of the possibility of detecting sealed faults, says Landrø. This is obviously an important observation for reservoir engineers.
– However, the Snorre field is primarily an interesting case because the operator has been able to monitor the effect of alternating gas/water injection (WAG) with the help of PRM. The injection periods only last for a few months and therefore only frequent, repeated surveys makes it possible to monitor in real-time, Landrø explains.
It goes without saying that the changes could not be registered if new data were only made available every two or three years, and Andersen supports Landrø’s statement.
– Due to the rapid changes in the reservoir, as a result of the alternating injection, short intervals between the repeated surveys are the key to success.
– The PRM in the Snorre field is, therefore, a good example of how this type of survey can be used to make quick decisions based on rapid changes, she points out.
Better data quality
– With permanent reservoir monitoring, we can in good cases see relative changes in fluid contacts down to even half a meter, says Andersen.
It sounds almost incredible, considering that the resolution in the seismic data is significantly less than this, but it is actually for real, the geophysicist confirms.
Experience also shows that PRM provides better data quality than conventional 4D data. Andersen puts forward several reasons for this;
– First, the cables with the geophones are buried and are therefore in the same position for each acquisition. Second, it is easier to control a source vessel than a vessel that in addition to the sources has long streamers floating in the water.
Another important element is that data coverage is improved.
Passive monitoring
Andersen also highlights that PRM can be used for passive monitoring, 24/7 because the cables are still there between each time new data is collected.
– We consider detecting earthquakes and monitor injection wells to ensure that these do not lead to fractures in the caprock. Noise from the drill bit can also be used to determine the exact position of the wellbore, and if hydraulic fracturing is used to increase production, reservoir engineers can obtain such information from this type of data.
-“Extensive research is still needed before we can maximize the use of passive data, but we envision that we can make good use of it in the future,” says Andersen.
PRM is teamwork
It is the geophysicists who are responsible for acquisition and processing, thereby ensuring the best possible data quality.
Andersen equally points out that collaboration between all disciplines in an asset team is required to interpret and analyse the data. It’s all about putting all the pieces together: seismic, production data, geological understanding and reservoir models, to find out what fits and what doesn’t.
– I want to know what’s going on in the reservoir, says Marit Ersdal, reservoir engineer in Petoro for seven years, and with a solid background from ConocoPhillips, Norsk Hydro and several other companies.
– For example, we want answers about whether our reservoir model matches reality, and how the reservoir responds to injection. Compared with the production and injection rates of the wells over time, PRM data gives a good picture of what is going on in the reservoir and thus provides valuable information for planning new wells or for improving contributions from existing wells.
Ersdal agrees that PRM is useful because it is a “fresh produce” and calls PRM a management tool to optimize production, and hence to increase the recovery rate of the field.
She strongly emphasizes the importance of the data being acquired frequently and the short time it takes to process the data.
– In this way, the accuracy is much better, and we have a completely different opportunity to continuously optimize the drainage strategy.
Requirements for feasibility studies
Andersen can confirm that there are multiple usages of PRM.
The beginning of conventional 4D was about finding the optimal locations for planned wells and locating pockets of residual oil or gas that were left within reservoirs. With PRM seismic gathered every 4-6 month, the oil companies get a much better picture of how the oil moves in the complicated reservoirs.
There may be changes in sand distribution and / or faults, preventing the oil from flowing as easily as the reservoir engineers initially thought. PRM data can provide information on this, and together with well data, they can gain an increased understanding of the field.
– With PRM, we are able to monitor rapid changes in the reservoir and use these learnings actively to optimize management decisions regarding well planning, reservoir and production monitoring. At Snorre and Grane we see 4D effects after only 1-3 weeks of production/injection of new wells. This has given 4D seismic a new application; important information to monitor complementation in new wells, more efficient planning and implementation of interventions, says Andersen.
However, conventional 4D or PRM is not suitable in all fields. An absolute minimum requirement is of course that changes in pressure and saturation create a 4D response and that the investment will pay off. Simply put, using such technology must not cost more than the value of the extra oil that can be produced as a result of dynamic subsurface data.
– For every field we consider, we always do thorough modelling of the expected response, and if we are able to see changes after six to twelve months, then we can proceed with the planning, says Andersen.
In Equinor, it is an absolute requirement that all fields being developed must have passed through a 4D feasibility study, to etsablish if PRM is a potential technology for value creation.
Want to produce as much as possible
It has been a long journey for Equinor, from the first pilot at Snorre to the installation of the world’s largest PRM on the giant Johan Sverdrup field. For the very first time in oil history, a baseline survey has been undertaken before production starts. New data will be acquired once a year.
Next is Johan Castberg. Over this field, there will also be a reference survey before production starts.
The purpose is to gain as good an understanding as possible on how the reservoir behaves in response to the production, and then make the necessary amendments when it comes to well placement and drainage strategy etc. For Johan Sverdrup, the target is a recovery factor of 70 per cent.
– Development and implementation of new technology usually require ten years, and maybe even longer to reach full gain, but we have had faith, and therefore it has become a reality.
It would not have happened without an extremely good collaboration with the research department in Trondheim and many other good supporters within the company, Mona Andersen concludes.
HALFDAN CARSTENS