Typical geohazards which need to be identified pre-drilling include shallow gas, abnormal pressure zones and gas hydrates – all of which can have a crucial impact on future production operations and drilling decisions.
The benefits of conducting shallow hazard analysis in 3D seismic data as opposed to 2D include increased spatial accuracy and the improved reliability of post- and pre-stack amplitudes. This enables volume-based and amplitude-versus-angle (AVA) based attributes to be interpreted.
3D seismic data also allow global interpretation methods to be applied in shallow hazard interpretation workflows. Such global interpretation methods can be characterized as methods that generate fully interpreted volumes – often through the concept of geologic age. Global interpretation methods provide interpreters with the tools to slice through volumes of seismic amplitudes, and derived attributes, along geologic time lines, helping to recognize depositional features and potential shallow hazards.
Examples of such global interpretation include, the ‘Age Volume’ technique that assigns a value representing relative geologic time to each seismic sample position (Stark, 2003); PaleoScan software from French startup company Eliis (Pauget et al, 2009) that builds a geologic model by connecting each seismic event to the most probable neighboring events; and dGB’s own HorizonCube (de Groot et al., 2010). This article provides an overview of the HorizonCube and how it can be applied in shallow geohazard interpretation.
The HorizonCube for Geohazard Analysis
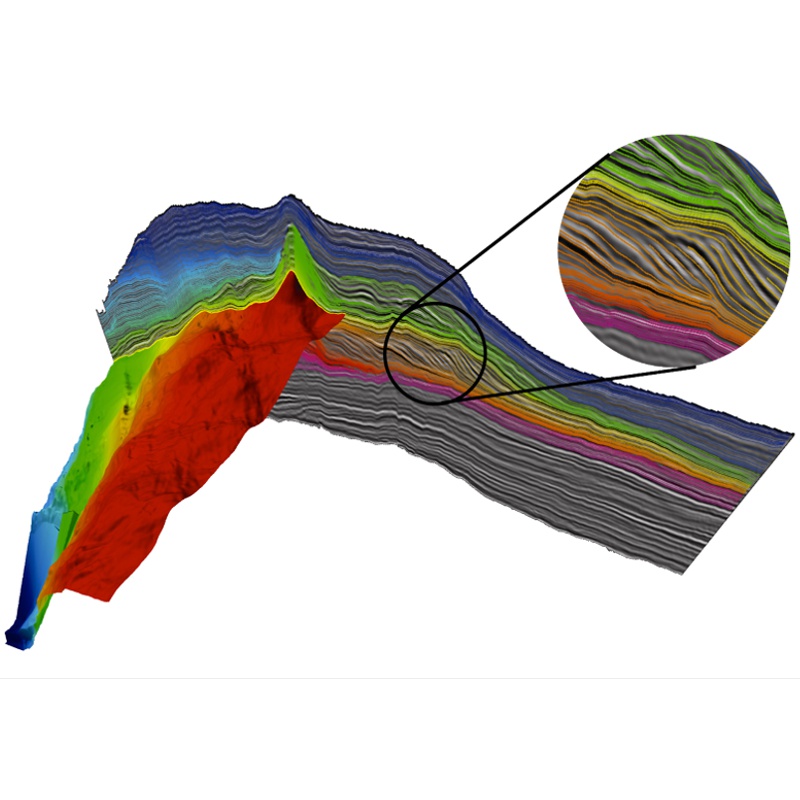 Figure 1: The HorizonCube is a 3D (or 2D) stack of horizons. The HorizonCube in this display is a ‘truncated’ one, meaning horizons stop when they get too close together. One of the horizons is displayed in its entirety. Only the intersection of the other horizons with the seismic line is shown. The inset shows prograding clinoforms, typical structures best captured through data-driven tracking. (Source: dGB )The HorizonCube is an emerging global interpretation technique that provides fully interpreted seismic volumes. Horizons are automatically tracked mainly using the seismic dip volume, but in a very complex geological setting a model-driven approach (i.e. a proportional interpolation method between framework horizons) is preferred.
Compared to conventional amplitude tracking, the HorizonCube algorithm is more robust in areas with low signal to noise, where diachronous events can be tracked as well as events that are phase inconsistent. As these horizons are also guided by a continuous dip-field, they may converge and diverge according to the dip of a seismic reflector. In this way, the key geologic features such as unconformities, pinch-outs and condensed sections can be highlighted.
While the HorizonCube and its fully interpreted seismic volumes and high resolution seismic has significant implications for sequence stratigraphy, geological model building, well correlation, inversion and geosteering, this article will look at the method’s applicability in shallow hazard analysis.
To generate a data-driven HorizonCube for geohazard analysis, a (dip-) SteeringCube is generated which calculates local dip and azimuth values of the seismic reflectors and generates a dense set of horizons throughout the 3D seismic volume. The dip/azimuth field is then smoothed, reducing the impact of random noise and allowing the user to control the detail that needs to be captured by the horizon tracker.
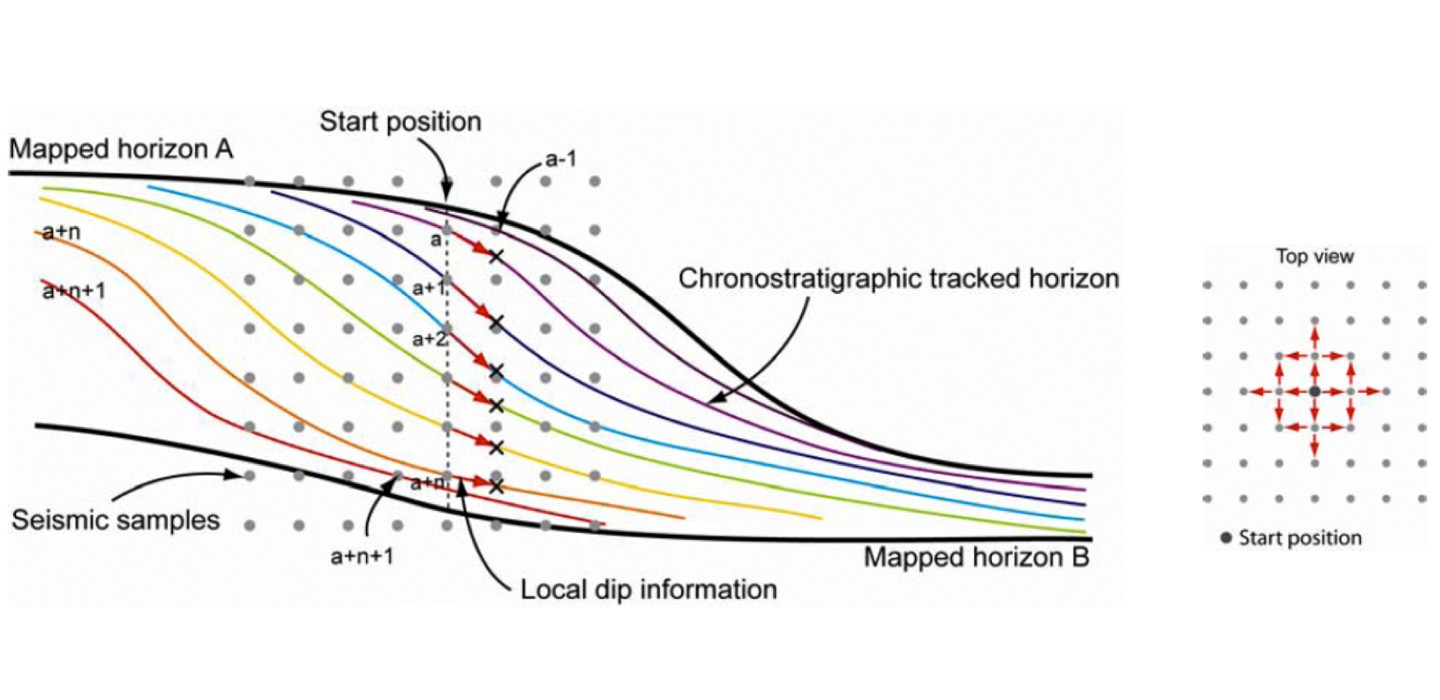 Figure 2: Tracking continuous horizons. (Source: dGB)
Horizons can be tracked in two different modes: firstly, as truncated horizons (Figure 1) that stop when they get too close together (when two events are getting close, only one stops). This helps to identify stratigraphic lapouts such as onlaps, downlaps and top laps. The second mode is where the horizons are tracked as continuous, staying together when they converge and never crossing each other. Figure 2 illustrates this, where all horizons exist at every X, Y position. Horizons start from a single seed position separated in time by one sample position (one sample is the closest one but it can be a multiple of one sample, i.e. 1,2,3 etc…) and help identify unconformities and condensed sections.
Implications for Shallow Hazard Analysis
The HorizonCube has key applications for shallow hazard analysis prior to the drilling of new wells.
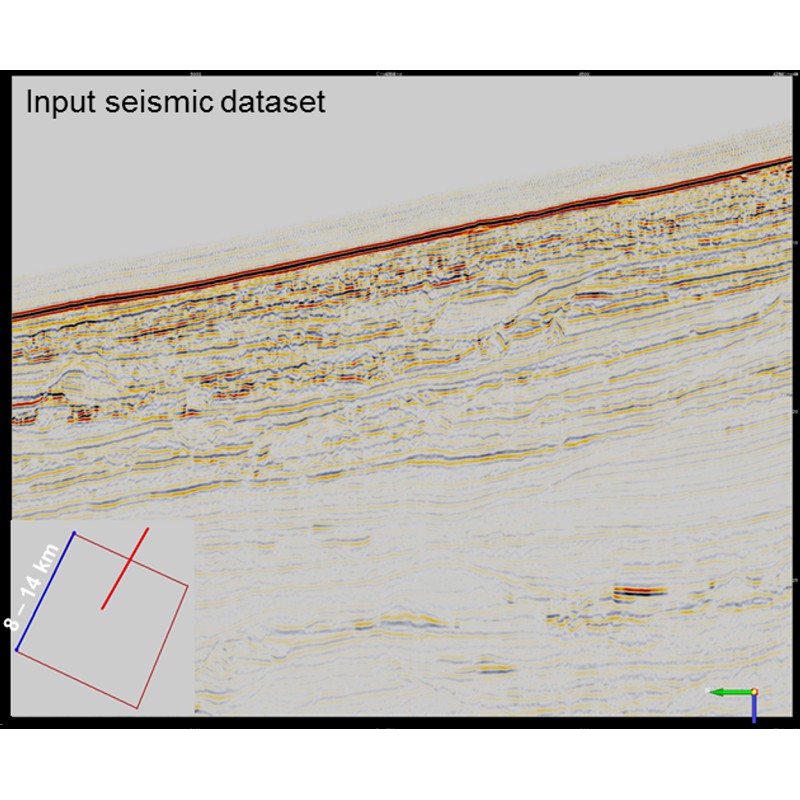
Figure 3a illustrates the input seismic data set for generating a HorizonCube where the volume is extracted from the larger 3D exploration seismic volume based around the proposed drilling location. (Source: dGB)
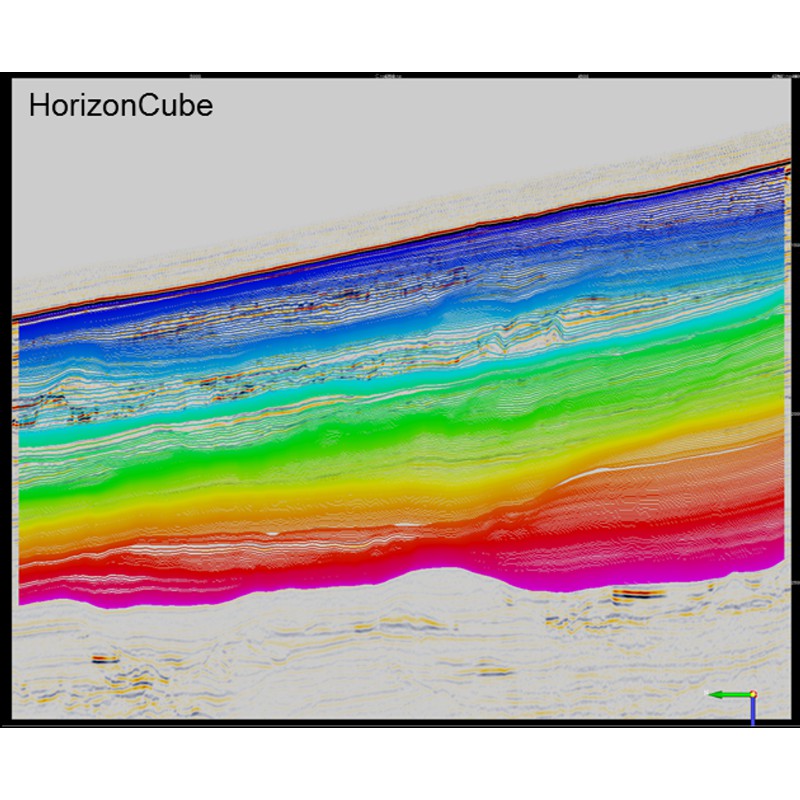
Figure 3b, the HorizonCube creates a pseudo-stratigraphic framework for flattening any attribute that may help assess the risks associated with identified shallow hazards. (Source: dGB)
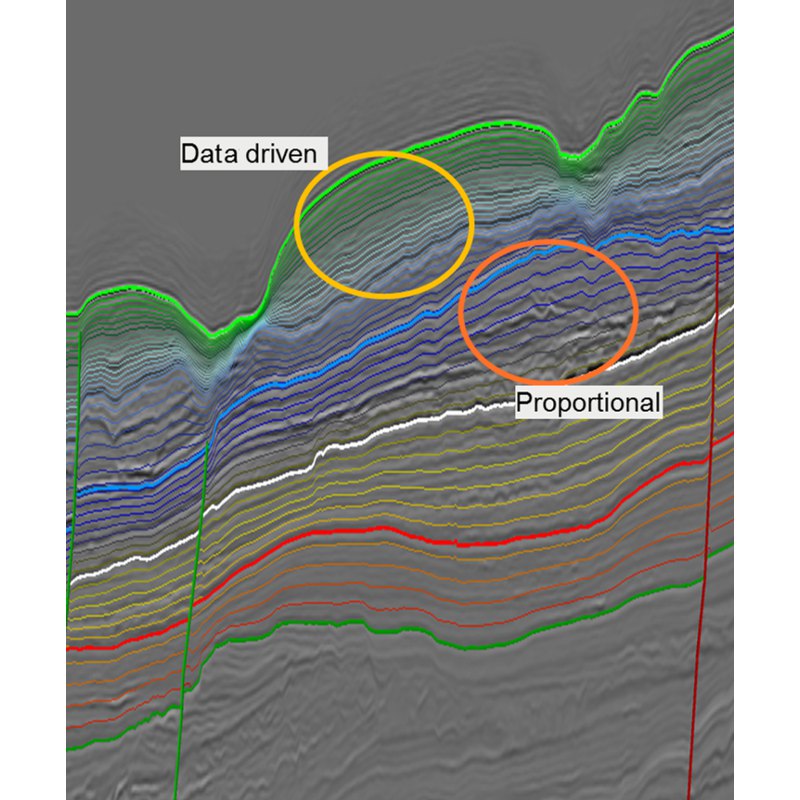 Figure 4: A HorizonCube using both a data-driven and model-driven approach. (Source: dGB)In a typical application, for example, a HorizonCube is created over the upper part of a conventional 3D seismic data set in a small area (typically 60 – 150 km2) centered on the intended drilling site (Figure 3). The focus is on the shallow section up to 2,000m below the water bottom. A dense set of horizons is mapped through a data and model-driven approach by tracking dip and azimuth information.
In some cases, however, the quality of the seismic prevents the data-driven approach. In such situations, a model-driven approach is more appropriate where relationships to bounding horizons, including ‘proportional’, ‘parallel- to-upper’, and ‘parallel-to-lower’, are identified. Figure 4 shows a HorizonCube that adopts both a data-driven and model-driven approach to create a continuous set of dense horizons.
Applying the Wheeler Domain
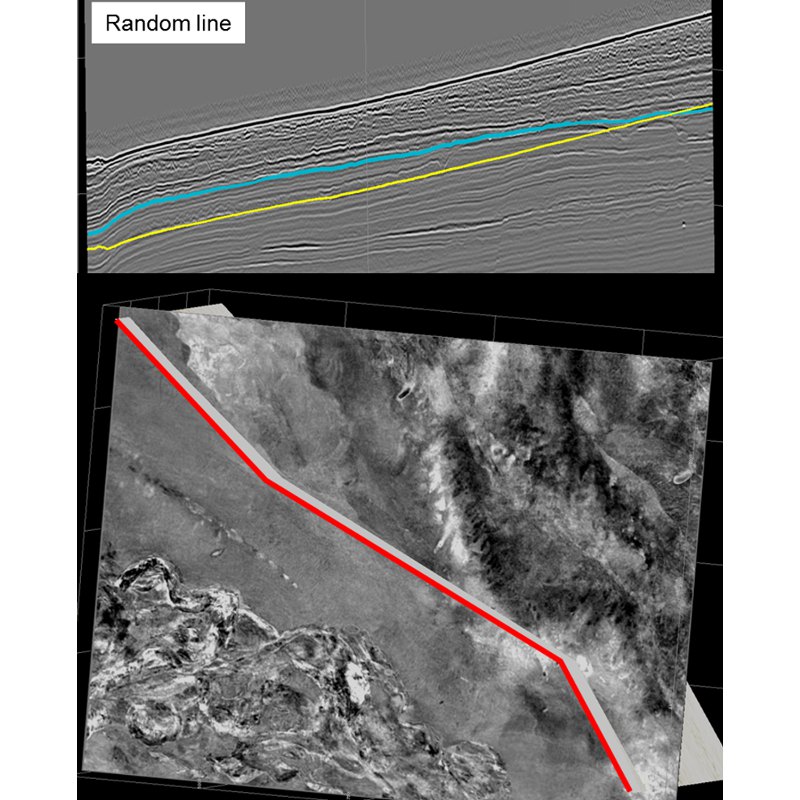 Figure 5: The HorizonCube follows the seismic dip in 3D with amplitude extractions having less ambiguity when compared to time slice and seabed flattened ones. The seismic section (top) is a random line shown in red (bottom) from the 3D seismic volume. The yellow line shows a parallel to seabed horizon and the blue line shows the horizon extracted from the HorizonCube, which honours the gross dip in 3D. Windowed Root Mean Square (RMS) amplitude extractions can also be used to take account of any imperfections in the HorizonCube. (Source: dGB)A key advantage of this technique in geohazard analysis is via the Wheeler Transformation (Wheeler, 1958) where, once a satisfactory HorizonCube is constructed, any attribute of interest can be stratigraphically flattened.
The Wheeler transformation warps the z-axis (time or depth) of Cartesian space such that every horizon in the HorizonCube is flat and their spacing regular. Within this flattened space, the seismic data and selected attributes can be easily and efficiently sliced in a pseudo-stratigraphically consistent manner.
The interpretation of anomalies in the Wheeler domain increases the interpreter’s understanding of the spatial distribution and the timing of sediment deposition. Attributes can be flattened to assess shallow hazards, such as gas-filled shallow channels, fluid and lithology variation relating to seismic amplitude, pockmarks, bottom simulating reflectors, and faulting or truncations based on similarities.
In addition, Wheeler-transformed attribute volumes create less interpretation ambiguity compared to time or depth slices, or parallel to seabed slices. This is because the HorizonCube follows gross dip in a truly 3D sense, as can be seen in Figure 5.
The net result is that through use of the Wheeler domain it becomes possible to see stratigraphic details that help increase the interpreter’s understanding of the depositional environment and enable them to better analyse shallow hazards.
Deepwater Applications
To date, 12 exploration well site locations have been assessed for shallow hazards by BG Group (Selvage et al., 2012) using the HorizonCube methodology, with the main goal being to accurately map the complex shallow section around the proposed well locations. In the example shown in Figures 6, 7 and 8 the present seabed is characterised by active canyons and the depositional environment is reflected in the cross-cutting channelized and turbiditic deposits evident in the shallow seismic.
The interpretation of the appropriate hazard level associated with high amplitude features within the shallow section is significantly enhanced by the ability to slice through volumes along horizon slices. Potential connection between sand-prone channels and deep-seated faults that could provide a gas migration pathway can also be studied. These can be further risked based on potential pinch-out, isolation of sand bodies within encasing shales and/or conformance of sand bodies to structure.

Figure 6: One of a sequence of pseudo-stratigraphic amplitude slices shown from an 8 x 12 km volume for one of the drill site locations. The slices are extracted from the continuous HorizonCube on a step of every 20. An orange circle marks the proposed exploration well location. A starting point for shallow hazard identification is to pan through every pseudo-stratigraphic slice. This preliminary reconnaissance identified a meandering channel system that warrants further investigation with different flattened seismic attributes. (Source: dGB)
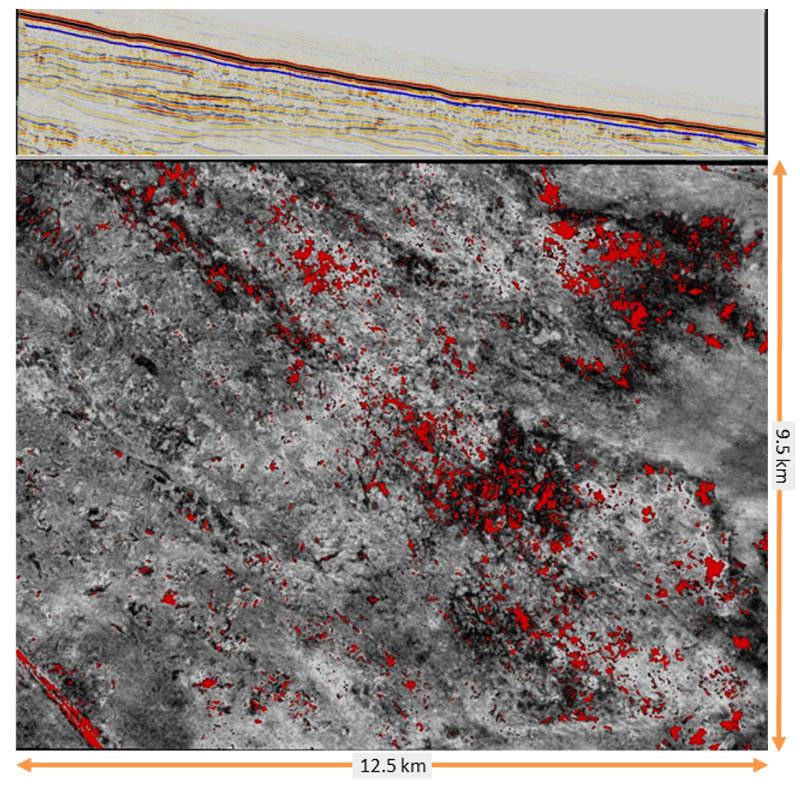
Figure 7: An RMS amplitude extraction from a pseudo-stratigraphic slice, clipped to show the brightest amplitudes in red. These features may be associated with shallow gas. Comparing the RMS amplitudes extracted with TWT extraction onto the pseudo-stratigraphic slice shows that features trend perpendicular to TWT contours. The TWT times can be used to search for whether the bright amplitudes are structurally conformable, which may increase the likelihood that they are associated with shallow gas. If structural conformance were observed, a Vp/Vs ratio attribute may help risk such features further. (Source: dGB)
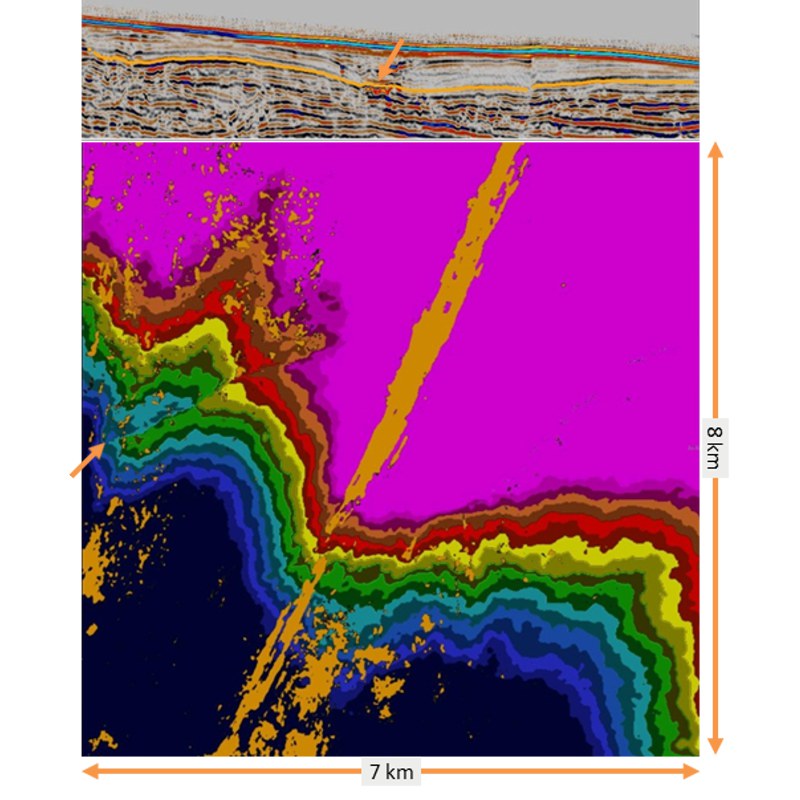
Figure 8: An anomalously high amplitude feature is observed in a synclinal feature on the pseudo-stratigraphic slice extracted from the HorizonCube (top). The TWT values are extracted onto the slice with bright amplitudes rendered in orange (bottom). The bright linear feature is interpreted as a shallow channel. The colour bar on the TWT has been squeezed to evaluate whether any bright amplitudes coincide with closure against the shallow fault observed on the pseudo-stratigraphic slice. (Source: dGB)
In this deepwater area, the seabed and immediately sub-seabed sediments were expected to be very soft with occasional sands. These intervals are often channelized and contain sandy intervals with higher porosity. Such intervals can have a chaotic amplitude character with bright amplitudes, associated with fluid fill or lithology (Figures 7 and 8).
Through this methodology, suites of pseudo-stratigraphic slices are generated over a large area when compared to typical shallow hazard studies. The result is a HorizonCube created over an 11 by 14 km area designed to cover one planned exploration well and two likely appraisal well locations, should the exploration well be successful. One of the appraisal wells was subsequently drilled in a different location, demonstrating the flexibility that the HorizonCube brings and its ability to detect geohazards.
A Greater Understanding
Today, the HorizonCube stands alongside other dGB interpretation tools such as ‘Chimney Cubes’ in their ability to detect geohazards. In the case of ‘Chimney Cubes’, for example, vertical anomalies on the seismic data associated with gas clouds and gas chimneys can be highlighted and drilling hazards, such as shallow gas pockets, identified.
It is clear that the HorizonCube as a global interpretation tool brings significant benefits, enabling any attribute of interest to be flattened in order to perform a more complete analysis of shallow hazards. This not only leads to a more holistic understanding of such hazards, but also provides greater flexibility in the choice of well locations.
Furthermore, additional developments are expected over the next few months to achieve greater automation and robustness in results, so interpreters can focus their efforts on assessing identified geohazards rather than manually searching for them. This will lead to improved drilling, well and reservoir management strategies and a considerable reduction in risk.
With special thanks to BG Group for supplying the data shown in this article.