Hydrocarbon production from resource plays (those in which the source rock and reservoir are the same unit) requires hydraulic fracturing of stacked horizontal wells. To ensure economic production across these wells, operators look to optimise spacing, stacking and completions across their acreage. In this article we discuss how fluid chemistry can be deployed to directly confirm or refine the assumptions made when optimising these developments.
Targeting the Right Zones
Evaluation of hydrocarbon richness and production potential across an operator’s acreage is a key early phase, prior to production and development. This evaluation can be done using a variety of toolkits, but few are direct measurements of the hydrocarbons within target zones themselves. To directly evaluate in-situ fluids you need access to core or cuttings. Analyses of these samples via pyrolysis methods (e.g., S1, S2, S3, where S1 = the amount of free hydrocarbons (gas and oil) in the sample, S2 = the amount of hydrocarbons generated through thermal cracking of non-volatile organic matter and S3 = the amount of CO2 (in milligrams CO2 per gram of rock) produced during pyrolysis of kerogen) allows rapid, inexpensive assessment of the character of the source rocks (e.g., richness, kerogen type, etc.) and insight into fluid mobility and physical properties (e.g., petroleum yield, API gravity, etc.). Three of the most important parameters are oil in place (OIP), oil saturation and oil mobility, all of which can be estimated from pyrolysis data. These factors all play a role in defining whether a pay zone is sufficiently rich in mobile hydrocarbons to be landed in. In Figure 1 a zone of interest has been identified and the goal is to assess saturation and mobility. The depth plot shows uncorrected mobile OIP (blue) and corrected OIP assuming an API value of 40 (red).

Figure 1: Geochemical oil-in-place (OIP) determined from pyrolysis data (bbls/acft) from pilot hole WBM cuttings. Blue line = uncorrected data. Red line = corrected S1 data assuming an API value of 40. The table shows conversion of geochemical OIP data to total saturation (So) using a range of porosity values. Credit: APT.
In this example we can take determined OIP, from the zone of interest, and assuming standard rock and oil densities, and a range of porosities, calculate total oil saturation (So), from which mobile oil will be lower, the extent of which is dependent on oil maturity. This screening workflow is the first stage in ensuring production is optimised, in this case landing zone optimisation, across stacked plays.
Understanding Your Drainage Network
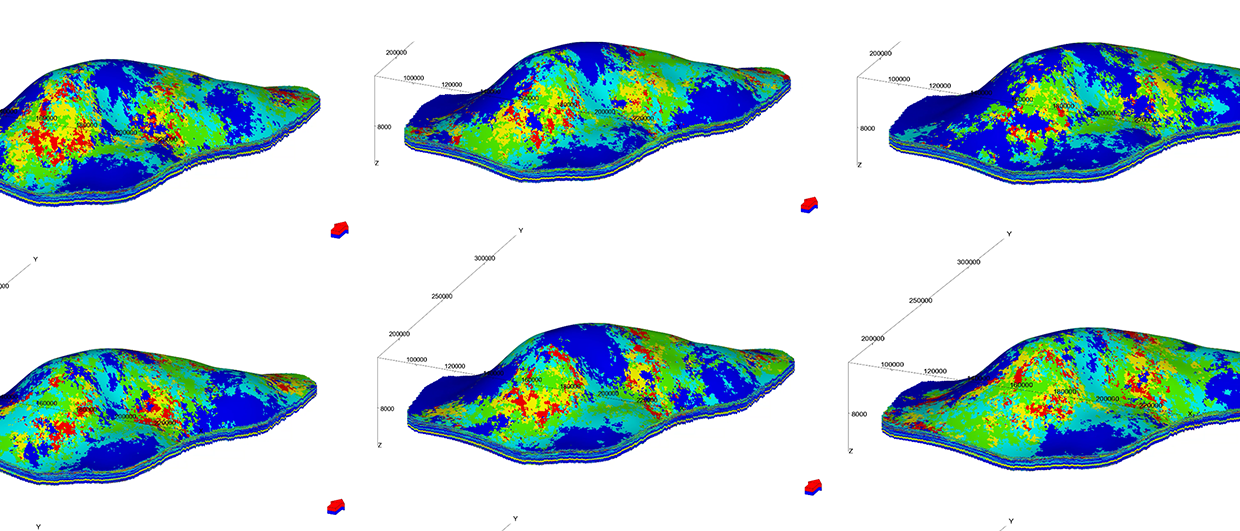
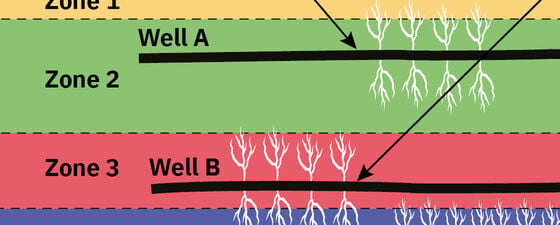
Hydraulic fracturing is the process by which fluids are produced in resource plays. The hydraulic fracture network consists of stimulated rock volume (SRV), the total extent of the fracture network, and drained rock volume (DRV), the extent of the network which drains fluids. DRV cannot be larger than SRV, but the DRV is also rarely static and changes through time, often reducing as fractures heal. Furthermore, these networks do not necessarily drain equally; lithology and associated permeability also play an important role in which formations are preferentially drained. For example, while rich shale zones are often targeted, these are juxtaposed against silt or sandstone layers which are more permeable and may be the dominant production fluid, even where the landing zone is a shale. There are numerous methods to infer where production is coming from, especially if you have at least a baseline understanding of fluid saturation and mobility. But, given the caveats discussed, the only direct way to assess and understand active DRV is to analyse the chemistry of the production fluids. In Figure 2, we have already characterised the end member (EM) fluid signatures from the four identified production zones from cuttings. The produced oils from the three horizontal wells can then be compared back to these EMs and source contributions to production can be defined. This allows rapid, direct evaluation of whether these source contributions match modelled expectations and what the results indicate about individual well production lifetimes.

Figure 2: Schematic showing the production contributions of four distinct production compartments across three horizontal wells landed in adjacent formations to one another, at a single point in time. Wells A and C are producing from their landing and overlying zones, while Well B is producing across three zones. Dominant production in each well is from the landing zone. Credit: APT.
Monitoring Through Time
Source contributions are generally measured at a single snapshot in time. These contributions, as indicated above, will potentially change as DRV refines from its initial state (iDRV) to its stable, established state (eDRV). Figure 3 is a generalised schematic showing how production signatures, monitored via fluid chemistry, change through time based upon differing fracture geometries. Monitoring of fluid chemistry through time is essential to understand drainage behaviour and evaluate long-term viability of stacking, spacing and completion designs. However, source contributions do not only change because of refinement of the DRV and therefore fluid chemistry results should be coupled with additional complementary datasets to further understand changes in DRV and whether these will be an issue for the economic health of currently producing and/or future planned wells.

Figure 3: Schematic showing variation in initial drained rock volume (iDRV) and established drained rock volume (eDRV) across two unique production compartments through time. A) iDRVs in the two wells overlap production compartments ensuring fluid chemistry in the wells is similar but, not identical. As we shift to eDRV, fluid chemistry becomes increasingly unique until the wells match their own production compartments. B) iDRVs in both wells are within their unique production compartments ensuring fluid chemistry of the wells match the production zones with minimal change in eDRV. C) iDRVs in both wells cover both production compartments with both wells producing identical fluids. eDRV shrinks in both wells but, coverage is the same ensuring fluid chemistry remains the same. Credit: APT.
Complementary Datasets
Even standalone, geochemistry offers the best chance to directly understand subsurface drainage dynamics. However, as noted, it is more powerful when coupled with additional complementary datasets. One complementary method, shown in Figure 4, is interference testing. In this example a well will be shut in and the offset wells are being geochemically monitored. Pre-shut in the geochemistry of the shut in well (4) and the lateral offset (3) are identical and measurably different from the underlying offset wells (7 and 8). During shut in, pressure and production monitoring indicates no change in the lateral offset wells 3 and 7, but well 8 shows an increase. The fluid chemistry of the wells also shows no change in 3 and 7, but in well 8 fluid chemistry has shifted towards the overlying zone and looks increasingly like well 4. Production data confirmed there was an issue and fluid chemistry data indicated where that issue was stemming from. The results suggest communication across the two zones during shut in and that vertical spacing is potentially destructive and therefore the stacking and spacing pattern is not optimised.

Figure 4: Schematic showing how combining geochemical data with interference testing can provide insight on the viability of stacking and spacing patterns. During shut in of well number 4 in Zone 3, pressure and production increases in well number 8. Geochemical analysis of the fluid from the underlying well 8 in Zone 4 indicates the DRV has moved up and well 8 is now communicating across both zones. Credit: APT.
This article highlights the value and utility of fluid chemistry data, from landing to completion optimisation, for directly understanding and evaluating drainage dynamics in resource plays.