
How often do you see a stack of hundreds of cutting photos along a well path, thereby allowing you to distinguish the main formation boundaries in the well with one blink of the eye?
During a talk at #DIGEX2021 yesterday, Kine Johanne Årdal from Pandion Energy presented how her company and partners DNO and Spirit have embarked on a project to make optimal use of the data that are becoming available as part of the Released Wells Initiative.
The “Released Wells Initiative – digital cuttings project” is a major undertaking whereby around 600,000 cuttings samples from all released Norwegian E&P wells are subjected to non-destructive analyses in order to determine the mineral composition (XRF) and white light and UV light photography. In addition, a limited number of cuttings are subjected to destructive analyses. These include QemScan, TOC and XRD and are currently making up about five percent of the wells (75). Read more about the project here.
Play with the data
As Kine highlighted at the start of her talk, given the major amount and variety of data, the first challenge was to create a platform that brings all of this together, enabling the explorationists to do what they are supposed to do: play with the data. This is why the consortium teamed up with Technology provider Itera to build a viewing and data manipulation tool called wellify.
In a demo delivered during the talk, Kine subsequently demonstrated that her team is now able to use the data in a way that enables them to quickly gain an overview of the well in question and then zoom in to the problem at hand.
The Cara discovery
The case study presented was about the Cara discovery in the North Sea (now Duva field). The discovery well (36/7-4) was drilled in 2016 and penetrated two Lower Cretaceous sandstones of the Agat Formation. An earlier well had penetrated the same succession a little bit more downdip in 2002 but was found dry. The central question the team faced was why the lower reservoir exhibited poorer reservoir quality than the upper reservoir.
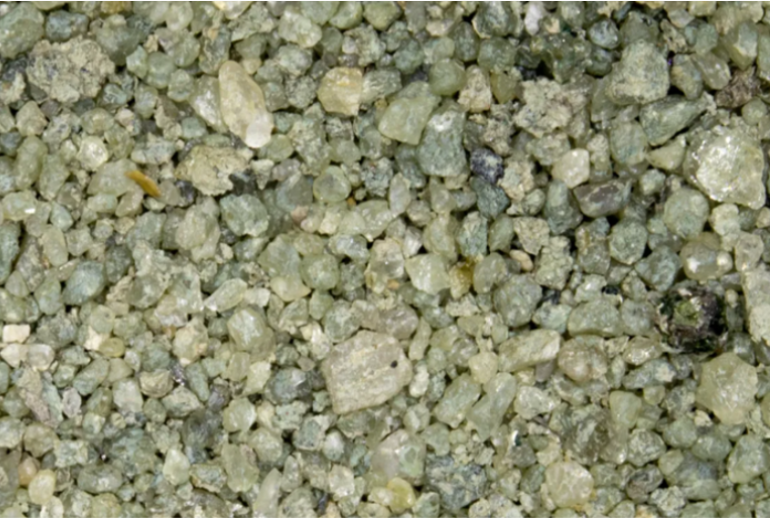
Now, based on the cuttings photos, it doesn’t need an expert eye to note the difference in colour of the upper and lower Agat sand. Whilst the upper sand is off-white, the lower one has a clear greenish tint. Kine subsequently illustrated what the likely mineralogical characteristics are that explain the difference in colour between the sands.
Plotting the major elements and QemScan results (not shown here), it was clear that iron oxide concentrations (hematite) are significantly higher in the lower than in the upper sands, as well as smectite and chlorite. Based on these observations, it is now looking likely that these minerals are the key to the poorer reservoir characteristics of the lower Agat sand.
HENK KOMBRINK