Around 100 km west of the Danish coastline, a big project was planned in the shallow waters of the North Sea. As announced in 2022, the Danes planned the construction of a so-called Energy Island. This island should gather electricity from surrounding offshore wind farms for distribution into the electricity grid in Denmark as well as to surrounding countries. It is a unique project, being so far from the coast, requiring an advanced understanding of not only the shallow subsurface, but also the geology deeper down in order to prevent any ground movement risks. How a Portuguese and Danish consortium took on the challenge to map and characterise the shallow and deep subsurface for the Danish Energy Island in a cost- effective way Denmark-based SolidGround and Portugal-based GeoSurveys were challenged to map and characterize the subsurface of the greater Danish Energy Island area in the most cost-effective yet technically advanced way. For this unique project, an understanding of the geotechnical parameters of the subsurface was needed down to around 800 meters depth. The analysis focused on determining the elastic parameters of the sedimentary layers spanning from the seabed to the Top Chalk surface. This information, which was validated by CPTs, has significantly contributed to assessing and mitigating settlement risks in the vicinity of the future Energy Island. The interpretation of the seismic data was done through the integration of the UHRS and HRS data and along with available well data (IDA-1) and numerous CPTs (see map). This also allowed a quantitative approach through which geothechnical parameters like Young’s Modulus and Poisson’s Ratio could be calculated across the seismic volume, in turn validated by the CPTs taken throughout the study area. The figure below shows that there is a good match between the seismic inversion results and the CPT data, providing confidence to the use of seismic data for the 3D mapping of geotechnical parameters. In In addition to the mapping of geotechnical parameters through seismic inversion, the classification of basic soil types is another important outcome of this project, which has greatly helped better understand the geology of the area. The seismic acquisition parameters were chosen in such a way to map the subsurface to a depth of around 1500 m, which is beneath the top of the Chalk. At the same time, the survey had to achieve high resolution in the uppermost sections, to obtain both deep and detailed information for amplitude variation with offset (AVO) inversion and seismic quantitative interpretation. For these reasons, it was decided to go for a dual seismic setup with an advanced sparker system (from Geomarine Survey System, B.V.) and airgun sources to cover the higher and lower frequencies respectively. Air guns (120 Cui 4 x Mini G. cluster) were used to reach down to 1500 m below seabed at 3 m vertical resolution and a Triple 800 Sparker was used to allow higher resolution in the upper 200 m (vertical resolution between 0.5 and 1 m). Cutting-edge pre-stack processing techniques were tailored for ultra-high and high-resolution data to meet project specifications, including deconvolution, demultiple, deghosting and migration. To maximise the benefits from both systems, velocities were integrated, aiming at enhancing detail retrieval not only for the uppermost layers with the ultra-high-resolution data, but also for deeper events using the high resolution system. Thanks to the integration of seismic and borehole data, a detailed picture of both the shallow and deep subsurface of the area around the Energy Island could be reconstructed. As the inversion results clearly show, the Miocene succession is dominated by fine-grained sediments, with some sandy intercalations especially near the top of the Lark Fm. These sands are gas-bearing in a limited area surrounding the IDA-1 well, but are not expected in the area of the Energy Island. The Quaternary succession is marked by the occurrence of a series of tunnel valleys, carved by subglacial erosion. The infill of the glacial tunnel valleys can be seen to change from sandy in the west (purple colour) to mud-dominated in the east, beneath the Energy Island. The subsequent infill of the tunnel valleys and their Upper Pleistocene and Holocene cover records a complex and highly dynamic environment with sediment deformation, Thrust complexes and other glaciotectonic deformation resulting from glacial load and ice-push have also been mapped, along with post-glacial deposits associated with cycles of deposition and erosion related with sea-level transgressions and regressions. The Holocene is characterised by marine sands, and the Energy Island itself is planned on top of a thick sand bank that shows a striking progradational architecture. Acknowledgements: Special thanks to Geomarine Surveys Systems for their support with the UHRS system and acquisition operations, and to Ocean
The Danish Energy Island
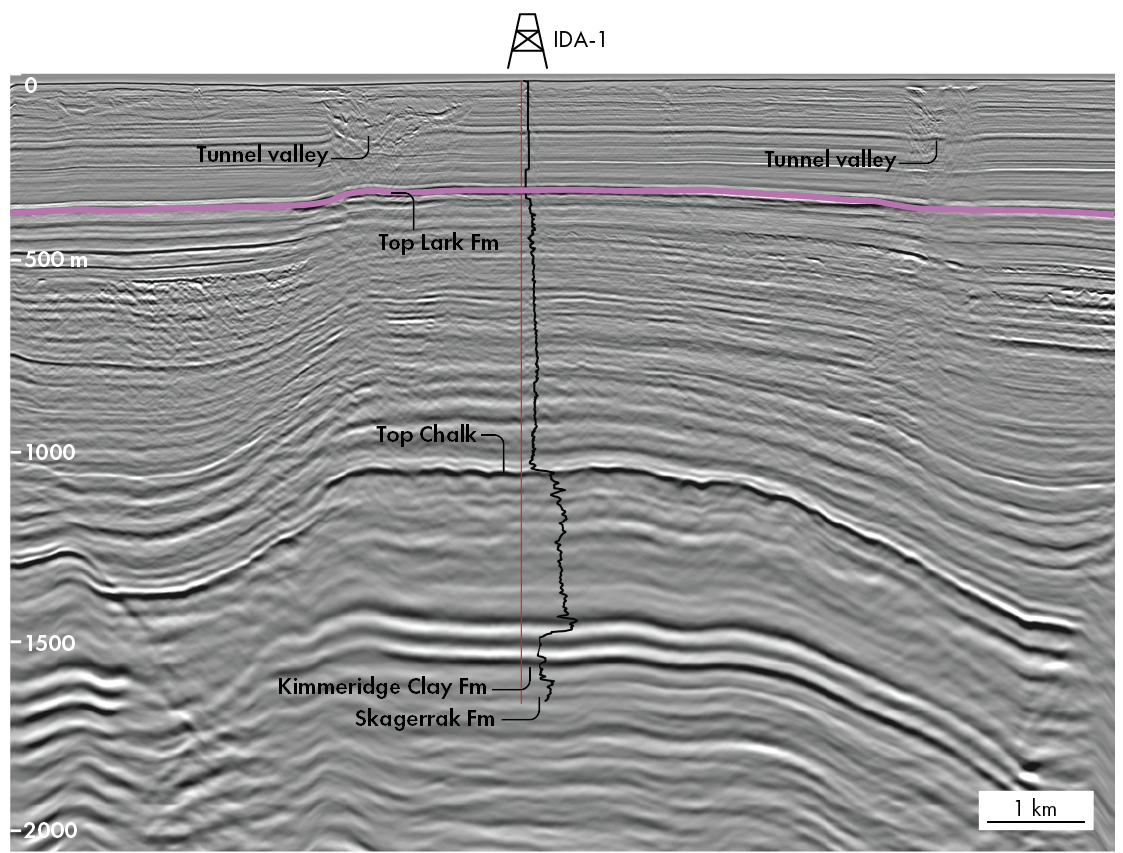
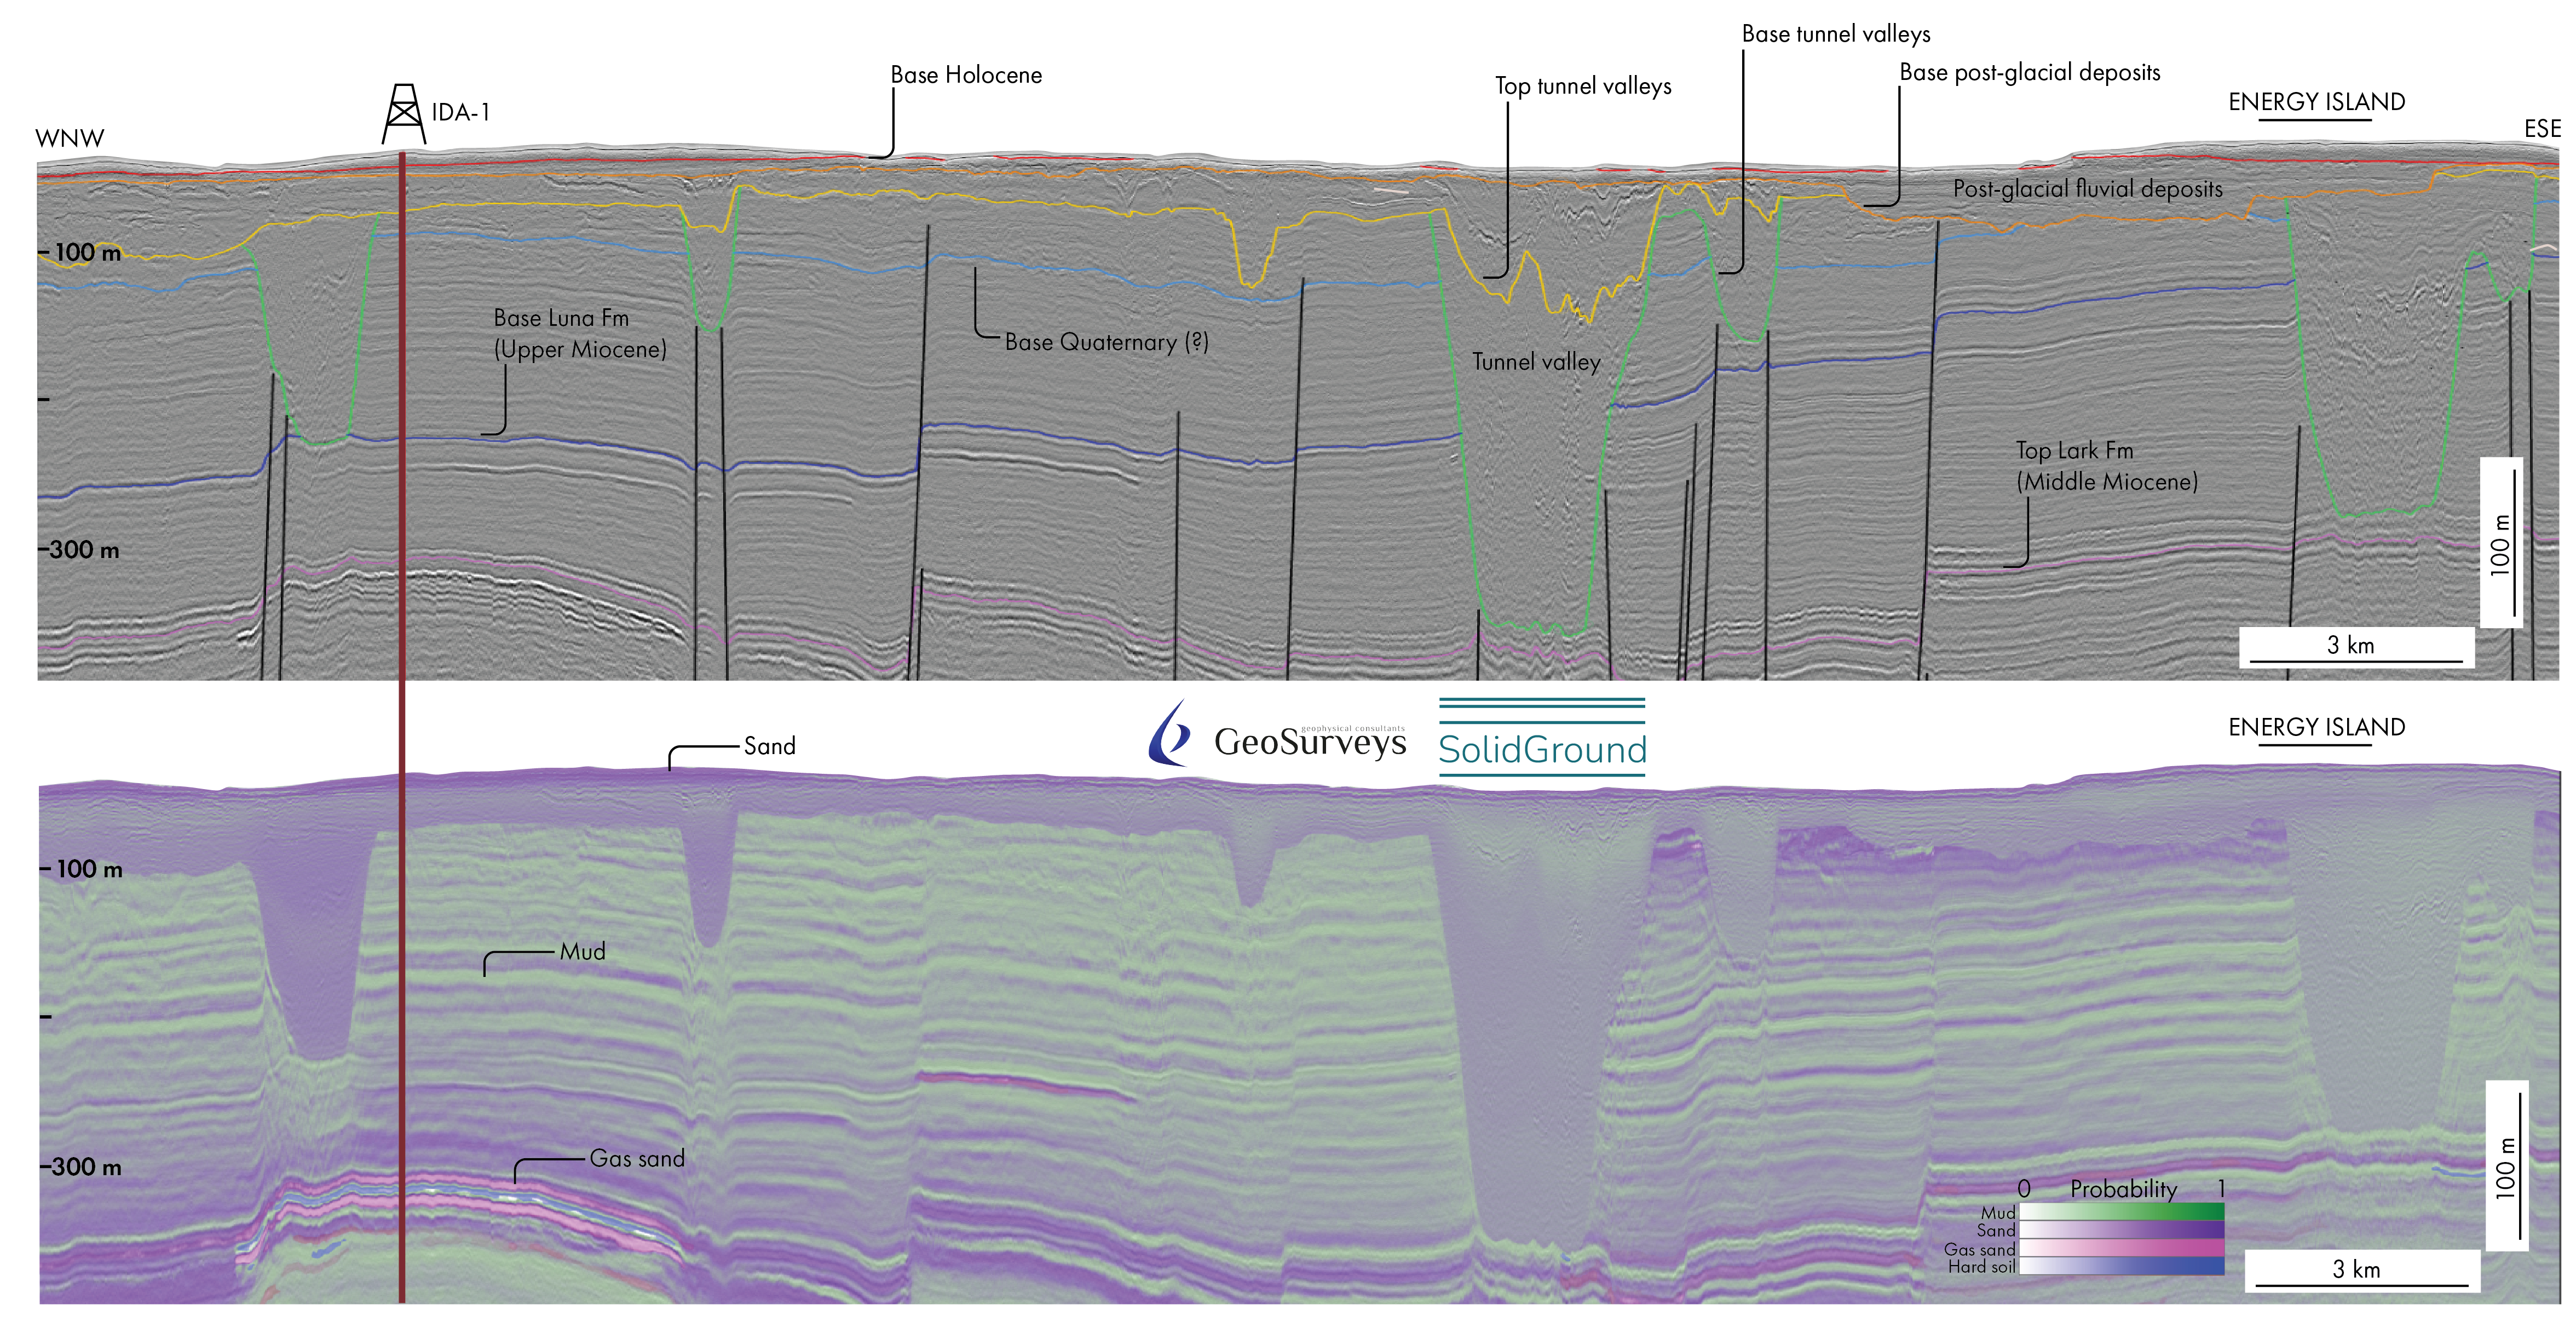 2D UHRS line between Energy Island site and well IDA-1, showing the general sub-surface architecture (above) and soil type prediction (below) of Neogene to Quaternary deposits. Detailed imaging and soil characterization of glaciogenic to post-glacial landforms and deposits of Quaternary age reveal several buried tunnel valleys exhibiting distinct stages of valley infill and variable sediment content; outwash deposits from glacial meltdown, including glaco-fluvial and lacustrine deposition and Holocene marine sands. Pre-Quaternary deposits are affected by a large extensional fault system, possibly related with deep Zechstein salt tectonics. Gas pocket within Upper Lark sand layers are clearly recognised at IDA-1, but gas is not detected elsewhere. The soil classification, plotted by highlighting the most likely soil type, should be read as follows: mud (green), sand (purple), gas sand (magenta), hard soils (dark blue) and lignite (dark red). Data from Danish Energy Agency.
Bridging the gap between seismic acquisition and geotechnical parameterisation
This could be done by drilling a very expensive and sparse grid of boreholes. However, it was decided to first map the area by integrating multi-scale
seismic and geotechnical data. This enabled optimising the location of the boreholes and resulted in a much better spatial understanding of the geotechnical parameters and potential geohazards.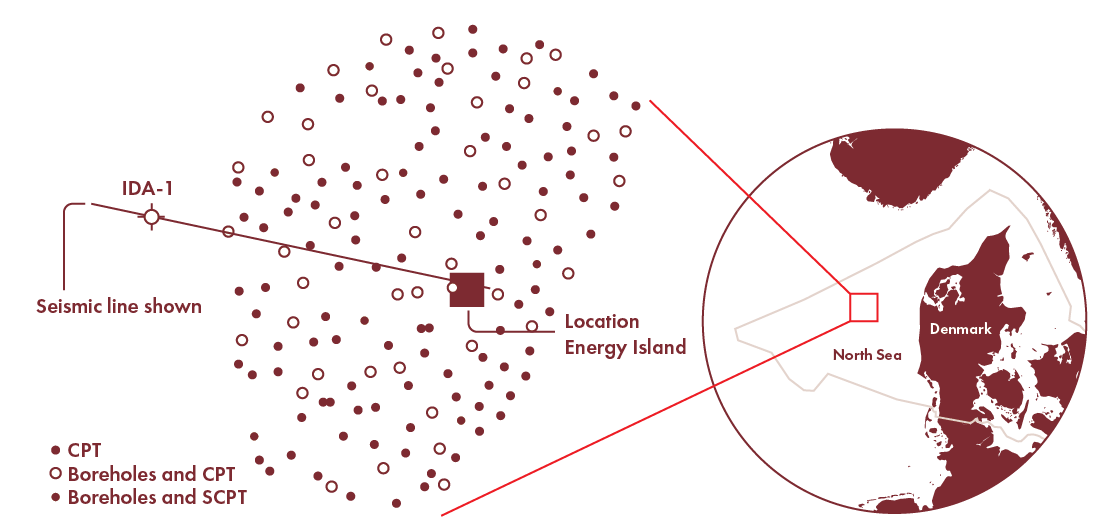
other applications, like wind farm foundations, cone resistance is not only important for QC and sanity check, it is also an important parameter for the design phase.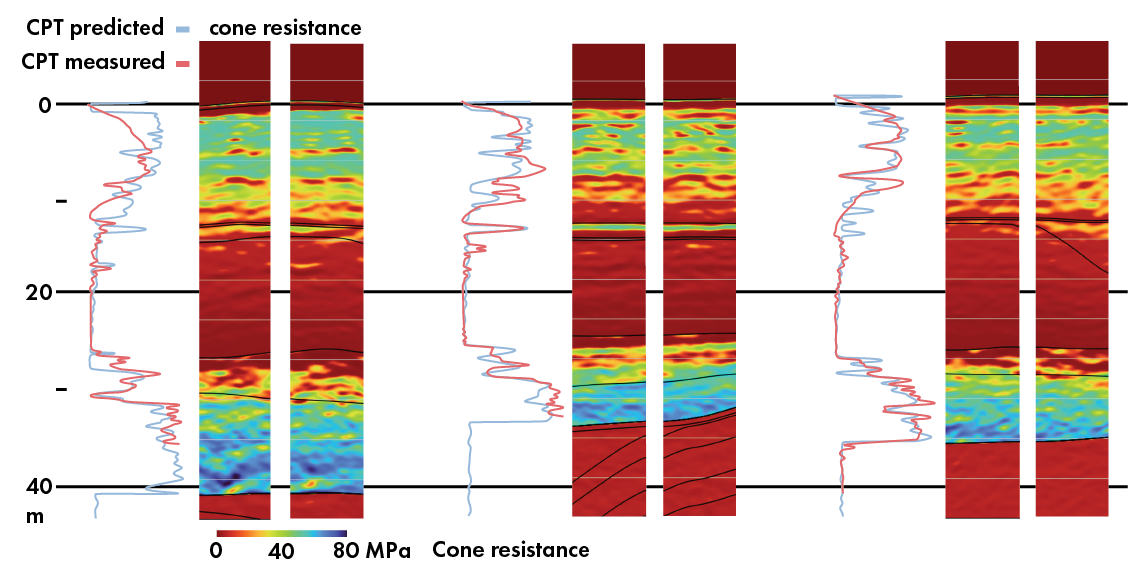
Seismic acquisition
The geology
re-occupation of valley incisions by pro-glacial drainage systems and outwash deposits from glacial meltdown, including glacio-fluvial and lacustrine deposition.
Infinity that led the survey as main contractor.Related Articles