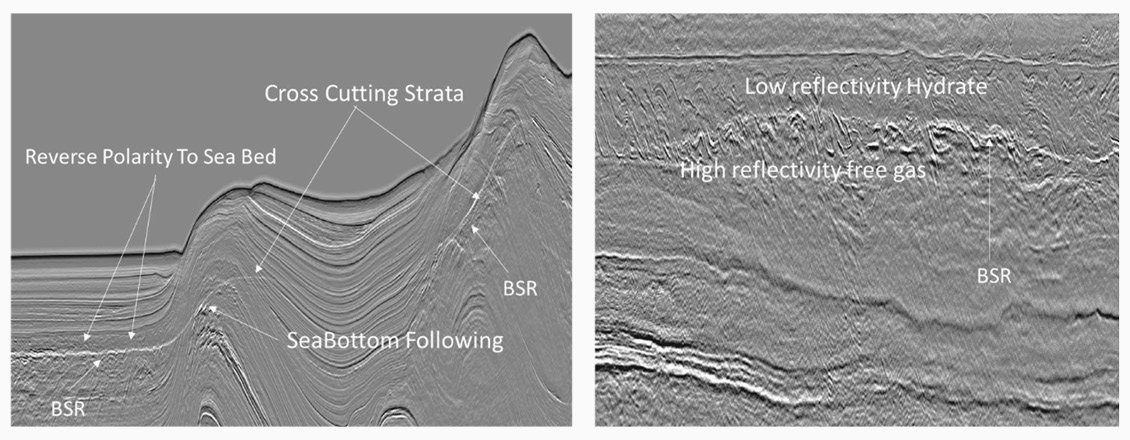
Determining the geothermal gradient in an undrilled region has direct implications for basin modelling and remains one the largest areas of uncertainty in frontier basin exploration today. Bottom Simulating Reflectors (BSRs) occur at the base of a shallow gas hydrate layer in many of the world’s deepwater basins and by calculating the geothermal gradient from the seafloor to base hydrate, quantitative and qualitative inference of the deeper heat flow can assist basin modellers in their work. However, BSRs do not always simulate the seabed and such deviant behaviour can lead them to be interpreted as ‘anything but’ the base of the gas hydrate. Yet such black swans suggest BSRs may be even more useful in mapping variations in heat flow and geotherm than we had previously recognised. Methane hydrate is an ice-like substance consisting of methane and water, that is stable at low temperature and under high pressure. In water depths greater than 300m (Sloan, 1990; Kvenvolden, 2000), this hydrate will form in pore spaces below the sea floor where methane is available, whether it is produced from biogenic or thermogenic sources. Yet in shallow sediments there is only a narrow stability zone (commonly a few hundred metres) for these hydrates, as temperature increases steadily with depth to a point where methane hydrate ice can no longer crystallise. The temperature of the phase transition sets a point below seabed that is marked by a change in acoustic properties – a significant decrease in acoustic impedance, where pore space is filled with free methane gas and water rather than dense ice. As temperature gradients in the first few hundred metres are consistent and reflect the heat flow in the basin, the acoustic change is found at a similar point below the seabed over large areas, generating a seismic reflector that simulates the seabed – hence a ‘Bottom Simulating Reflector’ or BSR. After consideration of some of the complexities of deriving the hydrate stability curve (salinity, hydrocarbon mix) and other variables (seabed temperature, BSR appearance) the thickness of the methane hydrate layer measured on seismic data can be used to estimate shallow geothermal gradients (Vohat et al., 2003). These gradients can be extrapolated qualitatively (for example Calves et al., 2010), or, with care, quantitatively (Minshull 2011), into the deeper stratigraphy to tackle one of the big unknowns in exploring for hydrocarbons in new basins – definition and constraint on source rock temperature and therefore maturity. the significant decrease in acoustic impedance observed on seismic data at the BSR generates a high amplitude event that has opposite polarity to the seabed and may cross-cut stratigraphy (see Figure 1). In general, a primary characteristic of a BSR is that it should follow and be parallel to the seabed (but read on for some colour on this…). Yet BSRs have several other distinguishing features – the hydrate may act as a regional seal trapping free gas below it in shallow reservoirs which have high reflectivity, and distinctive AVO character. Additionally, the seismic response within the hydrate appears muted, such that the amplitude of reflector response may change dramatically at the BSR (Figure 1). It is not all plain sailing though, if the BSR is parallel to bedding it can be difficult to see, or to distinguish from stratigraphy. Also, whilst sands seem well disposed to revealing the BSR, there is often a variability of BSR response within muds and silts that is not well understood. A BSR may be visible along a line, then disappear and reappear without obvious cause. Lastly there are situations where BSRs and multiples may get confused, and where modern multiple removal techniques have ‘zapped’ the BSR reflector. Fortunately, in deepwater settings these occurrences are few and far between. The main controls on BSR thickness are geothermal gradient, temperature at seabed, depth (i.e., pressure), and to a much lesser but still important degree, salinity (reducing the temperature at which the hydrate breaks down) and hydrocarbon mix (increase in ethane mixed with methane will increase the temperature at which the hydrate breaks down). A very approximate rule where little other constraint is available that may be used is that: Geothermal Gradient (from Seabed to BSR) = (8.54*Ln(depth to BSR) + 7.52)/(BSR thickness) (1) Note: Other rules of thumb are available. This equation assumes a seawater-methane mix, with a seabed temperature of 4°C. (Thickness in (1) is in km). The effect of increased pressure is to increase the hydrate stability and so increase the hydrate thickness. So, looking at regional dip lines of the world’s continental slopes one can see that the hydrate layer gets thicker with increased depth and therefore the BSR does not simulate the seabed. A beautiful example is shown in an article on the Pelotas Basin in GEO ExPro Vol. 10, No. 4 in 2013. Between shelf and basin floor, the hydrate thickens as expected due to pressure – implying that geothermal gradient does not change even though the crustal type changes from extended continental crust to oceanic crust. Globally the thickness of a hydrate layer at a given depth in various basins is seen to vary significantly (Kvenvolden and Claypool, 1988; also see Calves et al., 2010, Figure 12). This reflects the variation in both heat flow, and in how heat fllows, from basin to basin. This is key to prediction of source maturity in frontier basins, and sometimes BSRs can surprise us. For example, BSRs are observed in the Trujillo, Salaverry, Lima and Pisco Basins on Searcher’s reprocessed seismic dataset covering all the offshore basins (also see Auguy et al., 2017). However, a geothermal BSR-derived gradient based on the thickness of the hydrate layer indicates high temperature gradients of nearly 50°C/km. This has been corroborated by a value of 47°C/km observed in an Ocean Drilling Program (ODP) well (ODP 188), where methane hydrate was also recovered. Whatever the reason for these high gradients, the implications of a high geothermal gradient are very positive for future exploration as the Upper Cretaceous, Redondo Formation (Sternbach et al.,) is buried under a relatively thin sedimentary cover – like the prolific Sergipe Basin in Brazil, placing this source rock within the oil generative window. The example shown in Figure 2 shows the effect of free gas below the BSR. A pseudo-depth seismic section reveals that there are multiple separate anomalies within 4-way dip closures. We have already seen that BSRs do not simulate seabed if water depths increase significantly. When the seabed is flat and a BSR does not simulate the sea bottom, however, it implies that subsurface temperatures are varying significantly laterally. In the northern part of the Gulf of Papua, in the Moresby Trough south of the Fly River Delta and west of the Aure Fold belt, BSR-derived geothermal gradients over most of the extended continental crust forming this foredeep are remarkably consistent at 32–25°C/km. On the fold out line which runs NE–SW from the Fly River Delta through the Eastern Field Reef area in the Gulf of Papua, the hydrate layer dramatically increases in thickness approaching the reef indicating the reef is a local heat sink for the basin. The BSRs indicated on this line, either side of the carbonate reef, are the black swans of hydrate behaviour, being BSRs that do not bottom simulate. The high thermal conductivity of carbonate relative to clastics has led to heat being wicked out of the basin by pinnacle carbonate reefs that reach the seabed. This spectacular BSR has been mapped on 2D and 3D data and indicates that the geothermal gradient decreases from 35–30°C/km from the Aure Fold Belt and the Pandora area down to 15°C/km around the carbonate reefs. BSRs can be found in many frontier basins and without well data, comprise the only data-based guide for estimates on geothermal gradients. This may be qualitative or quantitative due to the uncertainties in the constraining conditions, yet they can provide a challenge to received wisdom that new venture explorers relish. That hydrate layers at a given water depth may have variable thickness locally within a basin, suggests they may be even more useful in mapping variations in heat flow and geothermal gradient than we might have expected
What does it mean when bottom simulators are black swans?
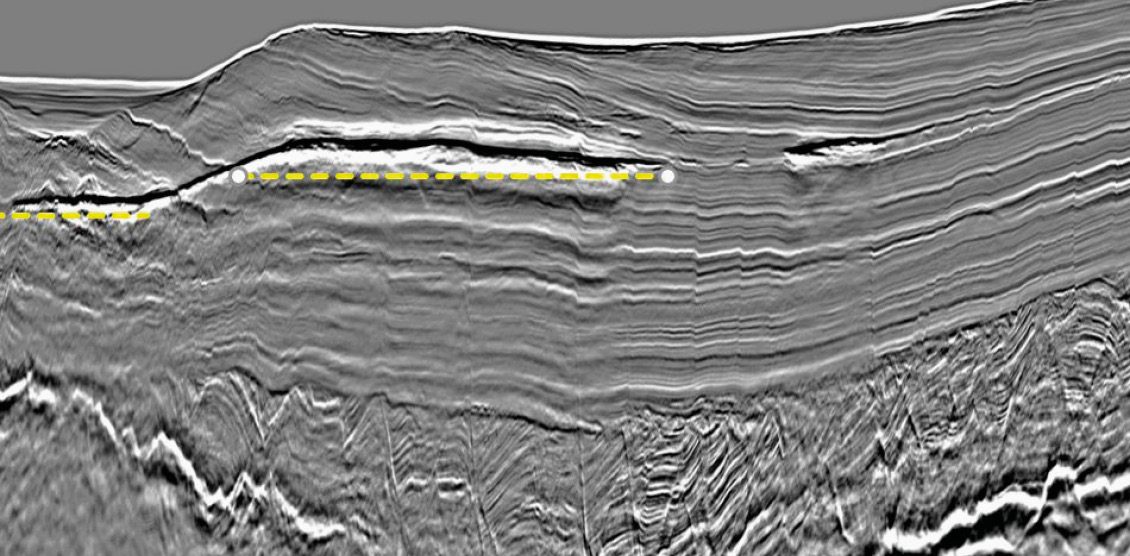
 West–East Line from the Laurabada 3D located near the Eastern Field Reefs, Gulf of Papua. PSDM processed displayed in TWT.

Bottom simulating reflectors in global frontier hydrocarbon exploration
Identifying bottom simulating reflectors (BSRs) on seismic data
Controls on BSR Gradients
When a BSR isn’t BS: the gulf of Papua
Challenging perceived wisdom
Related Articles